Member Services Desk
Weekly Market Update
Economist Views
Click to expand the below image.
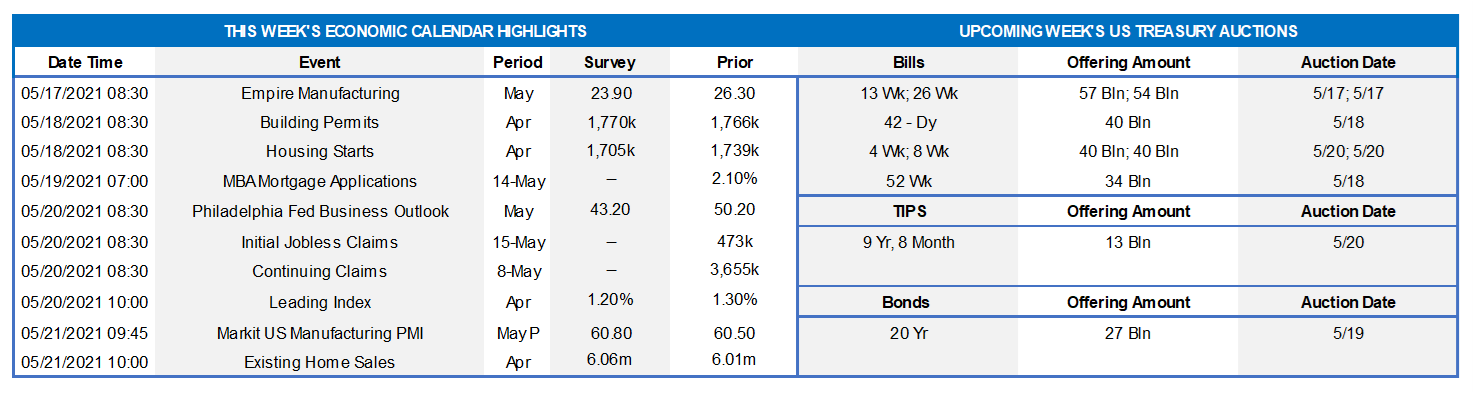
Empire State Manufacturing Survey: Factory activity in New York State probably expanded for an 11th straight month in May, albeit at a marginally slower pace than in April. The general business conditions diffusion index, i.e. the gap between the percentage of firms experiencing increased activity less those witnessing a decline, likely retreated to 25% from 26.3% in the prior month.
NAHB Housing Market Index: Home-builder sentiment probably remained near a record high this month. The National Association of Home Builders’ composite barometer of current and future sales and prospective buyer traffic likely was unchanged at 83% – well above the 50% mark associated with stable housing-market conditions.
Housing Starts & Building Permits: Reported declines in building materials sales and construction hours worked suggest that housing starts retreated slightly from the 15-year-high SAAR of 1.74mn posted in March. Responding to the continuing dearth of available dwellings on the market, however, builders likely filed for 1.77mn permits in April, up .7% from 1.76mn in the previous month.
Jobless Claims: Initial and continuing claims under regular state unemployment insurance programs probably moved lower during their latest respective reporting periods. Those figures continue to overstate the slow healing of the domestic labor market from the pandemic, however. Indeed, as of April 24, an estimated 16.9mn persons were still receiving some sort of unemployment assistance, down from the pandemic peak of 32.4mn reached last June but still well above the 2.1mn prevailing before COVID-19 struck in March 2020.
Index of Leading Economic Indicators: The Conference Board’s gauge of future economic activity likely climbed by 1.3% in April, matching March’s reported rise.
Existing Home Sales: Reported reductions in home-purchase contract signings over the February-March span suggest that existing home sales retreated by 3.5% to a ten-month-low SAAR of 5.8mn in April. With available listings likely declining by 1.9% to 1.05mn during the reference period, the stock of unsold dwellings is expected to move one tick higher to 2.2 months’ supply.
Federal Reserve Appearances:
May 17: Federal Reserve Vice Chair Clarida to give opening remarks at Atlanta Fed financial markets conference.
May 17: Federal Reserve Vice Chair Clarida and Atlanta Fed President Bostic to have an armchair discussion.
May 18: Dallas Fed President Kaplan to take part in moderated discussion at Atlanta Fed financial markets conference.
May 19: St. Louis Fed President Bullard to discuss the U.S. economic and monetary policy outlook.
May 19: Atlanta Fed President Bostic to be interviewed at a Businessweek/Bloomberg live event.
May 19: Federal Reserve to release the minutes of the April 27-28 Federal Open Market Committee meeting.
Click to expand the below images.
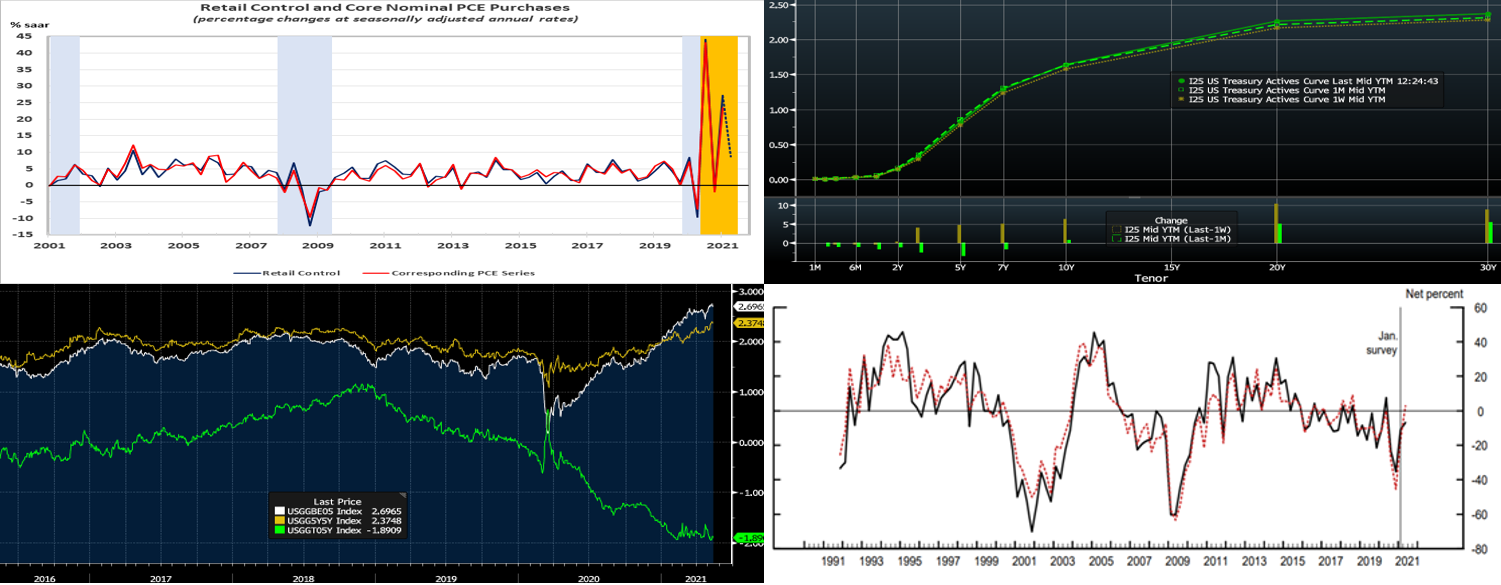
CHART 1 – UPPER LEFT
Source: Census Bureau, FRB St. Louis, FHLBNY; blue-shaded areas denote recession. Retail and food services sales remained steady in April, following a revised 10.7% jump in March. While shy of the 1% gain anticipated by economists, prior-month revisions left the level just .1% below that implied by the median Street call. Results were mixed across business segments. Net of a 2.9% rise in vehicle purchases, retail sales dipped by .8%, reversing little of the 9% jump posted in March. Clothing plus general and sporting goods were the largest drags on non-auto sales in April. Electronics, health & personal care, and restaurants provided lifts, with April’s rise in eating & drinking-place receipts especially encouraging. Excluding outlays on autos, building materials and gas, retail control – the portion used by the BEA to estimate nominal consumer goods spending – contracted by 1.5% in April, after a 7.5% rise in March. Still, the reading placed control purchases 8.6% above their Q-1average, thereby signaling a solid start to Q-2.
CHART 2 – UPPER RIGHT
Source: Bloomberg. Note: top pane is yield (%), bottom pane is change (bps). UST yields the past week mostly rose, in a “bear steepening” shift, with most of the move precipitated by the higher-than-consensus inflation report on Wednesday. Yields 4-year and longer led, as 2-year was unchanged while 5-year finished ~5 bps higher and 10 and 30-year were ~7 and ~9 higher, respectively. Other data released during the week generally reflected a positive trend. Meanwhile, the Fed continued to express patience via “stay the course”–type language in reaction to the inflation data. Despite some notable intraday market moves in the past two weeks, yields are modestly changed from a month ago. The Fed, as well as foreign and real-money investor buying, continues to provide a steady demand backdrop for bonds, thereby containing yield spikes for now. Worth remembering is that economic reports can be “noisy” and subject to revision, most especially coming out of a pandemic.
CHART 3 – LOWER LEFT
Source: Bloomberg. For some historical context on yields and inflation pricing in the market, charted here is the yield of 5-year TIPS (RHS, green, %), the Breakeven inflation rate on 5-year TIPS (RHS, white, %), and the “5-year, 5-year forward” Breakeven inflation rate (RHS, tan, %) from the TIPS curve. The market has clearly priced inflation higher in recent months/weeks. The “5-year, 5-year forward”, while higher, now trades below the 5-year and may reflect the market’s (if tenuous) and Fed’s belief that inflation will temper from a nearer-term upward trend (indeed, the Fed desires this development). Starkly evident in this chart, meanwhile, is the low level of the TIPS “real yield”. Even if upward inflation pricing by the market subsides, there is scope/risk of significant upward pricing of real yields in an economic-boom climate. For those with risk on their balance sheet to such an outcome, our Symmetrical Prepayment Advance (“SPA”), currently being offered on “special”, can serve as a hedge to a large upward yield move. Please see further details on the last slide herein and/or call the desk to inquire on further specifics.
CHART 4 – LOWER RIGHT
Source: FRB-NY. Depicted here is the “Net Percent of Domestic Respondents Reporting Stronger Demand for Commercial and Industrial Loans” (black line is loans to large or middle-market, red line to smaller firms) from the Fed’s April Survey of Bank Loan Officers. A strong economic recovery will hopefully propel this trend into positive territory and enable banks to attractively deploy liquidity.
FHLBNY Advance Rates Observations
Front-End Rates
Short-end Advance rates finished flat to a bp lower week-over-week. Money Market Funds’ AUM increased by ~$5bn on the week, led by a $9.4bn increase in Government-Only funds, thereby providing sustained demand for short paper. Meanwhile, the GSEs continue to invest larger sums into money markets, and the US TGA continues its decline. From a bigger-picture vantage point, the overall moderation in the supply of short paper, relative to high cash levels in the market, is expected to keep short-end rates relatively steady and under downward pressure in the year’s first half.
UST issuance overall is now net positive supply in that more is being issued than what the Fed is buying in its programs. However, with short UST rates at rock-bottom levels and the Fed on hold for a long period, rates are likely to persist in a near-term sideways to softer pattern. Importantly, weekly net T-bill issuance has been lower since 2020 and even negative in recent months, and Treasury has announced plans to shift issuance out the curve. The latest relief package and related borrowing may lead to an eventual increase of T-bill auction sizes and positive net supply, but overall market supply/demand dynamics should keep short rates in check on the upside.
Term Rates
On the week, medium and longer-term Advance rates were lower, in a “bear steepening” move. While 2-year was unchanged, 5-year was ~5.5 bps lower and 10-year ~7 bps lower. See the previous section for further color on relevant market dynamics.
On the UST supply front, this week brings a 10-year TIPS and a straight 20-year auctions. The market will maintain its attention on any Covid-19 and legislative developments this week, while also paying a close mind to fresh economic news.
Advance Special Offering: Symmetrical Prepayment Advance feature —Please contact your Relationship Manager at
212-441-6700 or the Member Services Desk at 212-441-6600 for information.
New Product Alert: In order to satisfy member needs and provide greater product flexibility to match bond and derivative market conventions, FHLB-NY now offers SOFR-linked advances based on SOFR-index compounding. Note that this product is in addition to SOFR-linked advances based on SOFR-index averaging which have been offered since November 2018.
The Symmetrical Prepayment Advance Feature
With rates at or near multi-year lows, it is a compelling juncture to use the SPA feature on term advances. This feature allows member to capture, at prepayment, changes in the Fair Value of the advance which are favorable to the member. Contact us to discuss.
Looking for more information on the above topics? We’d love to speak with you!
Questions?
If you wish to receive the MSD Weekly Market Update in .pdf format (includes FHLBNY rate charts) or to discuss this content further, please email the
MSD Team.
Special Member Alert
The FHLBNY recently announced a newly expanded and flexible Disaster Relief Funding (DRF) advance program which offers discounted rate advances with maturities 1-mo and greater. Additionally, we have announced that PPP loans will be accepted as eligible collateral. Please contact us with any questions.