Member Services Desk
Weekly Market Update
Economist Views
Click to expand the below image.
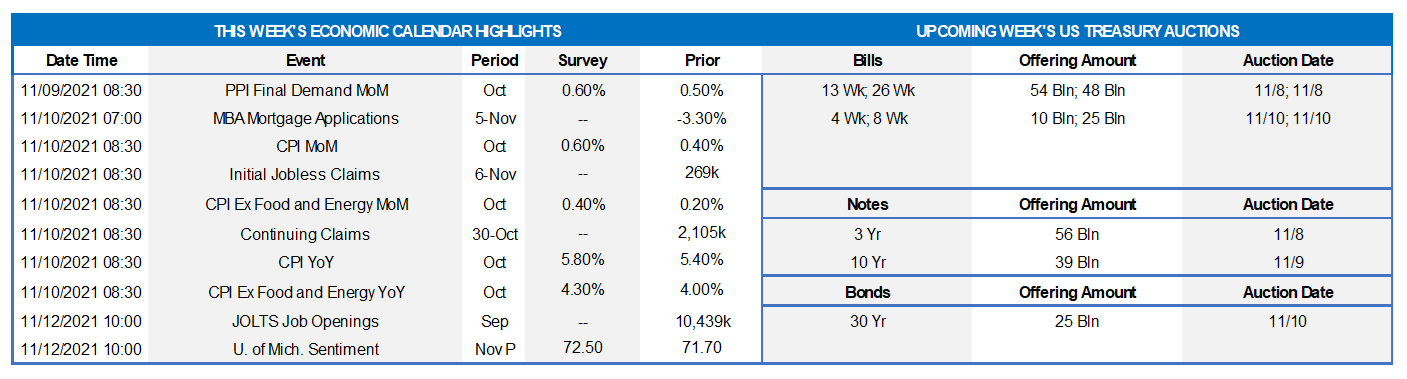
With the FOMC’s tapering announcement and the October employment report in the rear-view mirror, the focus of market participants likely will turn to the potential impacts on growth of the Biden Administration’s $1.85trn budget bill and $1.2bn bipartisan infrastructure deal. The median consensus projection anticipates a 4.8% annualized increase in real GDP growth during the final quarter of this year, while the latest tracking estimate from the Atlanta Fed calls for a far-steamier 8.5% gain. The Bureau of Labor Statistic’s update on consumer prices in October will be the marquee data report of the week, with pickups in both overall and core measures expected. Almost a dozen public appearances by Fed officials are slated for this week, with a variety of topics to be discussed.
NFIB Small Business Optimism Index: Upbeat labor-market soundings suggest that the National Federation of Independent Business’ sentiment barometer, to be released on Tuesday 11/9, likely rebounded last month, after a one-point decline to 99.1 in September.
Producer Price Index: Producer prices, to be released Tuesday 11/9, are expected to have risen by .6% in October, following a .5% prior-month gain. The echo of a similar increase 12 months earlier would leave the projected year-to-year growth rate unchanged at 8.6%.
Consumer Price Index: Consumer prices probably quickened in October, rising by an estimated .5% after September’s .4% gain. Excluding anticipated movements in volatile food and energy prices, the core CPI likely edged .4% higher during the reference period – the largest increase since June. Available data suggest that a sharp pickup in used vehicle costs may have been responsible for a portion of the anticipated acceleration. Those forecasts, if realized, would place the overall and core CPIs 5.8% and 4.3% above their respective year-ago levels, well above the Fed’s 2% target.
Jobless Claims: Initial and continuing claims under regular state unemployment insurance programs probably moved lower over their latest respective reporting periods. The termination of pandemic-related jobless benefits suggests that the total number of persons receiving assistance will also decline further during the week ended October 23 from the 2.67mn, or 1.7% of the civilian labor force, recorded in the prior week.
JOLTS Job Openings: A reported bounce-back in online help-wanted postings suggests that total job openings expanded by 320K to 1.076mn in September. That projection, if realized, would widen the gap between available positions and the jobless two months ago to an all-time high of 3.08mn.
Michigan Sentiment Index: Rosier appraisals of current and prospective conditions likely propelled this consumer confidence gauge to 75 in early November – the highest reading since the 81.2 posted in July.
Federal Reserve:
- Nov. 8 Fed Vice Chair Clarida to discuss average inflation targeting and monetary policy at a Brookings Institution event
- Nov. 8 Fed Chair Powell to make opening remarks at conference on gender influences on economic/financial outcomes.
- Nov. 8 Philadelphia Fed President Harker to speak to the Economic Club of New York.
- Nov. 8 Fed Governor Michelle Bowman to discuss housing market at a Women in Housing and Finance luncheon.
- Nov. 8 Chicago Fed President Evans to discuss the economy and monetary policy at an automotive supplier conference.
- Nov. 9 San Francisco Fed President Daly to take part in virtual discussion hosted by National Assn for Business Economics.
Click to expand the below images.
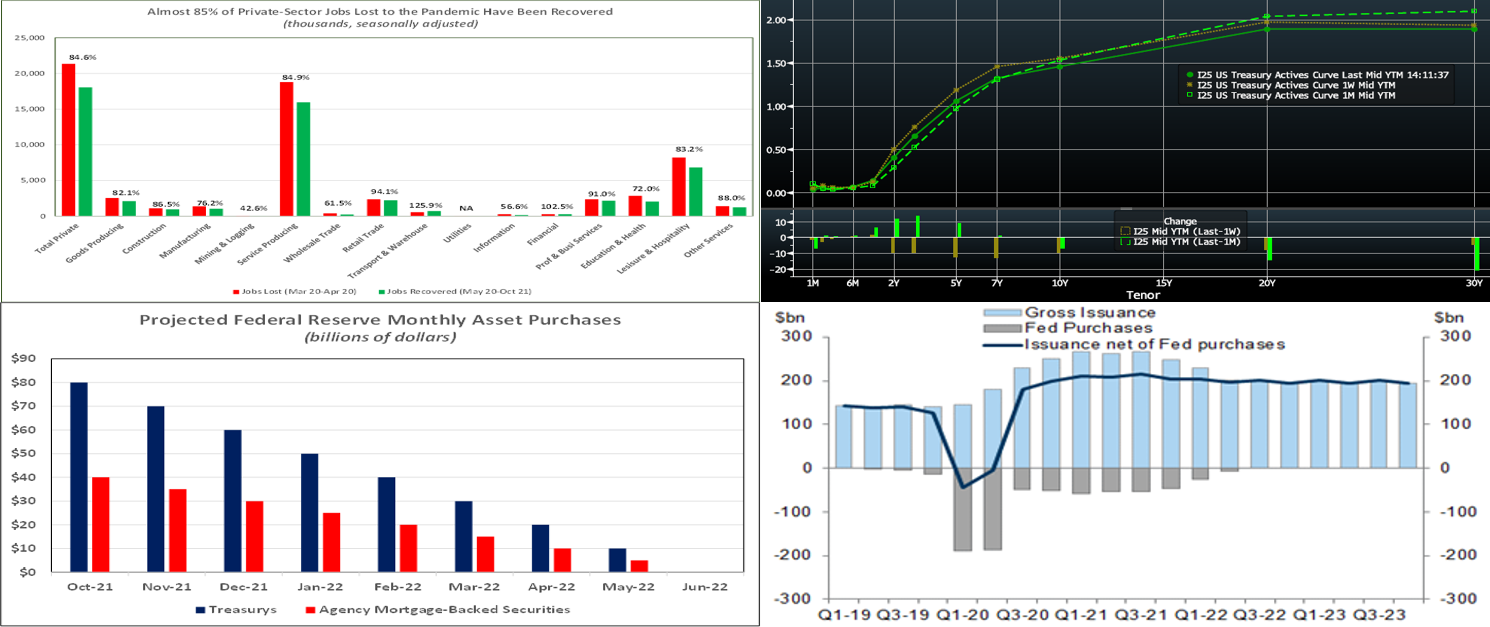
CHART 1 UPPER LEFT
Source: Bureau of Labor Statistics, FHLB-NY. The Employment Situation Report for October was solid. Not only did hiring outpace consensus expectations, but also previously reported counts for both August and September were marked significantly higher. Almost 85% of the jobs lost to the pandemic have been recovered, and further gains are likely in store as the pace of business activity reaccelerates. The household survey revealed that joblessness last month was already below the 4.8% Q4 average expected by Fed policymakers. Last month’s upbeat report supports the Federal Open Market Committee’s (FOMC) decision to begin the tapering of asset purchases later this month. With the economy projected to reaccelerate sharply over the final three months of the year, market expectations for the first hike in the federal funds target range may be brought forward over the next two months.
CHART 2 UPPER RIGHT
Source: Bloomberg. Note: Top pane is yield (%), bottom pane is change (bps). As of midday Friday, the UST curve was lower and flatter week-over-week. While very short maturities were modestly changed, it was a different story for 2-year and beyond. The 2 to 3-year fell ~10 bps, 4 to 7-year declined ~12 bps, 10-year dipped ~10 bps, and the longer end yields also followed suit to a lesser degree. A few factors contributed to the moves. The FOMC meeting was relatively uneventful, and, despite announcing the taper, Fed Chair Powell reiterated the themes of Fed patience and transitory inflation forces driven by the pandemic. On Thursday morning, meanwhile, the Bank of England surprised the markets with, rather than a hike, no change to official rates. This action sparked significant declines in UK yields and, in sympathy, yields in other global markets (recall our chart from last week on the recent interconnectedness of global yield moves). In essence, the market reduced the degree/pace of Fed tightening that had been built into the curve a week ago.
CHART 3 LOWER LEFT
Source: Federal Reserve; FHLB-NY. As widely expected at its past week’s meeting, the FOMC decided to maintain the federal funds rate target range unaltered at 0 to .25% and to begin tapering the pace of asset purchases this month. In contrast to the 2014 taper-announcement episode, the Fed essentially prepared the market beforehand and set out a provisional schedule for cutbacks in UST and Agency MBS purchases – $10bn per month for the former and $5bn per month for the latter – assuming no material changes to the economic outlook. Therefore, assuming no significant economic hiccups, monthly securities purchases would terminate next May. Beyond that point, as was the case in 2014, the Fed likely will continue to roll over maturing USTs at auctions and reinvest principal payments from its holdings of Agency debt and MBS into agency MBS.
CHART 4 LOWER RIGHT
Source: Goldman Sachs Research. The Fed’s taper, in essence, is a gradual removal of accommodation from the markets. Note that the Fed will still be “net-adding” assets to its portfolio until the spring of 2022. Also, as seen here, the absence of Fed buying is expected to be notably offset by an anticipated reduction in UST supply to the market, as budget deficits are forecast to be a bit lower; indeed, Treasury this past week announced reductions in sizes of all UST auctions. Therefore, from a strictly supply/demand standpoint and in isolation, the taper’s impact itself could be mild; however, the taper announcement clearly signals that the removal of accommodation has commenced and that rate hikes will follow, assuming no economic roadblocks.
FHLBNY Advance Rates Observations
Front-End Rates
Short-end Advance rates finished unchanged on the week. The debt ceiling issue has essentially been pushed off to December, but this issue, and the T-bill curve kinks it has caused, have not materially impacted our rates. Demand for short paper and the Fed’s RRP, which hit a record $1.6trn a month ago and stands last ~$1.35trn, remains strong. The Fed acknowledged this dynamic at the last FOMC, as they raised the RRP counterparty limit to $160bn from $80bn. The overall supply/demand paradigm persists in suppressing rate levels, as the GSEs continue to invest large sums into money markets, the TGA has declined, Fed purchases instill funds to the banking system, and short-maturity paper is in low supply.
UST issuance overall is now net positive supply in that more is being issued than what the Fed is buying in its programs. However, with short UST rates at rock-bottom levels and the Fed on hold, rates are likely to persist in a near-term sideways pattern. Importantly, weekly net T-bill issuance has been lower and often negative since 2020, and Treasury intends to shift issuance out the curve. T-bills are experiencing a near-term issuance uptick on some “catch-up” issuance from the debt ceiling issue slowdown, but this uptick should not alter the overall money markets picture. Further legislative packages and related borrowing may lead to an eventual increase of T-bill auction sizes and positive net supply, but for now overall market supply/demand dynamics should keep short rates in check from large moves to the upside.
Term Rates
The Advance rate curve was mostly lower midday week-over-week. The 1-year was ~4 bps higher; note that this maturity point now encompasses the potential “Fed-tightening time zone”, and so it has and could creep higher as time ensues. The 2-year and further points, meanwhile, declined ~10 to 12 bps. Owing to intraday/volatile moves the past two Fridays and timing differences, our charts above may differ somewhat from these declines. Kindly refer to the previous section for further color on relevant market dynamics.
On the UST supply front, this week, starting Monday, brings 3/10/30-year auctions. These auctions may present an obstacle to further yield declines this week. The market will closely monitor this week’s legislative developments and economic data, particularly CPI. Note that Thursday is a market holiday for Veteran’s Day.
New Product Alert: FHLBNY is pleased to announce the launch of the Business Development Advance (BDA) on Thursday, November 4, 2021. The BDA is a 0% advance to help our members provide funding to qualifying small businesses to promote community & economic growth. The BDA is subsidized funding in the form of interest-rate credits. There is a total of $3 million of interest-rate credits available in 2021. Members can request to reserve their interest-rate credits up to $50,000 on a first-come/first-served basis. For further details, please view our BDA overview page and watch this past Thursday’s BDA webinar, and/or contact the Member Service Desk at 1-800-546-5101 option 1.
The Symmetrical Prepayment Advance Feature
With rates at or near multi-year lows, it is a compelling juncture to use the SPA feature on term advances. This feature allows member to capture, at prepayment, changes in the Fair Value of the advance which are favorable to the member. Contact us to discuss.
Looking for more information on the above topics? We’d love to speak with you!
Questions?
If you wish to receive the MSD Weekly Market Update in .pdf format (includes FHLBNY rate charts) or to discuss this content further, please email the MSD Team.