Member Services Desk
Weekly Market Update
Economist Views
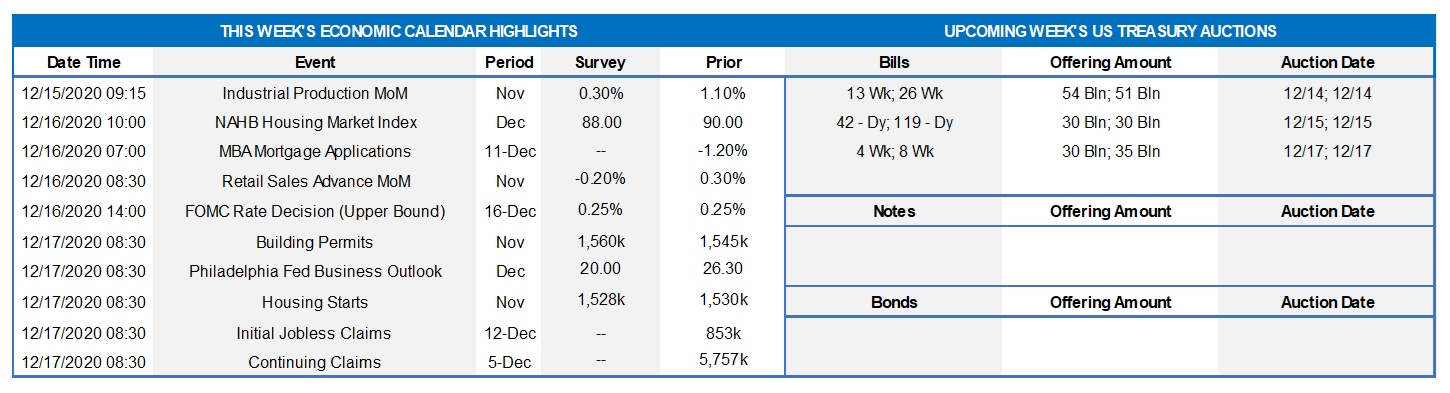
Next week’s post-meeting statement will be accompanied by an updated Summary of Economic Projections. Recent data point to significant positive adjustments from those of September. The median consensus forecast of a 4% annualized increase in Q4, for example, would place the level of real GDP at a better-than-expected 2.5% below that of autumn 2019. Moreover, with November’s unemployment rate clocking in at 6.7%, a sizable downward adjustment to the 7.6% level previously anticipated by Federal Reserve officials in Q4 is undoubtedly in the offing. Overall and core PCE inflation estimates for year-end 2020 probably will remain intact.
Industrial Production & Capacity Utilization: Powered by a modest uptick in manufacturing output, industrial production probably edged 0.3% higher in November, following a 1.1% jump in the previous month. The anticipated output gain, if realized, would propel the overall operating rate to an eight-month high 73.0%.
Retail & Food Services Sales: Reflecting an already reported pullback in motor vehicle purchases, retail sales likely dipped by 0.2% last month, erasing two thirds of October’s gain. Retail control – the portion of the Census Bureau’s report that excludes outlays on autos, building materials, and gasoline used to estimate nominal consumer spending in GDP – probably climbed by 0.3%, after a 0.1% prior-month uptick. Sales at non-store retailers, which jumped by 3.1% in October, could give early clues to how this year’s holiday shopping season is shaping up.
NAHB Housing Market Index: The ongoing uptrend in home-purchase mortgage applications implies that builder sentiment probably remained near last month’s record high in December.
Housing Starts & Building Permits: Unusually warm and dry weather conditions, along with an already reported rise in construction hours worked, suggest that groundbreakings and building applications both moved higher in November.
Initial Jobless Claims: Given the surprising jumps in initial and continuing jobless claims posted last week, the upcoming release will be watched closely to gauge any deceleration in labor-market improvements beyond the November employment report.
Federal Reserve Appearances:
Dec. 16: 2:00pm FOMC meeting statement and Fed’s Summary of Economic Projections to be released.
Dec. 16:2:30pm Fed Chair Powell to hold post-FOMC meeting press conference.
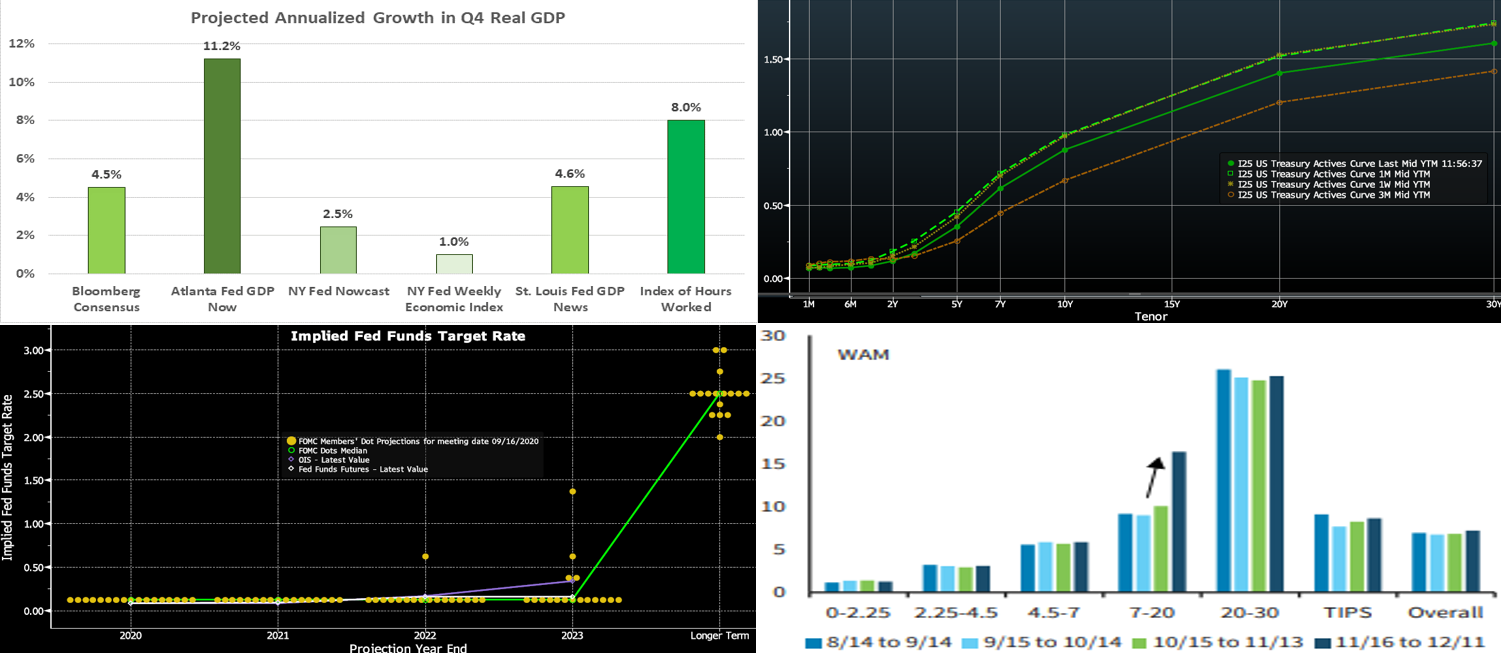
Source: BLS; FRB Atlanta/NY/St. Louis; FHLB-NY. While the pace of business activity is expected to slow during the current quarter from the summer’s breakneck 33.1% annualized pace, the range of projections is exceptionally wide. The median 4.5% annualized increase during the current quarter anticipated by the Bloomberg consensus would leave year-end real GDP at 2.4% below its Q4 2019 level, thereby implying that the lost output from the pandemic likely will not be recouped until the middle of 2021. The alarming increase in Coronavirus infections experienced recently nationwide suggests that the risks lie to the downside on near-term growth, but any shortfall probably will be recovered quickly once vaccines become widely available and taken by the populace.
CHART 2 – UPPER RIGHT
Source: Bloomberg. In the past week, the UST curve swung back and “bull flattened” from its levels of a week ago. The Fed’s guidance and programs have served to pin the shorter maturities, and so again it was maturities 4-year and longer leading the shifts. But short maturities also declined a few bps this week. Overall, however, the curve remains steeper and higher than three months ago. This week’s move, despite the long-end UST auctions during the week, resulted from talks on a fresh relief package faltering in combination with a dramatically worsening Covid-19 situation and worsening job market data. Moreover, there is a chance that this week’s FOMC announces its intention to extend the duration of its UST securities purchases, and this dynamic has kept steepening in check. Helping the curve remain in a near-term “tug of war” between steepening/flattening is that a relief package (and a potentially bigger one if the Senate flips its majority) will bring increased UST supply in the longer end of the curve, in addition to the economy being afforded, in a more medium-term horizon, significant support when the COVID vaccination process successfully and hopefully plays out.
CHART 3 – LOWER LEFT
Source: Bloomberg. Given the upcoming FOMC meeting, let us revisit the Fed “Dot Plot” and short-rate curves. It is doubtful much will change post-meeting. While the Fed’s Dot projections “flat-line” until the end of 2023, the markets, per the OIS curve, price for a mildly increasing chance of a hike during 2023. With the ongoing uncertainty of the pandemic and economic recovery, the Fed will likely reinforce its accommodative guidance.
CHART 4 – LOWER RIGHT
Source: FHLBNY; Barclays. Portrayed here is the weighted average maturity distribution ($bn y-axis, years x-axis) of the Fed’s UST purchases. The Fed has recently edged higher both the WAM and duration on purchases. The markets will closely monitor any official nod towards more concerted maturity extensions; it is expected that the 7 to 20-year sector would witness more of the Fed’s buying.
FHLBNY Advance Rates Observations
Front-End Rates
Short-end Advance rates were flat to a bp lower week-on-week. T-bill issuance has been a market feature, as usual, but net supply has slowed and thereby allowed for easier market absorption. Assisting the slight dip in rates was a ~$23bn increase in money market funds’ AUM this past week, led by a sizable ~$25bn inflow to Government-Only funds. From a bigger-picture vantage point, an overall moderation in market supply of short paper in recent months has kept short-end rates relatively steady; see last week’s edition for pertinent color on this topic.
Heavy T-Bill issuance will remain a theme; UST issuance overall is now net positive supply in that more is being issued than what the Fed is buying in its programs, and so this scenario could prove a small challenge. However, with short UST rates at rock-bottom levels, and the Fed likely on hold for a long period, rates may trade in a sideways to slightly lower pattern. Net T-bill issuance has been lower since mid-summer and even negative in recent weeks, and Treasury has announced plans to shift issuance out the curve, but a new fiscal relief package could complicate/alter this forecast. Even with a new relief package and related borrowing, these supply/demand and Treasury issuance dynamics should keep short rates in check on the upside.
Term Rates
Week-on-week, medium and longer-term Advance rates “bull flattened” by 3 to 10 bps in progressive fashion from 2 to 10-year. Rates 3-year and shorter generally remain pinned in a narrow range, and so again it was the portion of the curve thereafter that led the moves. Please refer to the previous section for further color on the market trend.
Rates still trade at historically low levels across the yield curve, and the curve is priced for the Fed to be on hold for several years. If suitable or sensible from an ALM perspective, it may be worthwhile to consider extending liabilities and locking in term rates. If not in need of funding now but anticipating future needs, a Forward Start Advance can be an appropriate solution, especially given the still relatively flat yield curve. Please call the Member Services Desk to discuss rate levels and potential ideas.
On the UST supply front, this week is barren in term space. Corporate issuance should add yet again to its historic record annual pace albeit notably slower as the holidays approach. Attention will remain on the prospect of further relief legislation and certainly also on COVID-19 developments.
The Symmetrical Prepayment Advance Feature
With rates at or near multi-year lows, it is a compelling juncture to use the SPA feature on term advances. This feature allows member to capture, at prepayment, changes in the Fair Value of the advance which are favorable to the member. Contact us to discuss.
Looking for more information on the above topics? We’d love to speak with you!
Questions?
If you wish to receive the MSD Weekly Market Update in .pdf format (includes FHLBNY rate charts) or to discuss this content further, please email the
MSD Team.
Special Member Alert
The FHLBNY recently announced a newly expanded and flexible Disaster Relief Funding (DRF) advance program which offers discounted rate advances with maturities 1-mo and greater. Additionally, we have announced that PPP loans will be accepted as eligible collateral. Please contact us with any questions.