Member Services Desk
Weekly Market Update
This MSD Weekly Market Update reflects information for the week ending December 1, 2023.
Economist Views
Click to expand the below image.
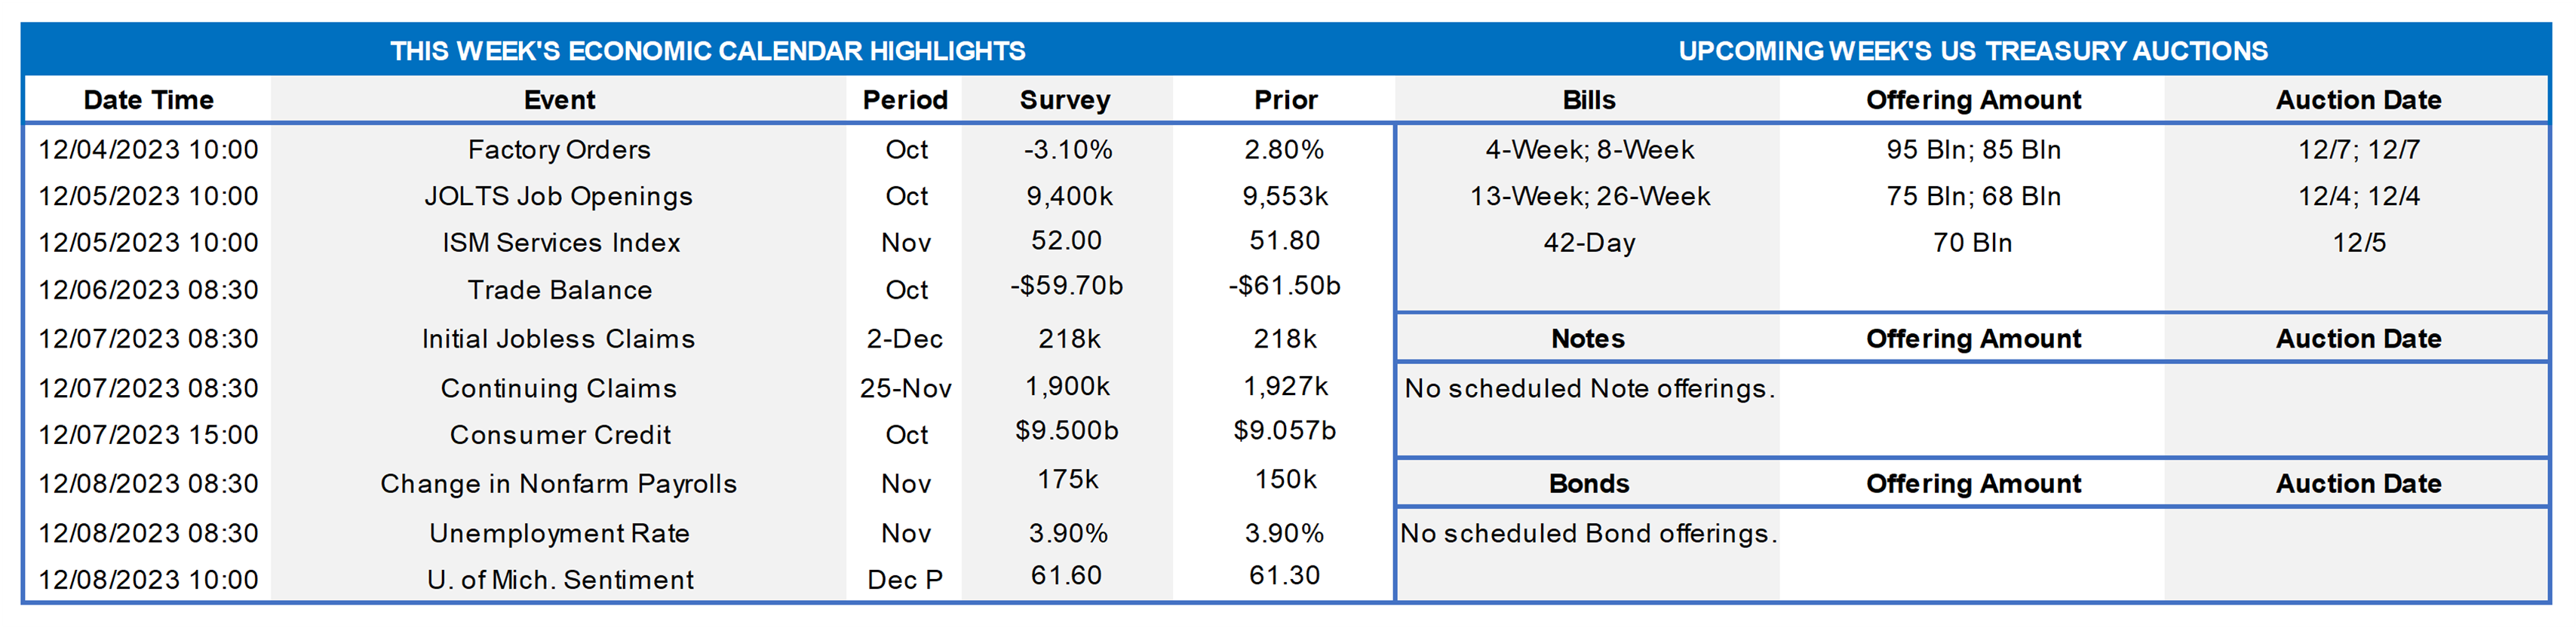
With policymakers observing the traditional blackout period on public appearances ahead of the December 11-12 Federal Open Market Committee meeting, the market’s focus will fall squarely on the economic data calendar. The Bureau of Labor Statistics’ update on the employment situation in November will be the marquee release. Buoyed by the returns of striking workers, nonfarm payrolls probably expanded by 230K last month, after the below-consensus 150K rise posted in October. The unemployment rate during the reference period is a much trickier call. The steady rise in continuing jobless claims since the October canvassing period would argue for a move above the 4% mark, but the difficulty of estimating monthly changes in the civilian labor force gives one pause. An extended five-week interval between establishment survey periods may result in a reported pickup in average hourly earnings growth in November. Yet even a doubling to .4% would leave the year-to-year gain in the closely followed nominal compensation measure unchanged at 4.1%.
Factory Orders: Triggered by an aircraft-led drop in durable goods bookings, manufacturers’ new orders probably declined by 2.7% in October, completely erasing a revised 2.5% gain in September.
JOLTS Job Openings: A reported decline in online help-wanted postings suggests that nationwide job openings contracted by 265K to 9.29mn in October, completely easing the 56K increase recorded in the prior month. At an estimated 2.78mn, the excess of vacant positions nationwide would represent a two-year low 1.4 jobs per unemployed person.
ISM Services Activity Index: Activity probably expanded for an eleventh straight month in October, with the ISM’s gauge likely rebounding to 53.5% from the 51.8% reading posted in October.
International Trade Balance: An export-led deterioration of the merchandise trade deficit probably widened the shortfall on trade in goods and services to a three-month high of $63.5 bn in October from $61.5 billion in September.
Consumer Credit: Consumer installment credit probably expanded by $11.5bn in October, following a $9.1bn prior-month takedown.
Michigan Sentiment Index: Consumers’ appraisals of current and prospective economic conditions likely improved in the first week of December, lifting the University of Michigan’s confidence gauge to a three-month high of 64.
Federal Reserve Appearances: None. Federal Reserve officials will observe the blackout period on appearances ahead of the Dec. 12-13 FOMC meeting.
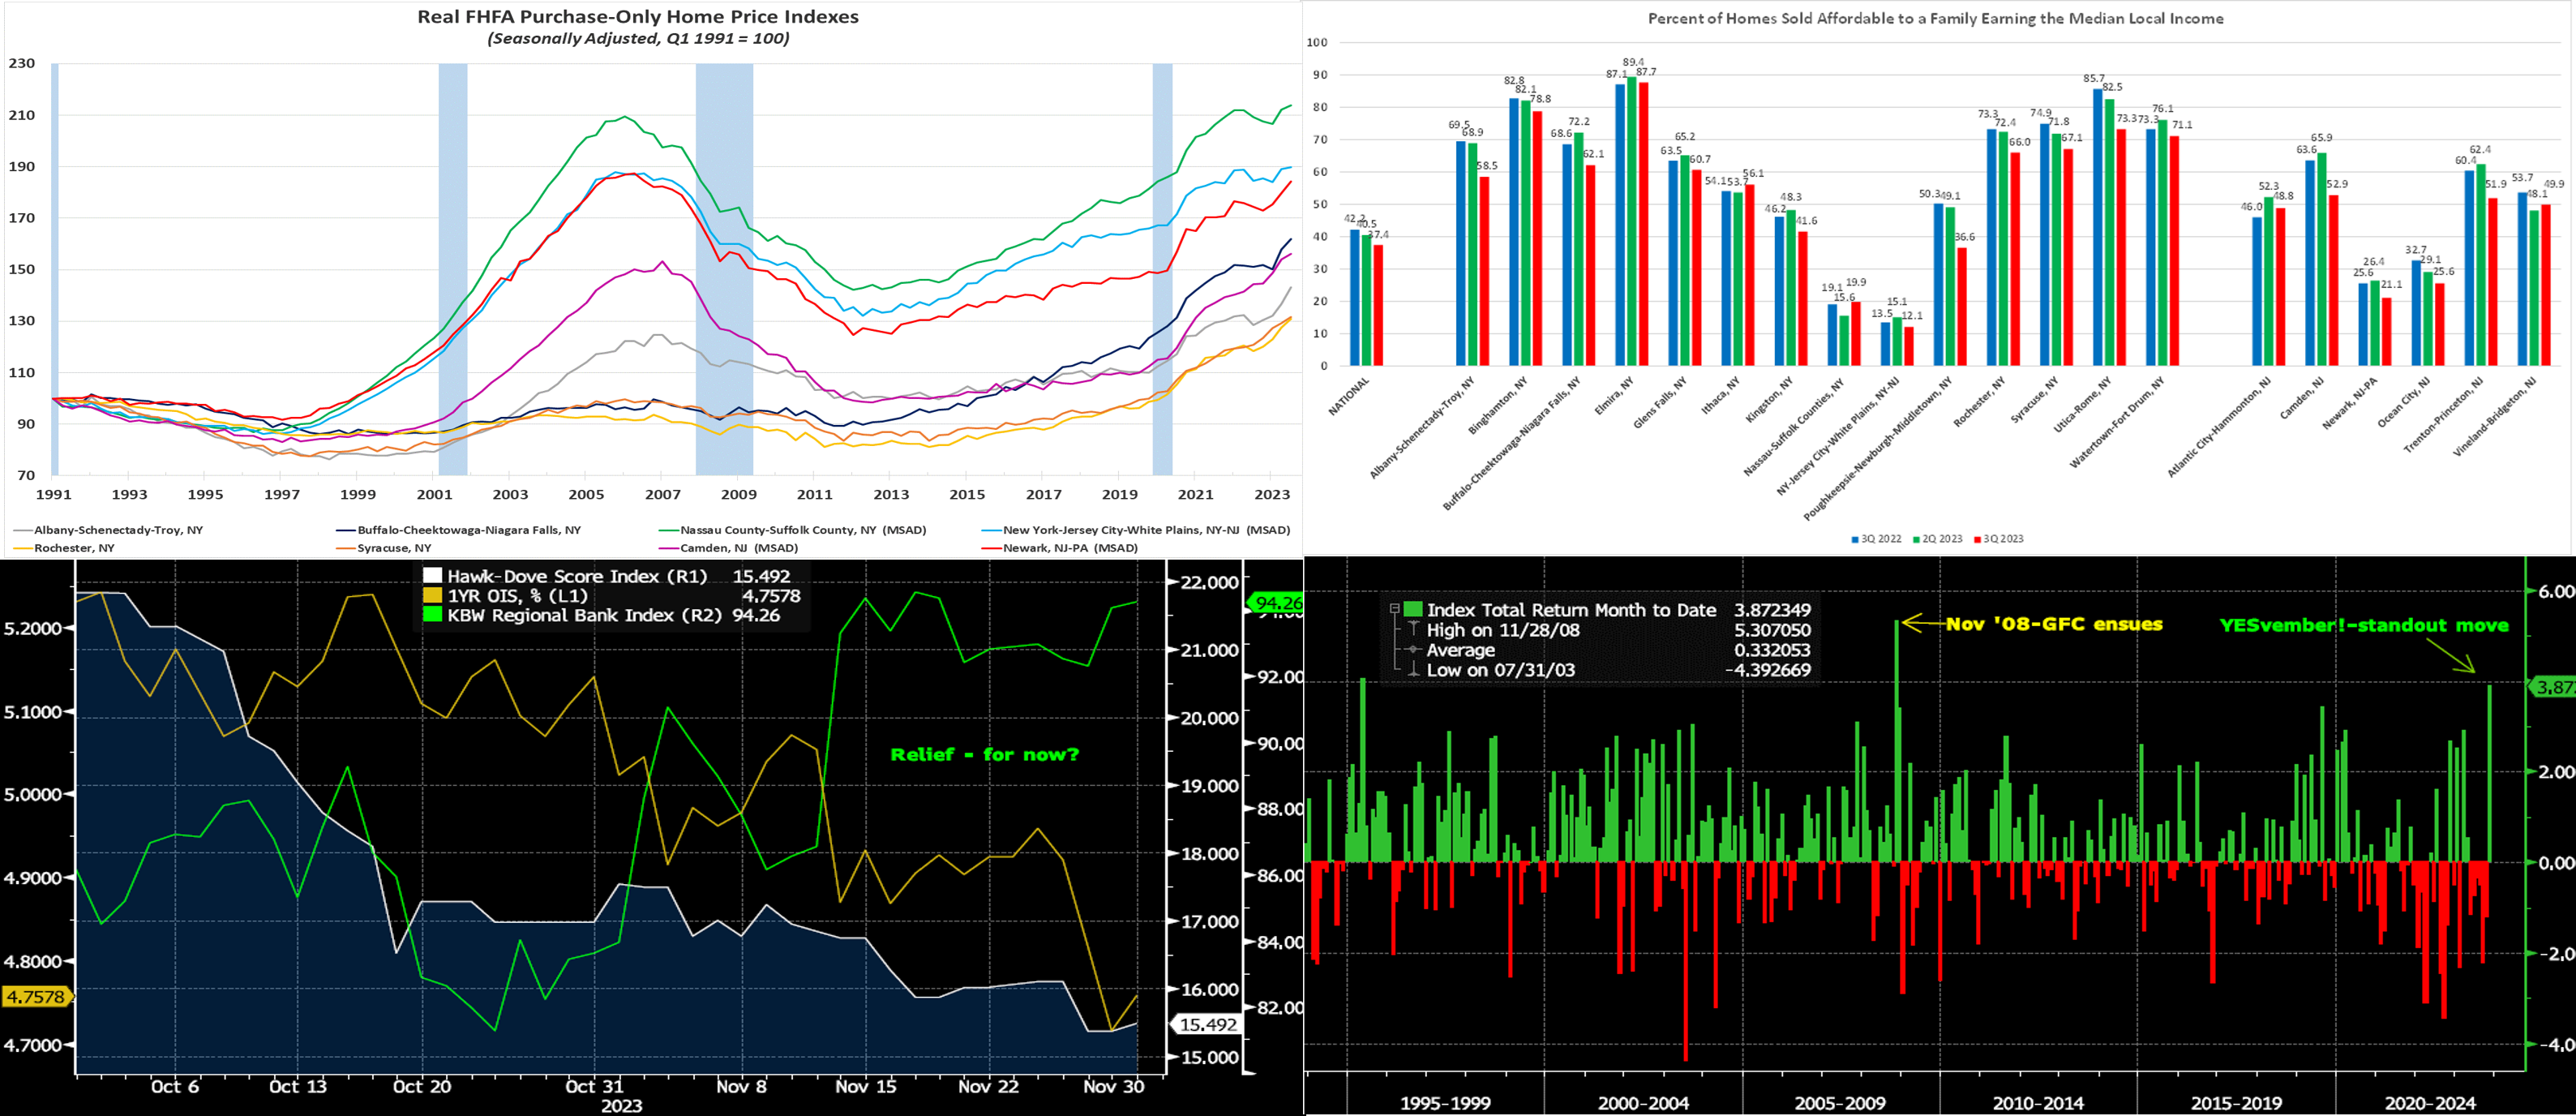
CHART 1 UPPER LEFT
Source: Bureau of Labor Statistics; FHFA; National Bureau of Economic Research; FHLB-NY. Note: Real home price indices are calculated by adjusting the FHFA nominal price gauge for changes in the applicable Consumer Price Index (CPI) excluding shelter costs. The performance of real home prices has varied widely across the FHLB-NY coverage area. While all available metropolitan areas witnessed gains over the course of Q3, increases above the rise in the relevant CPI excluding shelter ranged from 4.7% in the Albany-Schenectady-Troy, NY area to just .4% across the NY-Jersey City-White Plains, NY-NJ metro statistical area (MSA). Over the latest four quarters, sections of upstate New York have enjoyed inflation-adjusted home-price gains averaging 9.6%, well above the 2.6% recorded by MSAs closer to New York City. Real home-price increases in NJ since the summer of 2022 have also been impressive, with Camden posting an 8.3% advance and the Newark, NJ-PA MSA gauge rising by 5.7%.
CHART 2 UPPER RIGHT
Source: Bloomberg. Top pane is yield (LHS, %), bottom pane is change (LHS, bps). From two Thursday afternoons ago to this one, the UST curve moved lower by ~7 to 10 bps, led by the 2 to 5-year sector. But, as can be seen here, the move on the month has been significant. Helping the move has been more moderate Fedspeak and softer economic data. Basically, “higher for longer” has become “higher for not as long”. For instance, this past week Fed Governor Waller, generally considered a hawk, helped bolster rate-cut bets when he declared that the current level of policy looks well positioned to slow the economy and bring down inflation. In terms of market-implied pricing of the Fed, the chance of another hike has been almost fully priced out. Meanwhile, deeper cuts have been priced into the curve for mid-2024, with over 100% probability of a 25 bps cut in May. The year-end 2024 forward is ~15 bps lower from two weeks ago, now ~4.20%.
CHART 3 LOWER LEFT
Source: Bloomberg. Shown here is a snapshot of the past two months and the notable moves of November. Per the decline in the JP Morgan Hawk-Dove Score Index (RHS-1, White), Fedspeak has moderated from previously more hawkish levels. Indeed, this observation was evidenced in the past week, per the color above. In turn, owing to softer Fedspeak and some decelerating inflation data, the market has more aggressively priced in rate cuts over the next 18 months, as seen here in the nearly 50 bps drop of the 18-month Overnight Index Swap (LHS, Gold, %, proxy for average Fed Funds Effective over period). Meanwhile, these developments have brought welcome relief to equity markets and the bank sector, as the KBW Regional Bank Index (RHS-2, Green) has risen ~14% in November! Has the market has gotten ahead of itself? Upcoming data will be of paramount importance to direction from here.
CHART 4 LOWER RIGHT
Source: Bloomberg. Further illuminating the marked moves of November, here is a historical view of the Bloomberg UST Total Return Month to Date Index (RHS, %, data through 11/29). Excluding the November 2008 Great Financial Crisis period, this month has posted the best monthly performance in decades! This standout performance has also been the case for fixed income in general, such as for corporate and global sovereign bonds. Note that month-end profit-taking and a reversal kicked in as of this writing, and so the performance will thereby be dimmed relative to that seen in the chart.
FHLBNY Advance Rates Observations
Front-End Rates
- Short-end rates were mostly lower by 1 to 3 bps week-over-week. Helping the decline was improved issuance levels and the market again pricing Fed expectations lower. Net T-bill supply remains positive, given announcements from Treasury regarding upsized auctions and issuance needs. But the supply continues to be absorbed relatively well, as Money Market Funds (MMFs) switch from the Fed’s RRP to T-bills with competitive yields. Moreover, MMFs currently stand at all-time high AUM levels.
- With the Fed in blackout mode before the December 13th FOMC, the jobs report will likely be the main event this upcoming week.
Term Rates
- The longer-term curve, generally mirroring the moves in USTs and swaps, moved 8 to 11 bps lower from two weeks ago, led by the 5-year-and-shorter zone.
- On the UST term supply front, the upcoming week serves a reprieve from auctions. Note that UST auctions usually occur at 1pm and can occasionally cause volatility around that time. Please contact the Member Services Desk for further information on market dynamics, rate levels, or products.
Grant funding under the FHLBNY 2023 Small Business Recovery Grant (SBRG) Program has begun and some funds are still available. The SBRG Program provides grant funds to benefit FHLB-NY members’ small business and non-profit customers. Please visit the SBRG webpage.
Price Incentives for Advances Executed Before Noon: In effect as of Tuesday, September 5, 2023, the FHLBNY is pleased to now offer price incentives for advances executed before Noon each business day. These pricing incentives offer an opportunity to provide economic value to our members, while improving cash and liquidity management for the FHLBNY. For further details, kindly refer to the Bulletin.
The Symmetrical Prepayment Advance Feature
For those anticipating term funding needs, and with rates on an uptrend, it can be an appropriate juncture to consider our SPA feature. This feature allows the member to capture, at prepayment, changes in the fair value of the advance which are favorable to the member. Contact Member Services Desk to discuss.
Looking for more information on the above topics? We’d love to speak with you!
Questions?
If you wish to receive the MSD Weekly Market Update in .pdf format (includes FHLBNY rate charts) or to discuss this content further, please email the MSD Team.