Member Services Desk
Weekly Market Update
This MSD Weekly Market Update reflects information for the week of April 25, 2022.
Economist Views
Click to expand the below image.
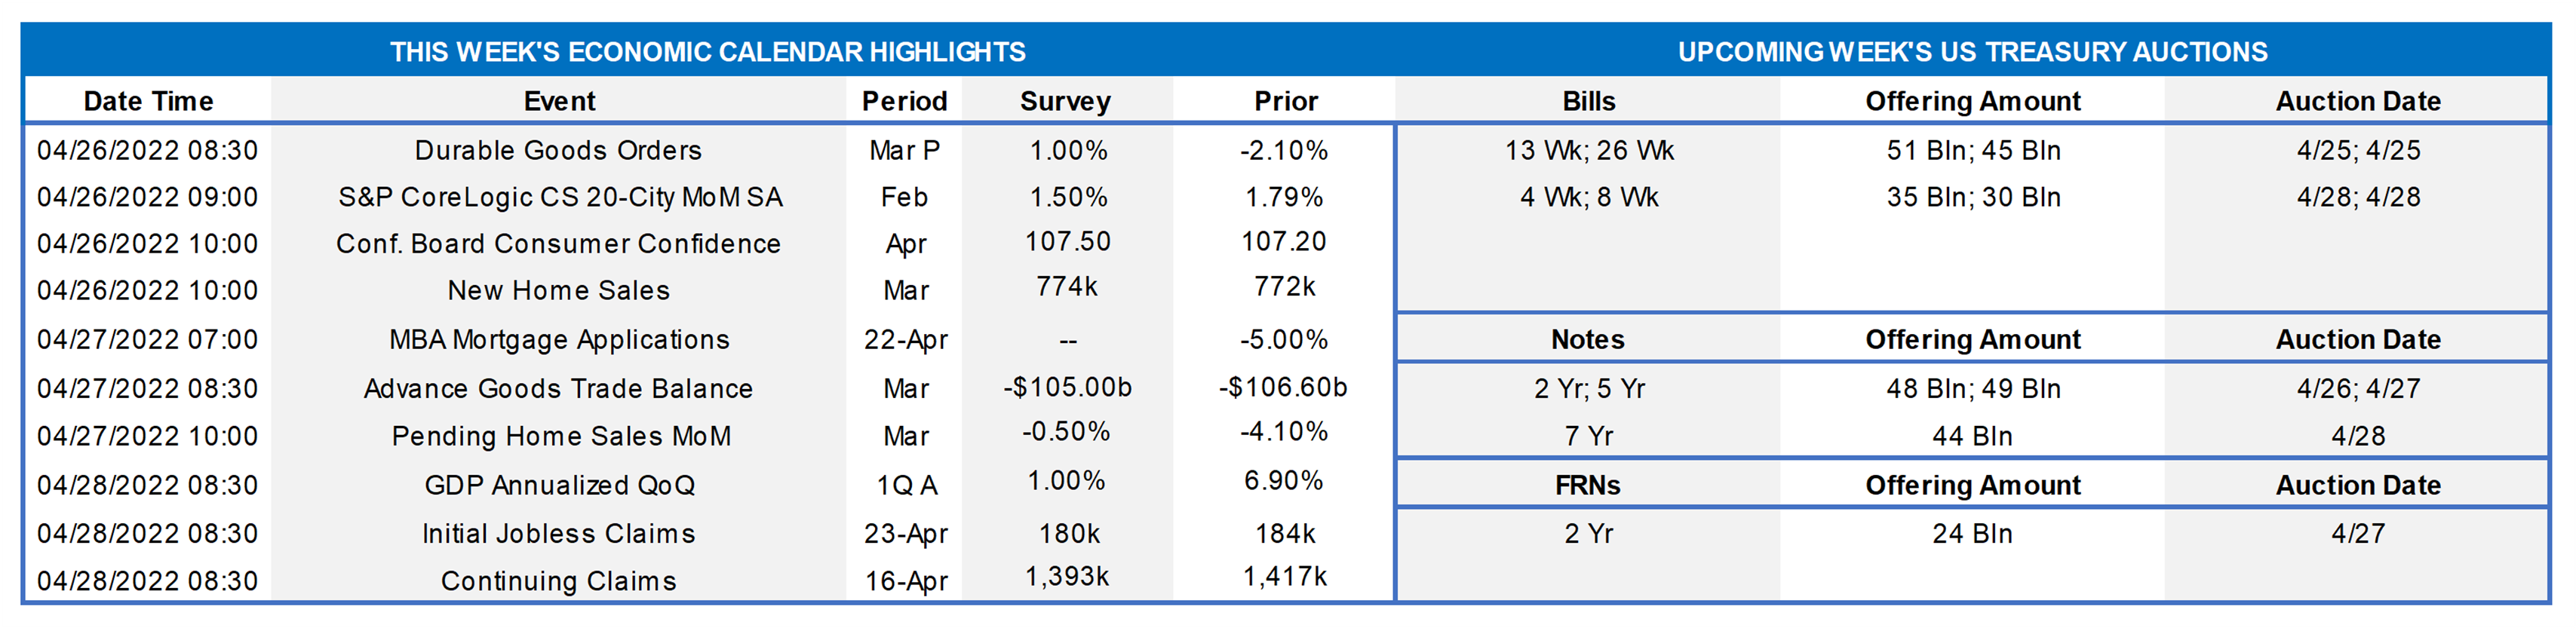
With Federal Reserve officials observing the traditional blackout period ahead of the FOMC meeting on May 3-4, the attention of market participants will squarely be on the economic release calendar. Topping the list will be the Bureau of Economic Analysis’ first report on Q1 real GDP growth. The median Street projection calls for a comparatively modest 1.0% annualized advance, after the 6.9% winter-quarter gain, but most of the pullback likely will be attributable to inventory liquidations by private business inventories and not to a deterioration in underlying demand. Indeed, real final sales and those to domestic purchasers probably quickened over the first three months of the year. Traders and investors will also keep a close eye on the continuing Russia/Ukraine conflict.
Durable Goods Orders: A broad-based rebound in hard goods bookings probably propelled durable goods orders 1% higher in March, reversing almost half of February’s 2.1% slide. Excluding a commercial jetliner-led rebound in transportation equipment requisitions, durable goods bookings are expected to have moved .5% higher, erasing all but a fraction of the .6% decline recorded in the previous month. March’s nondefense capital goods shipments, excluding commercial jetliner deliveries, will prompt economists to take a final look at their projections for business equipment spending ahead of the Bureau of Economic Analysis’ advance report on Q1 real GDP.
S&P CoreLogic Case-Shiller 20-City Home Price Index: Home prices probably remained on uptrend across the twenty major metropolitan areas canvassed by SPCLCS in February. Indeed, the 1.5% jump projected by the Street, after a 1.8% hike in January, would place home selling prices 19.2% above those received by sellers in February 2021.
Conference Board Consumer Confidence: Available soundings suggest that consumer sentiment improved markedly in April, lifting the Conference Board’s confidence gauge to a nine-month high of 118 from 107.2 in the previous month. As always, keep an eye on the so-called labor differential – the percentage of survey respondents feeling that jobs are plentiful less than those believing they are hard to get – for clues to the likely change in the civilian jobless rate in the upcoming Bureau of Labor Statistics report.
New Home Sales: Reported declines in single-family housing starts and building permits suggest that contracts to purchase a newly constructed dwelling slipped to a five-month low seasonally adjusted rate of 750K in March from 772K in February.
Pending Home Sales: Home-purchase contract signings are expected to have held steady in March, following a sharp 14.3% falloff over the November-February span.
Real GDP Growth: Real GDP growth is expected to have slowed to an annualized clip of just 1% during the winter quarter, following a 6.9% increase over the final three months of 2021. However, that deceleration likely was attributable to a dramatic adverse swing in private inventory building during the reference period. Indeed, real final sales to domestic purchasers – GDP less than the change in business inventories plus the international trade deficit – probably quickened to 3.6% annualized from 1.7% annualized in Q4 – the fastest clip since the spring of 2021.
Jobless Claims: With demand for workers increasing as the spring progresses, initial and continuing state unemployment insurance claims likely moved lower in their respective reporting periods.
Federal Reserve Appearances: None – Federal Reserve officials will observe the traditional blackout period ahead of the May 3-4 FOMC meeting.
Click to expand the below image.
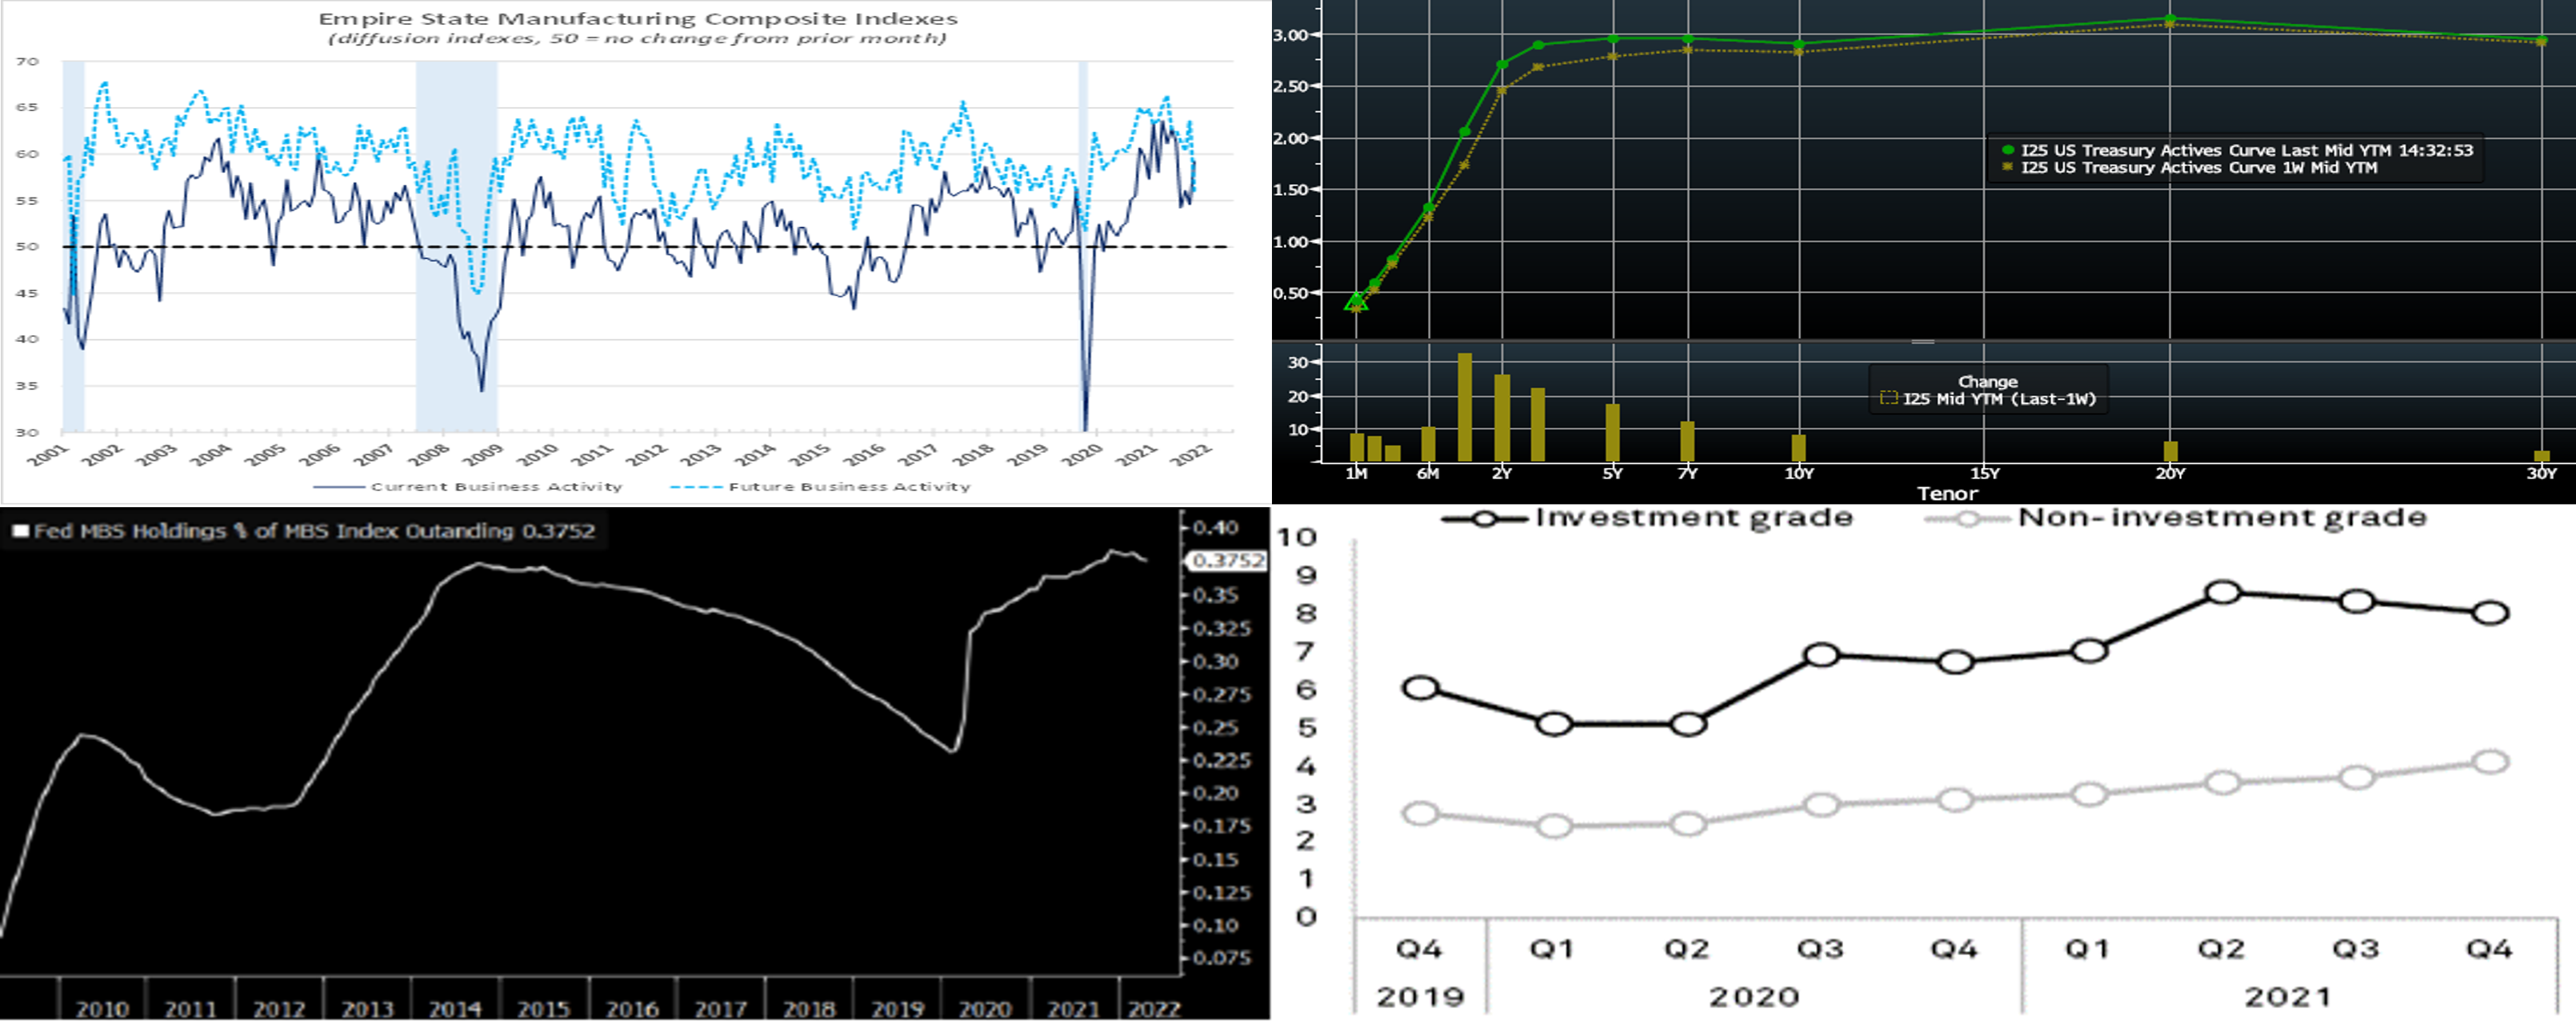
CHART 1 UPPER LEFT
Source: FRB-NY; NBER; FHLBNY. Note: Shaded areas denote recessions. Recent reports suggest that economic growth is gathering steam across much of the FHLB-NY coverage area, as the spring quarter commences. Applying the Institute for Supply Management’s methodology to data from the Empire State Manufacturing Survey, our preferred composite gauge which incorporates readings on business activity, new orders, vendor deliveries, inventories, and employment climbed by 4.7 percentage points to 59.2% (solid blue line in chart) in April – the strongest reading since December. In a separate report, the NY Fed’s recent Business Leaders Survey of service-producing firms in NY, northern NJ, and southwestern Connecticut also captured a marked pickup in business activity this month. However, on a cautionary note, with concern growing about supply disruptions, worker shortages, and the war in Ukraine, local businesses —especially those in manufacturing, distribution, and construction—have become less optimistic about the near-term outlook.
CHART 2 UPPER RIGHT
Source: Bloomberg. Note: Top pane is yield (%), bottom pane is change (bps). The UST yield curve aggressively bear flattened week-over-week. Yields in the 1 to 5-year sector finished ~17 to 32 bps higher, led by the shorter maturities, as the market priced for more aggressive Fed hikes later this year and 2023. Longer maturity yields rose to a lesser extent. Fed-speak again skewed “hawkish”. Fed Chair Powell declared that a 50 bps hike is “on the table” for the May 3-4 FOMC meeting. Fed Governor Daly, generally considered a “dove”, also cited the potential need for a 50 bps hike. Meanwhile, Fed Governor Bullard, considered a hawk, lobbed out the idea of a 75 bps hike. It appears that the Fed wishes to “get ahead”, or more like “catch up”, to market expectations and set the table for an imminent 50 bps hike. The market presently prices for just over a 100% chance of a 50 bps hike at both the May 4 and June 15th FOMC meeting; for the rest of 2022, it prices for ~250 bps (up from ~215 last week) of cumulative hikes from the current level. With the Fed in blackout mode before its May 3-4 meeting, market focus will be on economic data.
CHART 3 LOWER LEFT
Source: Bloomberg. Depicted here is the share of the Bloomberg MBS Index held by the Fed. It surpassed its prior peak of earlier quantitative easing periods and reached a fresh high in 2022, now sitting at ~37%. In $ terms, the Fed’s portfolio holds ~$2.7trn of Agency MBS, while the Index represents ~$7.3trn of outstanding securities. The Fed is expected to announce its plans/pace for portfolio runoff at the May 3-4 FOMC meeting. As mentioned in our recent editions, the dramatic rise in rates has spurred concern that the Fed will eventually need to outright sell MBS too, as natural runoff may slow as a result of lower prepayments. These dynamics have contributed to the rise in market yields and the dramatic widening of MBS spreads in recent months. At this stage, current metrics on MBS may appear especially attractive for held-to-maturity or available-for-sale portfolios that can avoid mark-to-market noise. As of Friday afternoon, the 30-year mortgage Current Coupon (computed yield of a par-priced MBS) was at a 10-year high of ~4.16%. Its spread to USTs was at a 5-year high, disregarding the March 2020 COVID period. The FNMA 4% coupon was trading at a discount $ price of ~99-10.
CHART 4 LOWER RIGHT
Source: S&P Global Market Intelligence. Shown here, by long-term rating levels, is the median interest coverage ratios for US non-financial companies. Interest coverage ratio is defined here as the ratio of earnings before interest and taxes to interest expense. While the recent rise in market rates can certainly present economic challenges, the current situation appears stable and better than the pre-pandemic period. Many companies took advantage to borrow at lower rates in the past few years, and revenues were bolstered by governmental pandemic relief programs and the relatively quick economic recovery from the early pandemic. In this light, corporate America and the economy appear better positioned to withstand further Fed rate hikes.
FHLBNY Advance Rates Observations
Front-End Rates
- Short-end Advance rates finished higher week-over-week by varying degrees. Whereas 1-month was up ~6 bps, the 6-month was higher by 15 bps. The market’s ongoing aggressive pricing of forthcoming Fed rate hikes have served to push advance rates higher. As of this past Friday afternoon, the market priced for a greater than 100% probability of 50 bps hikes at both the May 4 and June 15th FOMC meetings. This pricing and the fact that maturities are crossing further into the timeline of the Fed hiking cycle, were causal factors in the rate moves.
- At this stage, all maturities lie within upcoming FOMC meetings, thereby making them highly responsive to the market’s moves and pricing of the Fed.
Term Rates
- The advance rates curve generally mimicked the UST curve week-over-week and bear flattened from the week prior. For instance, while the 2-year was ~26 bps higher, the 5-year was ~14 bps and 10-year ~7 bps higher on the week. Kindly refer to the previous section for relevant market color. While our advance curve has lost previous points of inversion, it is still notably flat in certain areas; for instance, the 3 to 5-year is +6 bps, while 4 to 5-year is inverted by 1 to 2 bps. This condition may provide a compelling opportunity to extend liability duration at minimal coupon increase.
- On the UST term supply front, this upcoming week brings auctions of 2/5/7-year bonds. Given market volatility, members should monitor conditions for potentially more optimal timing on transactions. Please call the Member Service Desk for information on market dynamics, rate levels, or products.
Product Alert: FHLBNY is pleased to announce enhancements to our Advance Rebate Program, which provides members an opportunity to receive a cash rebate when prepaying an eligible advance and rebooking a new advance within a 30-day period. Rebate-eligible advances now must have a minimum of 6-months (reduced from 1-year) remaining. Moreover, the potential cash rebate has been increased. This program can be suitable for those wishing to extend their liability duration and/or potentially improve net interest margin. Please call the Member Service Desk at (212) 441-6600 for more information.
Forward Start Advance (FSA): For members with upcoming borrowing or refunding plans, consider the FSA as a method to opportunistically “lock in” rates before advance settlement date. Please call the Member Service Desk at (212) 441-6600 for more information.
The Symmetrical Prepayment Advance Feature
With rates at or near multi-year lows, it is a compelling juncture to use the SPA feature on term advances. This feature allows member to capture, at prepayment, changes in the Fair Value of the advance which are favorable to the member. Contact us to discuss.
Looking for more information on the above topics? We’d love to speak with you!
Questions?
If you wish to receive the MSD Weekly Market Update in .pdf format (includes FHLBNY rate charts) or to discuss this content further, please email the MSD Team.