Member Services Desk
Weekly Market Update
Economist Views
Click to expand the below image.
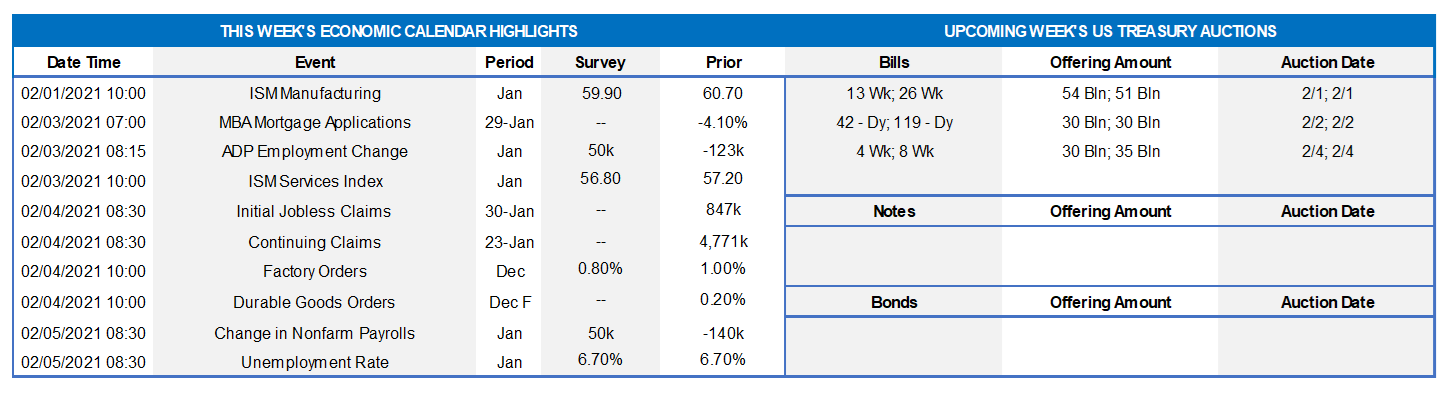
Flipping the first page from the 2021 calendar, market participants will contend with the usual suspects on the economic data-front in the week ahead. Job-count figures are expected to bounce back after December declines, while the civilian unemployment rate moved lower. Manufacturing probably expanded at an accelerated pace in January, while service-producing business activity slowed. New motor vehicle purchases held steady last month but remained well below the 16.8mn tally posted at the beginning of 2020. With the January FOMC meeting now in the rear-view mirror, monetary policymakers will conduct over a half-dozen public appearances this week on a variety of topics.
Construction Spending: The nominal value of new construction put-in-place is expected to rise by 0.8% in December, boosting the cumulative gain since September to 3.3%. The anticipated increase, if realized, would support the view that non-residential and residential investment entered 2021 with positive momentum.
ISM Manufacturing Purchasing Managers Index: Available national and regional manufacturing canvasses suggest that the closely followed ISM barometer moved 1.8 percentage points higher to 62.5% – the strongest reading since December 1983.
Motor Vehicle Sales: Buoyed by attractive incentives and low rates, total car and light truck sales likely remained level with the seasonally adjusted annual rate of 16.3mn recorded in December.
ADP National Employment Report: Private-sector payrolls probably rebounded at the beginning of the New Year, erasing the 123K layoffs posted in December. Having come close to the 95K jobs lost last month in the Bureau of Labor Statistics’ report, the ADP canvass may receive increased attention.
ISM Non-Manufacturing Index: Soundings on service-producing activity suggest that the ISM non-manufacturing gauge likely retreated from December’s 57.7% reading but remained in expansionary territory above the 50% mark for an eighth consecutive month.
Employment Situation Report: Powered by an anticipated snapback in leisure and hospitality positions, nonfarm payrolls likely climbed by an above-consensus 185K in January, more than offsetting the 140K decline recorded in December. Despite the anticipated rebound, the nonfarm job count would begin 2021 a whopping 9.65mn below last February’s pre-pandemic level. The decline in the state insured unemployment between the December and January reference periods, from 3.6% to 3.4%, suggests that nationwide joblessness moved five ticks lower to 6.2% – the lowest level since March. Reflecting a projected shift in the composition of jobs toward lower-paying positions, average hourly earnings growth probably slowed.
Federal Reserve Appearances:
Feb 1: Atlanta Fed President Bostic and Boston Fed President Rosengren to speak at Labor Market Conference.
Feb 2: Cleveland Fed President Mester to make opening remarks at Labor Market Conference.
Feb 3: St. Louis Fed President Bullard to speak about economy and monetary policy.
Feb 3: Philadelphia Fed President Harker to speak at Uneven Outcomes in the Labor Market Conference..
Feb 3: Cleveland Fed President Mester to speak at a Council for Economic Education event.
Feb 3: Chicago Fed President Evans to speak about economy and monetary policy.
Feb 4: San Francisco Fed President Daly to speak at labor market conferenc.
Click to expand the below images.
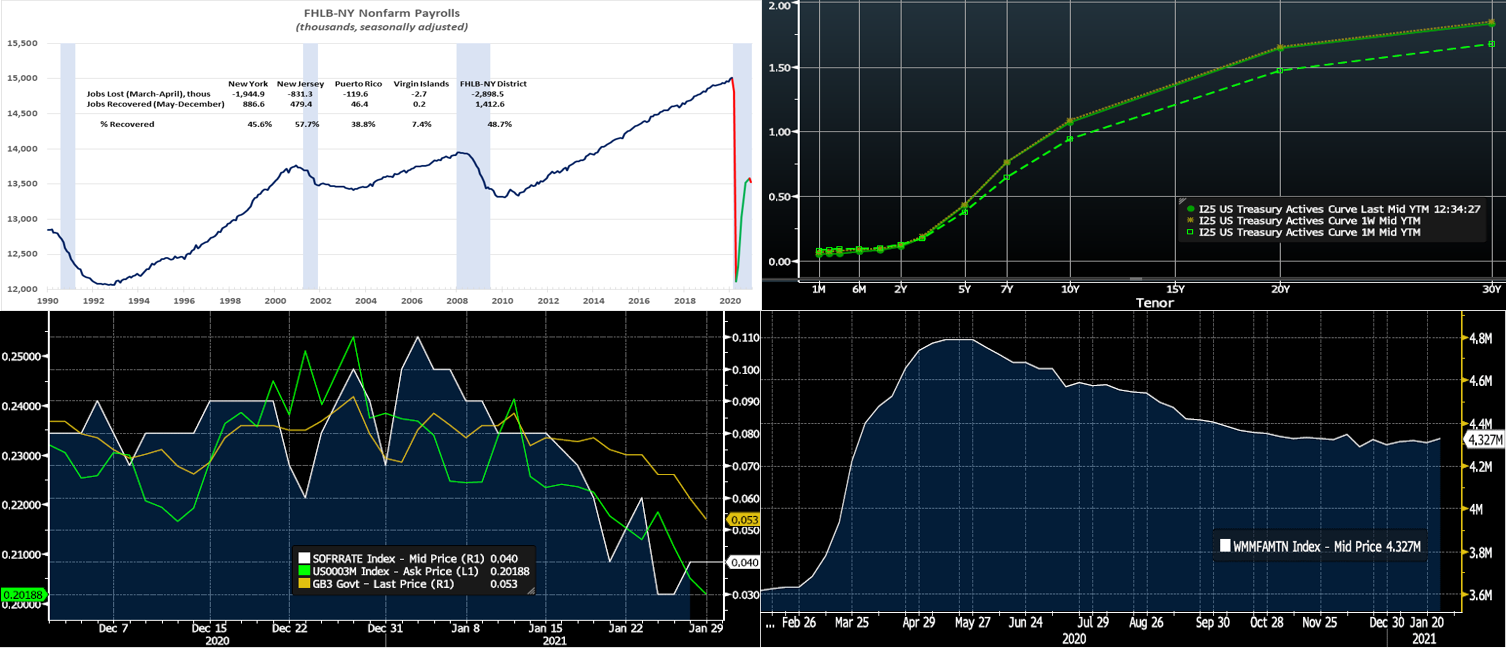
CHART 1 – UPPER LEFT
Source: Bloomberg, BLS, FHLBNY. Nonfarm payrolls across the 50 states, Puerto Rico and the Virgin Islands contracted by 33.9K in December, after a solid 399K jump in November. Reflecting its higher concentration of jobs in the leisure and hospitality industries, jobs across the FHLB-NY district fell by 52.3K last month, following a downwardly revised 28.4K (from 35.9K) rise in November. Last month’s decline was the first in District jobs since the 2.7mn plunge in April. At 48.7%, the jobs recovery in our coverage area thus far remains well behind the 55.6% rebound posted nationwide. Indeed, only NJ has recovered more than half of the positions lost in the pandemic. Construction, manufacturing, and retail across the two states and territories have experienced the most success in recouping jobs, while business services, education & health, and leisure & hospitality have endured a tougher climb owing to the resurgence of Covid-19 and the reimposition of social-contact restrictions.
CHART 2 – UPPER RIGHT
Source: Bloomberg. The UST curve finished little changed, with rates a bp or two lower 4-year and longer. The Fed’s guidance and programs continue to pin shorter-end yields. Longer yields traded down and up during the week, with the 10-year UST briefly reaching sub-1% only to rebound owing to conflicting factors. Economic data has remained mixed. The distressing Covid-19 situation of the past two months appears to be moderating somewhat, and there are bolstered vaccination and relief measures underpinning optimism for the months ahead. Another further round of relief legislation has been proposed by the new Administration and remains in the support-gathering and details phase. These dynamics should contain any large dip in longer term rates. Meanwhile, with the recovery still challenged by Covid-19, plus investors’ search for return in a world of historically low global yields, the curve faces obstacles to any large near-term upward move. The FOMC meeting “came and went” the past week without much impact; policy is to remain accommodative, and Chairman Powell termed any discussion of a tapering of the Fed’s asset purchases as “premature”.
CHART 3 – LOWER LEFT
Source: Bloomberg. Short-term rates have trickled lower in recent weeks. Portrayed here is 3-month Libor (LHS, %), 3-month T-bills (RHS, %), and SOFR (RHS, %). Libor has hit a record low. Various factors have contributed to the trend, such as lower T-bill supply, GSE’s holding/investing higher cash levels, lower supply of short-term paper, decreased leverage in the markets, and overall high liquidity levels. Please call the desk for further color or information.
CHART 4 – LOWER RIGHT
Source: Bloomberg. Another contributor to lower short-end rates has been high levels of assets in money market funds. As seen here, AUM in this complex steadily declined from its peak last spring but has steadied in recent months and, after a $20.5bn gain the past week, now rests at ~$4.33trn.
FHLBNY Advance Rates Observations
Front-End Rates
Short-end advance rates finished 1-2 bps lower week-over-week. T-bill issuance was its usual market feature, but net supply has slowed and thereby allowed for easier market absorption. Money market funds’ AUM increased by ~$20.5bn this past week. From a bigger-picture vantage point for 2021, an overall moderation in market supply of short paper is expected to help keep short-end rates relatively steady.
Heavy T-Bill issuance will remain a theme; UST issuance overall is now net positive supply in that more is being issued than what the Fed is buying in its programs. However, with short UST rates at rock-bottom levels and the Fed on hold for a long period, rates are likely to persist in a near-term sideways to softer pattern. Importantly, weekly net T-bill issuance has been lower since last summer and even negative in recent months, and Treasury has announced plans to shift issuance out the curve. Even with a new relief package and related borrowing, these supply/demand and Treasury issuance dynamics should keep short rates in check on the upside.
Term Rates
On the week, medium and longer-term Advance rates were generally unchanged in the shorter-end and 1-2 bps lower 3-year and further. Please refer to the previous section for further color on relevant market dynamics.
On the UST supply front, next week brings a reprieve in UST term auctions; the past week’s auctions enjoyed notably solid demand from investors. Corporate issuance should accelerate further post its usual strong start-of-the-year pattern and earnings releases. Focus this week will turn to jobs data but also remain on Covid-19 and fiscal legislation developments.
New Product Alert: In order to satisfy member needs and provide greater product flexibility to match bond and derivative market conventions, FHLB-NY now offers SOFR-linked advances based on SOFR-index compounding. Note that this product is in addition to SOFR-linked advances based on SOFR-index averaging which have been offered since November 2018.
The Symmetrical Prepayment Advance Feature
With rates at or near multi-year lows, it is a compelling juncture to use the SPA feature on term advances. This feature allows member to capture, at prepayment, changes in the Fair Value of the advance which are favorable to the member. Contact us to discuss.
Looking for more information on the above topics? We’d love to speak with you!
Questions?
If you wish to receive the MSD Weekly Market Update in .pdf format (includes FHLBNY rate charts) or to discuss this content further, please email the
MSD Team.
Special Member Alert
The FHLBNY recently announced a newly expanded and flexible Disaster Relief Funding (DRF) advance program which offers discounted rate advances with maturities 1-mo and greater. Additionally, we have announced that PPP loans will be accepted as eligible collateral. Please contact us with any questions.