Member Services Desk
Weekly Market Update
This MSD Weekly Market Update reflects information for the week of December 20, 2021.
Economist Views
Click to expand the below image.
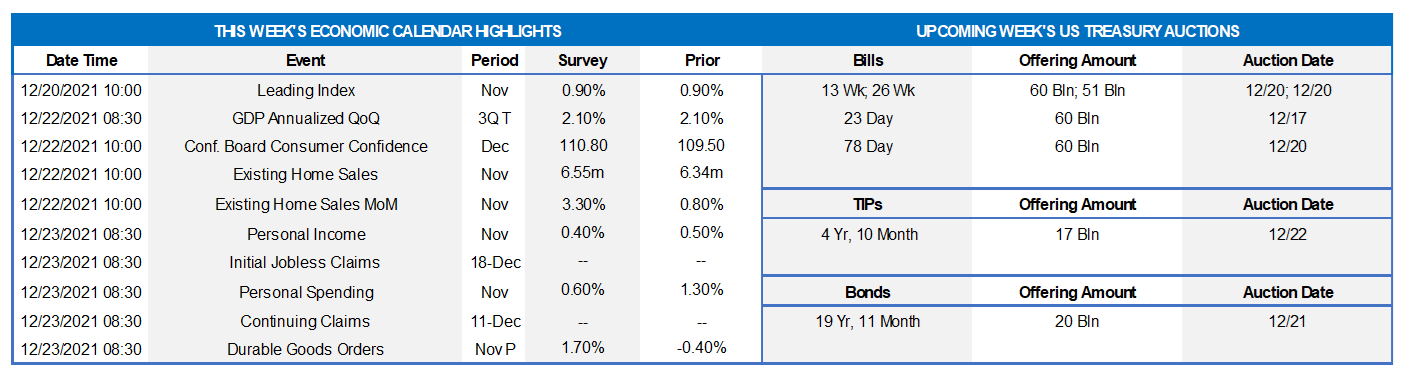
Market participants will contend with a crowded economic release calendar ahead of Christmas. Buoyed by healthy labor market conditions, consumer sentiment probably improved heading into year-end. Solid readings on home sales and capital goods shipments likely will reinforce expectations for an acceleration in real GDP growth during the final quarter of 2021. Soundings on unemployment insurance claims are expected to point to a sharp pickup in job creation and yet another drop in the civilian jobless rate in December.
Leading Indicators: The Conference Board’s composite gauge of prospective economic activity is expected to have climbed by .8% in November, almost matching October’s .9% gain.
Real GDP Growth: Data released subsequent to the Bureau of Economic Analysis’ preliminary estimate suggest no change to the 2.1% annualized pace reported at that time.
Conference Board Consumer Confidence: Available sentiment soundings suggest that the Conference Board’s consumer confidence gauge rebounded to a four-month high of 114.5 in December from 109.5 in the preceding month. As always, pay attention to the so-called labor differential – the percentage of survey respondents feeling that jobs are plentiful less than those believing they are hard to get – for clues to the likely change in the civilian jobless rate this month.
Existing Home Sales: The pickup in purchase-contract signings witnessed over the September-October span suggests that existing home sales rose by 2.7% to a ten-month high seasonally adjusted annual rate of 6.51mn in November. With available dwellings on the market likely falling by 120K to 1.13mn during the reference period, the stock of unsold homes likely moved three ticks lower to 2.1 months’ supply.
Personal Income & Spending: Buoyed by a reported pickup in private wages and salaries, personal income probably rose by .5% in November, following a similar increase in October. Consistent with last month’s slowdown in control retail sales, personal spending likely climbed by .6%, following a steamy 1.3% prior- month gain.
Jobless Claims: Initial and continuing claims under regular state unemployment insurance programs probably moved lower over their latest respective reporting periods. The termination of pandemic-related jobless benefits suggests that the total number of persons receiving assistance will also decline during the week ended December 4 from the 2.46mn, or 1.5% of the civilian labor force, recorded in the prior week.
Durable Goods Orders: Powered by an aircraft-led rebound in transport equipment requisitions, durable goods orders probably jumped by 1.7% in November, after a .4% dip in the previous month. Excluding the anticipated strength in transport requisitions, “hard goods” bookings are expected to have climbed by .5%, matching the reported October gain. Last month’s nondefense capital goods shipments excluding commercial jetliner deliveries will allow economists to mark-to-market their estimates for the contribution of business equipment spending to Q4 real GDP growth.
New Home Sales: Reported increases in single-family building permits and housing starts in November suggest that contracts to buy a newly constructed dwelling likely rose by 8.7% to an eight-month high seasonally adjusted annual rate of 810K.
Federal Reserve Appearances: None scheduled at this time.
Click to expand the below image.
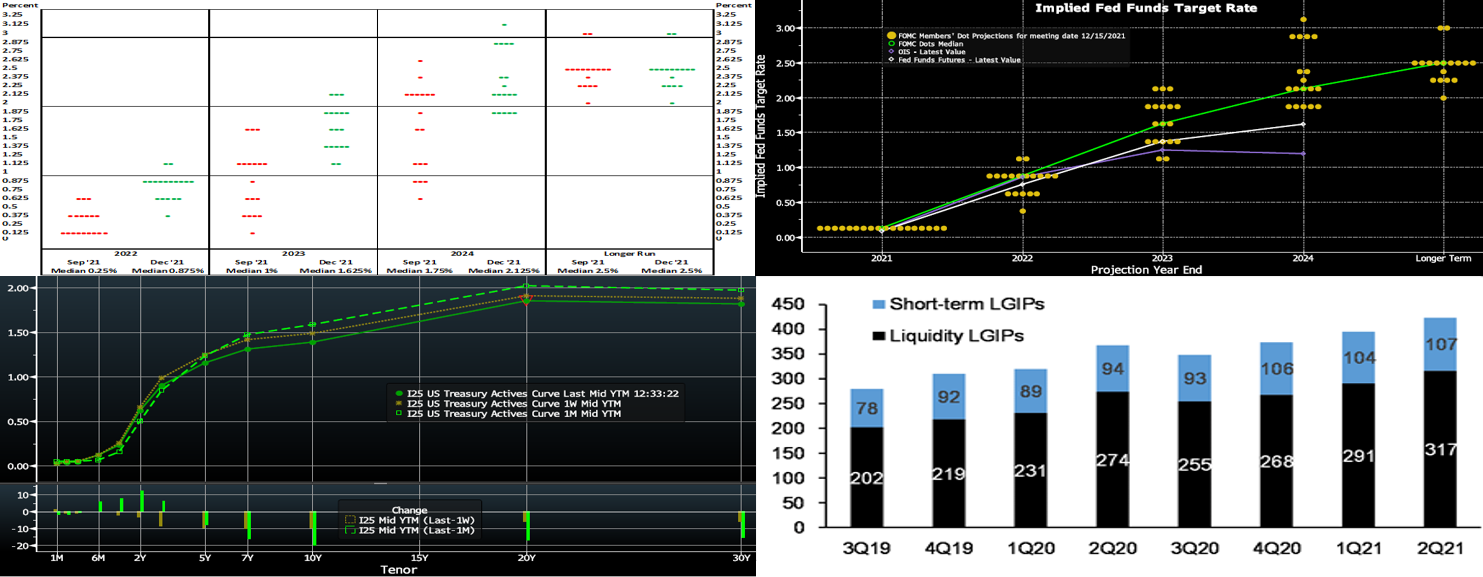
CHART 1 UPPER LEFT
Source: Federal Reserve Board; FHLB-NY. Federal Reserve officials’ projections for the federal funds rate target range at the end of next year moved closer to market expectations at this past week’s December FOMC meeting. FOMC participants now anticipate three 25 bp hikes next year, followed by another trio of similar-sized increases in 2023, per this chart of the Fed’s freshly revised “dot plot”. The median projection for the federal funds rate at the end of 2024 was also boosted to 2.125% from 1.75% at the September meeting. The longer-run federal funds rate was left unaltered at 2.5%. Market participants remain divided, as implied by pricing from the short-term yield curve, as to whether the liftoff in administered rates will occur at 2022’s May or June FOMC meetings. Per expectations, the Fed also announced a doubling of the reductions (to $20bn/month UST and $10bn/month MBS) in its securities purchases; this pace will would end its net-purchases in March. Beyond this point and until it decides to “normalize” its balance sheet, the Fed will likely continue to re-invest principal payments from MBS and roll over maturing USTs at auctions.
CHART 2 UPPER RIGHT
Source: Bloomberg. As of midday Friday, evident in this companion “dot plot” chart to Chart 1, market participants, as reflected here in the fed funds futures and OIS curves, are generally “in line” with the Fed projections for the end of 2022. But market pricing and the Fed dots diverge thereafter, with the former pricing for a lower trajectory in 2023 and later years. As mentioned above, the FOMC’s “longer-run” projection for the fed funds rate is 2.5%. The market, however, is well below that level. In this sense, the market apparently expects forthcoming hikes to arrest inflationary forces (symbolized by the Breakeven inflation rate on 5-year TIPS which has fallen ~50 bps in the past month) and lead to a slowing economic growth trend which will then place the Fed back on pause, much like recent hiking cycles that were “short-circuited”. This pricing has been one of the drivers of the recent flattening trend in the yield curve. The market, historically, has often been incorrect in its predictive pricing of Fed cycles. But given recent cycles, low global rates, strong foreign demand for US securities, plus an ongoing pandemic and its uncertainties, the market appears poised to maintain this pricing in the near-term.
CHART 3 LOWER LEFT
Source: Bloomberg. Note: Top pane is yield (%), bottom pane is change (bps). Somewhat oddly, given a relatively hawkish FOMC mid-week, yields finished lower and the curve flatter out to the 10-year point week-over-week. While the 2-year was a few bps lower, the 3-year was ~8 lower, and the 5 to 10-year sector ~10 bps lower. Beyond the color points mentioned above, worsening pandemic news (higher case-counts, Omicron spread, closures and canceled events) and faltering stock markets also helped prod rates and the curve lower/flatter late in the week. With year-end looming, flight-to-quality flows into USTs is also a likely dynamic.
CHART 4 LOWER RIGHT
Source: Fitch; JP Morgan. As seen here in this chart of local government investment pools (“LGIP”, LHS, $bn), liquidity portfolios of states and local governments have increased meaningfully over the past two years, as they were beneficiaries of both the CARES and ARP fiscal stimulus packages. Given that states and local governments are expected to receive the second portion of the ARP fiscal payments in 2022 and that tax receipts have thus far outpaced spending, there could be continued liquidity accumulation among states and local governments next year. For our members experiencing local government deposits but not familiar or not using our Municipal Letters of Credit product, we encourage you to contact us and/or visit https://www.fhlbny.com/business-lines/credit-products/letters-of-credit/#mulocs.
FHLBNY Advance Rates Observations
Front-End Rates
- Short-end Advance rates 6-month and shorter finished mostly unchanged week-over-week. With the debt ceiling now resolved, there is expectation that net bill issuance will move into positive territory for a few months, as Treasury aims to rebuild their TGA cash balances. While this trend will somewhat change the short-end’s supply/demand dynamic, there is still ample demand for short paper. Demand for the Fed’s RRP, which stands last at a fresh record of ~$1.66trn, remains strong. Money market funds’ AUM finished roughly flat week-over-week and resides at a record high. With year-end looming, some investors have steered funds to the safety of the short-end.
- UST issuance overall is now net positive supply in that more is being issued than what the Fed is buying in its programs. However, with short UST rates at rock-bottom levels and the Fed on hold very near-term, the shortest tenor rates are likely to persist in a near-term sideways pattern. T-bills are expected to experience an issuance increase, but this uptick should not alter the overall money markets paradigm of strong demand amidst limited supply. To reiterate, as time ensues and maturities cross into spring/summer 2022, a timeframe the market prices a strong probability of rate hikes, these maturities’ rates are likely to experience some upward drift.
Term Rates
- The advance curve mimicked the UST curve, with rates lower and the curve flatter week-over-week. For instance, while 2-year was unchanged, the 5 to 10-year sector finished ~7 to 8 bps lower. Kindly refer to the the previous section for relevant market color. On the UST supply front, this week provides a 5-year TIPS and 20-year nominal auction.
**Our Weekly Update will return on Monday, January 10. Please contact the Member Services Desk for information or updates on economic releases, rates, markets, and holiday schedules. In the interim, enjoy a safe and happy holiday season!
New Product Alert: FHLBNY is pleased to announce the launch of the Business Development Advance (BDA) on Thursday, November 4, 2021. The BDA is a 0% advance to help our members provide funding to qualifying small businesses to promote community & economic growth. The BDA is subsidized funding in the form of interest-rate credits. There is a total of $3 million of interest-rate credits available in 2021. Members can request to reserve their interest-rate credits up to $50,000 on a first-come/first-served basis. For further details, please view our BDA overview page and watch this past Thursday’s BDA webinar, and/or contact the Member Service Desk at 1-800-546-5101 option 1.
The Symmetrical Prepayment Advance Feature
With rates at or near multi-year lows, it is a compelling juncture to use the SPA feature on term advances. This feature allows member to capture, at prepayment, changes in the Fair Value of the advance which are favorable to the member. Contact us to discuss.
Looking for more information on the above topics? We’d love to speak with you!
Questions?
If you wish to receive the MSD Weekly Market Update in .pdf format (includes FHLBNY rate charts) or to discuss this content further, please email the MSD Team.