Member Services Desk
Weekly Market Update
Economist Views
Click to expand the below image.
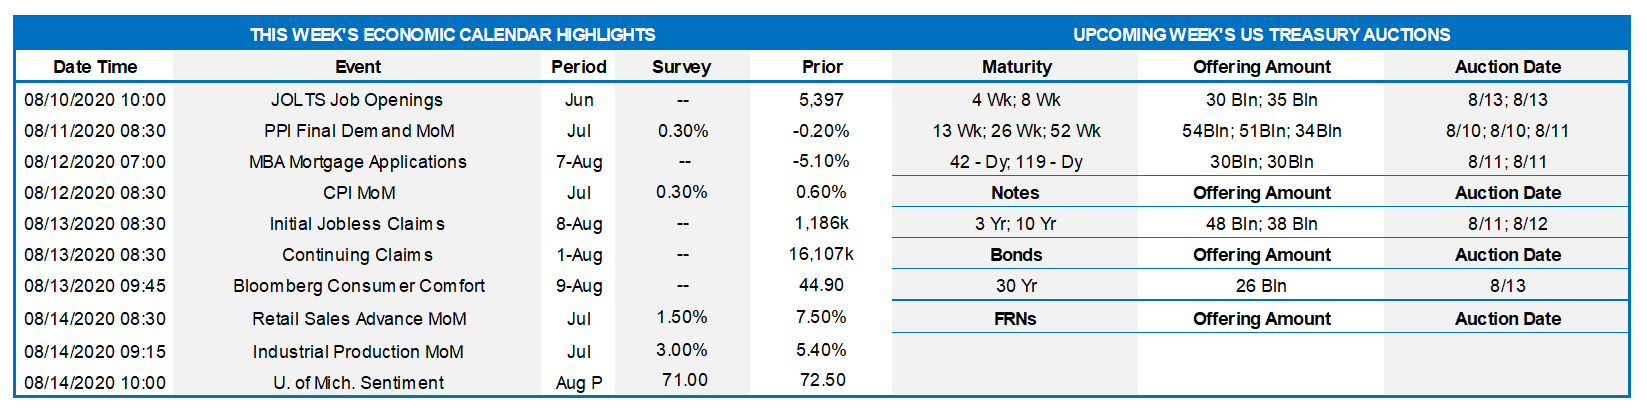
With the magnitude of the COVID-19 contraction on economic activity now on paper, and the Federal Open Market Committee not slated to meet until mid-September, the attentions of market participants will be centered on gauging the contour of the prospective summer bounce-back. Data currently in hand have projections for Q2 real GDP growth coalescing around 20%. However, with recent economic figures besting Street forecasts by significant margins, the balance of risks appears skewed to the upside. Next week’s updates on industrial production and retail sales will prompt forecasters to take another look at their current estimates. The latest update on jobless claims probably will be consistent with further improvements in hiring conditions beyond the survey period for the July employment report.
Jolts Job Openings: A reported pickup in online help-wanted postings suggests that the Bureau of Labor Statistics’ count of available positions likely rose to 5.725mn in June from 5.4mn in the previous month.
Consumer Prices: Widespread increases in retail goods and services costs probably pushed the Consumer Price Index (CPI) 0.3% higher in July, after a 0.6% increase in June. Excluding anticipated hikes in food and energy costs, the core CPI likely edged 0.2% higher for a second straight month. The Street projections, if realized, would place the overall and core CPIs 0.7% and 1.1% above their respective July 2019 levels, both well shy of the Federal Reserve’s desired 2% target.
Weekly Jobless Claims: Initial claims for unemployment insurance appear poised to move back below the 1mn mark, for the first time since the middle of March, over the filing period ended August 8. The total number of persons receiving regular state benefits likely declined from the 16.1mn tallied over the week ended July 25.
Retail & Food Services Sales: The Census Bureau’s report will provide important insight into the potential rebound in Q3 consumer spending. Given last month’s 11.3% jump in unit motor vehicle sales to a seasonally adjusted annual rate of 14.5mn, the median Street call for a 1.8% rise seems unduly conservative. Of most importance will be the figure for “control” purchases last month. Excluding autos, building materials and gasoline, this series feeds directly into the Bureau of Economic Analysis’ estimate of nominal consumer spending. The consensus forecast of 0.8% would place control sales a hefty 34.5% annualized above their spring-quarter level, supporting expectations of a V-shaped recovery from the COVID-19 contraction.
Industrial Production: A jump in factory hours worked, combined with a weather-induced increase in utilities output, suggests that industrial production rose briskly in July, building on June’s solid 5.4% gain. The capacity utilization rate appears poised to move above the 70% mark for the first time since March.
Michigan Consumer Sentiment: Weekly soundings suggest that the University of Michigan’s confidence barometer climbed to 74.7 in early August, reversing a little over one third of July’s reported slide.
Key Market Trends
Click to expand the below images.
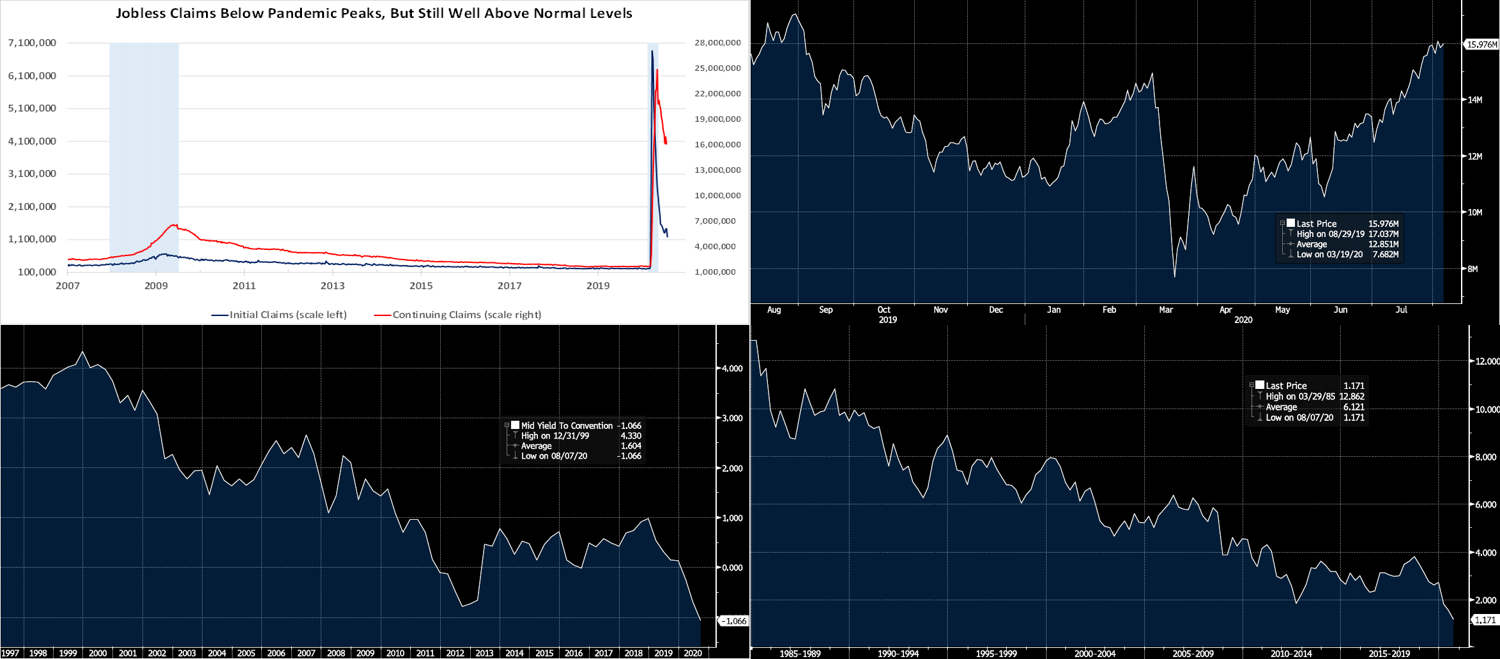
CHART 1 – UPPER LEFT
Source: FHLBNY. As cited in the previous slide, economic data has mostly been coming in higher than Street forecasts. Fed actions and legislative relief packages, along with the expected return of activity post-lockdowns, have served to generate a bounce-back in economic trends. As a reminder of the challenging road to recovery, however, jobless claims remain well above normal and pre-pandemic levels. While encouraging, the 9.3mn jobs added over the past three months have recouped just 41.9% of the 22.2mn positions lost amid the crisis. The Fed again last week stressed that downside risks remain to the economy and that rates are on hold for the foreseeable future; it also continues to advocate for fiscal relief, including for states. Talks continue among legislators on a potential new package.
CHART 2 – UPPER RIGHT
Source: Bloomberg. Depicted here is the Bloomberg Barclays Global Aggregate Negative Yielding Debt Index (in USD market value). At 15.98trn, it has edged towards all-time highs! The theme of low and negative global rates contributing to the containment of US rates has been evident for years, but now the global pandemic and massive governmental and central bank relief/stimulus programs appears sure to prolong these interest rate dynamics. This past week UST yields again reached fresh all-time record lows, although they retraced higher late in the week.
CHART 3 – LOWER LEFT
Source: Bloomberg. Speaking of negative yielding debt, here in the US there is indeed a negative-yielding security – US TIPS (Treasury Inflation Protected Securities). The 10-year TIPS now trades at an all-time record low of ~-1.06%! This yield can be considered a “real yield”, i.e. the yield an investor will earn after inflation. With the regular 10-year UST trading at ~.56%, the TIPS implies an inflation adjustment of ~1.62% (referred to as inflation “breakeven” in market parlance) over the time period. Again, the unprecedented Fed and fiscal responses to the crisis have driven both nominal and real yields lower.
CHART 4 – LOWER RIGHT
Source: Bloomberg. Mortgage-related rates have also touched record lows in the past week. Portrayed here is the Agency MBS 30-year Current Coupon (represents the yield of a par-priced Agency MBS) at a record low of 1.17%! While this move may not be beneficial for investors’ fresh securities purchases, it has served to help drive down consumer mortgage rates and thereby provide an economic pillar via increased mortgage and housing activity. Consumer 30-year mortgage rates have hit a record low national average of ~3%.
FHLBNY Advance Rates Observations
Front-End Rates
Short-end advance rates were generally unchanged week-over-week. Heavy T-bill issuance was a feature, as usual, but net supply has been slowing and thereby allowing for easier market absorption. Government-only and Prime MMF AUM experienced modest inflows on the week to help demand for short paper. Increased liquidity and demand in the market again allowed
for our 1-month and shorter advance rates to post a modest 1 bp decline for the week.
Heavy T-Bill issuance will remain a theme; UST issuance overall is now net positive supply in that more is being issued than what the Fed is buying in its programs, and so this scenario could prove a small challenge. However, with short UST rates at rock-bottom levels, and the Fed likely on hold for a long period, rates may trade in a sideways-to-lower pattern. Net T-bill issuance is forecast by Street dealers to notably slow in the months ahead, and Treasury has announced plans to shift issuance out the curve, but a new fiscal relief package may complicate/alter this forecast.
Term Rates
Medium and longer-term advance rates were 1-2 bps lower from 1 to 3-year but 1-2ps higher thereafter, week-over-week. The curve has remained in a relatively tight range, especially in shorter maturities, and volatility has been low. UST yields touched fresh record lows early in the week only to retrace by week’s end.
The upcoming week brings heavy and record-high UST term supply in the form of the Treasury’s quarterly refunding of 3/10/30-year notes. This supply is likely the reason for the curve to modestly steepen towards the end of the week. Treasury also announced its plans to lengthen the maturity profile of its issuance via more longer–term issuance and less T-bills. Attention will remain on further relief legislation and certainly also on COVID-19 and the question of whether or not it is being managed effectively enough to avoid further pauses in reopening. A key data highlight will be the jobless claims release and its trends.
The Symmetrical Prepayment Advance Feature
With rates at or near multi-year lows, it is a compelling juncture to use the SPA feature on term advances. This feature allows member to capture, at prepayment, changes in the Fair Value of the advance which are favorable to the member. Contact us to discuss.
Looking for more information on the above topics? We’d love to speak with you!
Questions?
If you wish to receive the MSD Weekly Market Update in .pdf format (includes FHLBNY rate charts) or to discuss this content further, please email the
MSD Team.
Special Member Alert
The FHLBNY recently announced a newly expanded and flexible Disaster Relief Funding (DRF) advance program which offers discounted rate advances with maturities 1-mo and greater. Additionally, we have announced that PPP loans will be accepted as eligible collateral. Please contact us with any questions.
Disclaimer: Notwithstanding any language to the contrary, nothing contained in these disclosures is intended to constitute an offer, inducement, promise, or contract of any kind. Any product descriptions and pricing may be subject to change without notice.
The content provided in these disclosures is presented as a courtesy to be used only for informational purposes and is not represented to be error free. The FHLBNY makes no representations or warranties of any kind with respect to the content contained herein, such representations and warranties being expressly disclaimed. The FHLBNY is not a financial or investment advisor.
Moreover, the FHLBNY does not represent or warrant that the content of these disclosures is accurate, complete or current for any specific or particular purpose or application. It is not intended to provide nor should anyone consider that it provides legal, accounting, tax or other advice. Such advice should only be rendered in reference to the particular facts and circumstances appropriate to each situation. The FHLBNY encourages you to contact appropriate professional(s) and consultant(s) to assess your specific needs and circumstances and to render such advice accordingly. In addition, the FHLBNY is not endorsing or recommending the use of the means or methods contained in or through these disclosures for any special or particular purpose.
It is solely your responsibility to evaluate the risks or merits of any funding or investment strategy. In no event will FHLBNY or any of its officers, directors or employees be liable for any damages — whether direct, indirect, special, general, consequential, for alleged lost profits, or otherwise – that might result from any use of or reliance on these materials.