Member Services Desk
Weekly Market Update
This MSD Weekly Market Update reflects information for the week ending February 17, 2023.
Economist Views
Click to expand the below image.
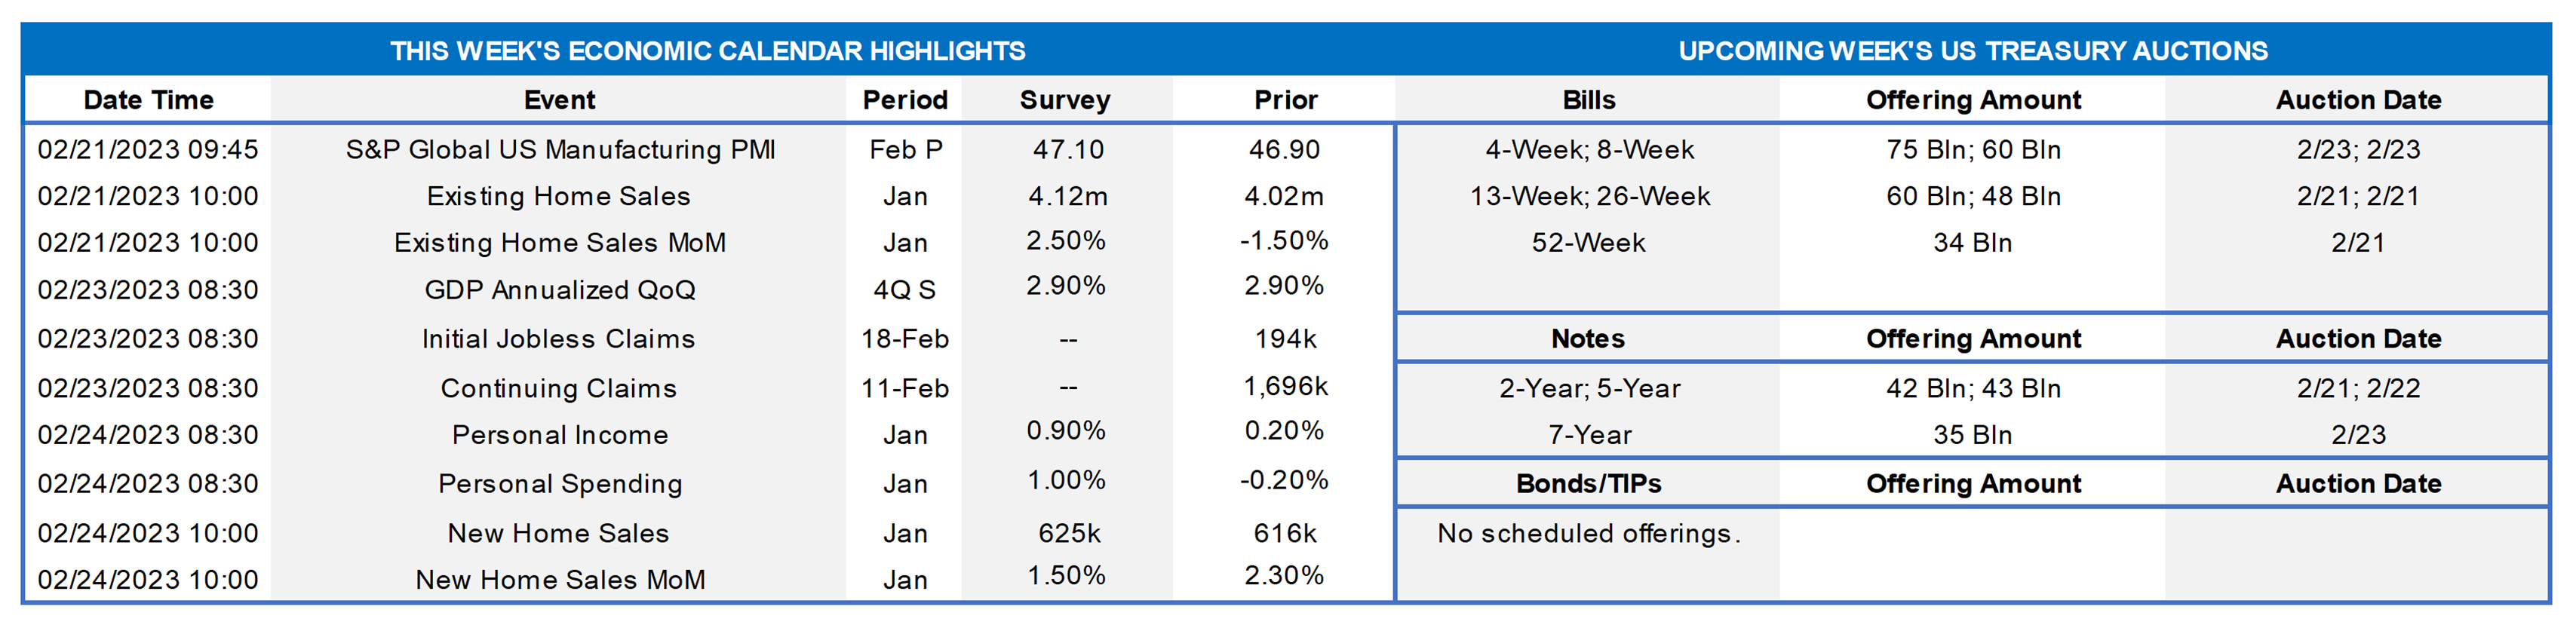
With the upcoming Presidents’ Day weekend, market participants will encounter a lighter economic release calendar. Sales of both existing and newly constructed dwellings probably rose at the beginning of 2023. Current data suggest that real GDP growth likely topped the 3% mark once again during the fall quarter. Soundings from the January employment report point to a solid jump in personal income in January, buoying an anticipated rebound in consumer spending. The minutes from the recent Federal Open Market Committee meeting may provide useful color on policymakers’ views on the necessity of further administered rate hikes.
Existing Home Sales: Home-purchase contract signings over the November-December span suggest that closings on existing dwellings edged .7% higher to a seasonally adjusted annual rate of 4.05 mn dwellings in January, stemming the 38.1% dive witnessed over the prior 11 months. While the number of homes on the market likely contracted by 3.1% to a 10-month low of 940K in January, the months’ supply at the estimated sales rate would move one tick lower to 2.8 months.
Real GDP Growth: Data released since the Bureau of Economic Analysis’ advance report suggest that real GDP growth topped 3% annualized during the final quarter of last year.
Jobless Claims: New claims for unemployment insurance benefits probably remained below the 200K mark for a sixth straight week during the period ended February 17. Keep an eye on continuing claims, which have clocked in below the 1.7mn mark since mid-December, for any signs that recently furloughed employees may be having a more difficult time finding work.
Personal Income & Spending: Powered by a sharp increase in wages and salaries, personal income likely rose by .8% in January – the largest gain since last October. Consumer spending is expected to record a similar gain during the reference period, erasing the .3% decline witnessed over the final two months of 2022.
New Home Sales: Buoyed by recent reductions in mortgage interest rates, sales of newly constructed dwellings likely climbed by 3.6% to a seasonally adjusted annual rate of 638K, boosting the cumulative rise since last September to 16%.
Federal Reserve Appearances:
- Feb. 22 Federal Reserve Board to release minutes from January 31-February 1 FOMC meeting.
- Feb. 23 Atlanta Fed President Bostic to discuss the Federal Reserve’s role in the banking system at an event hosted at his bank.
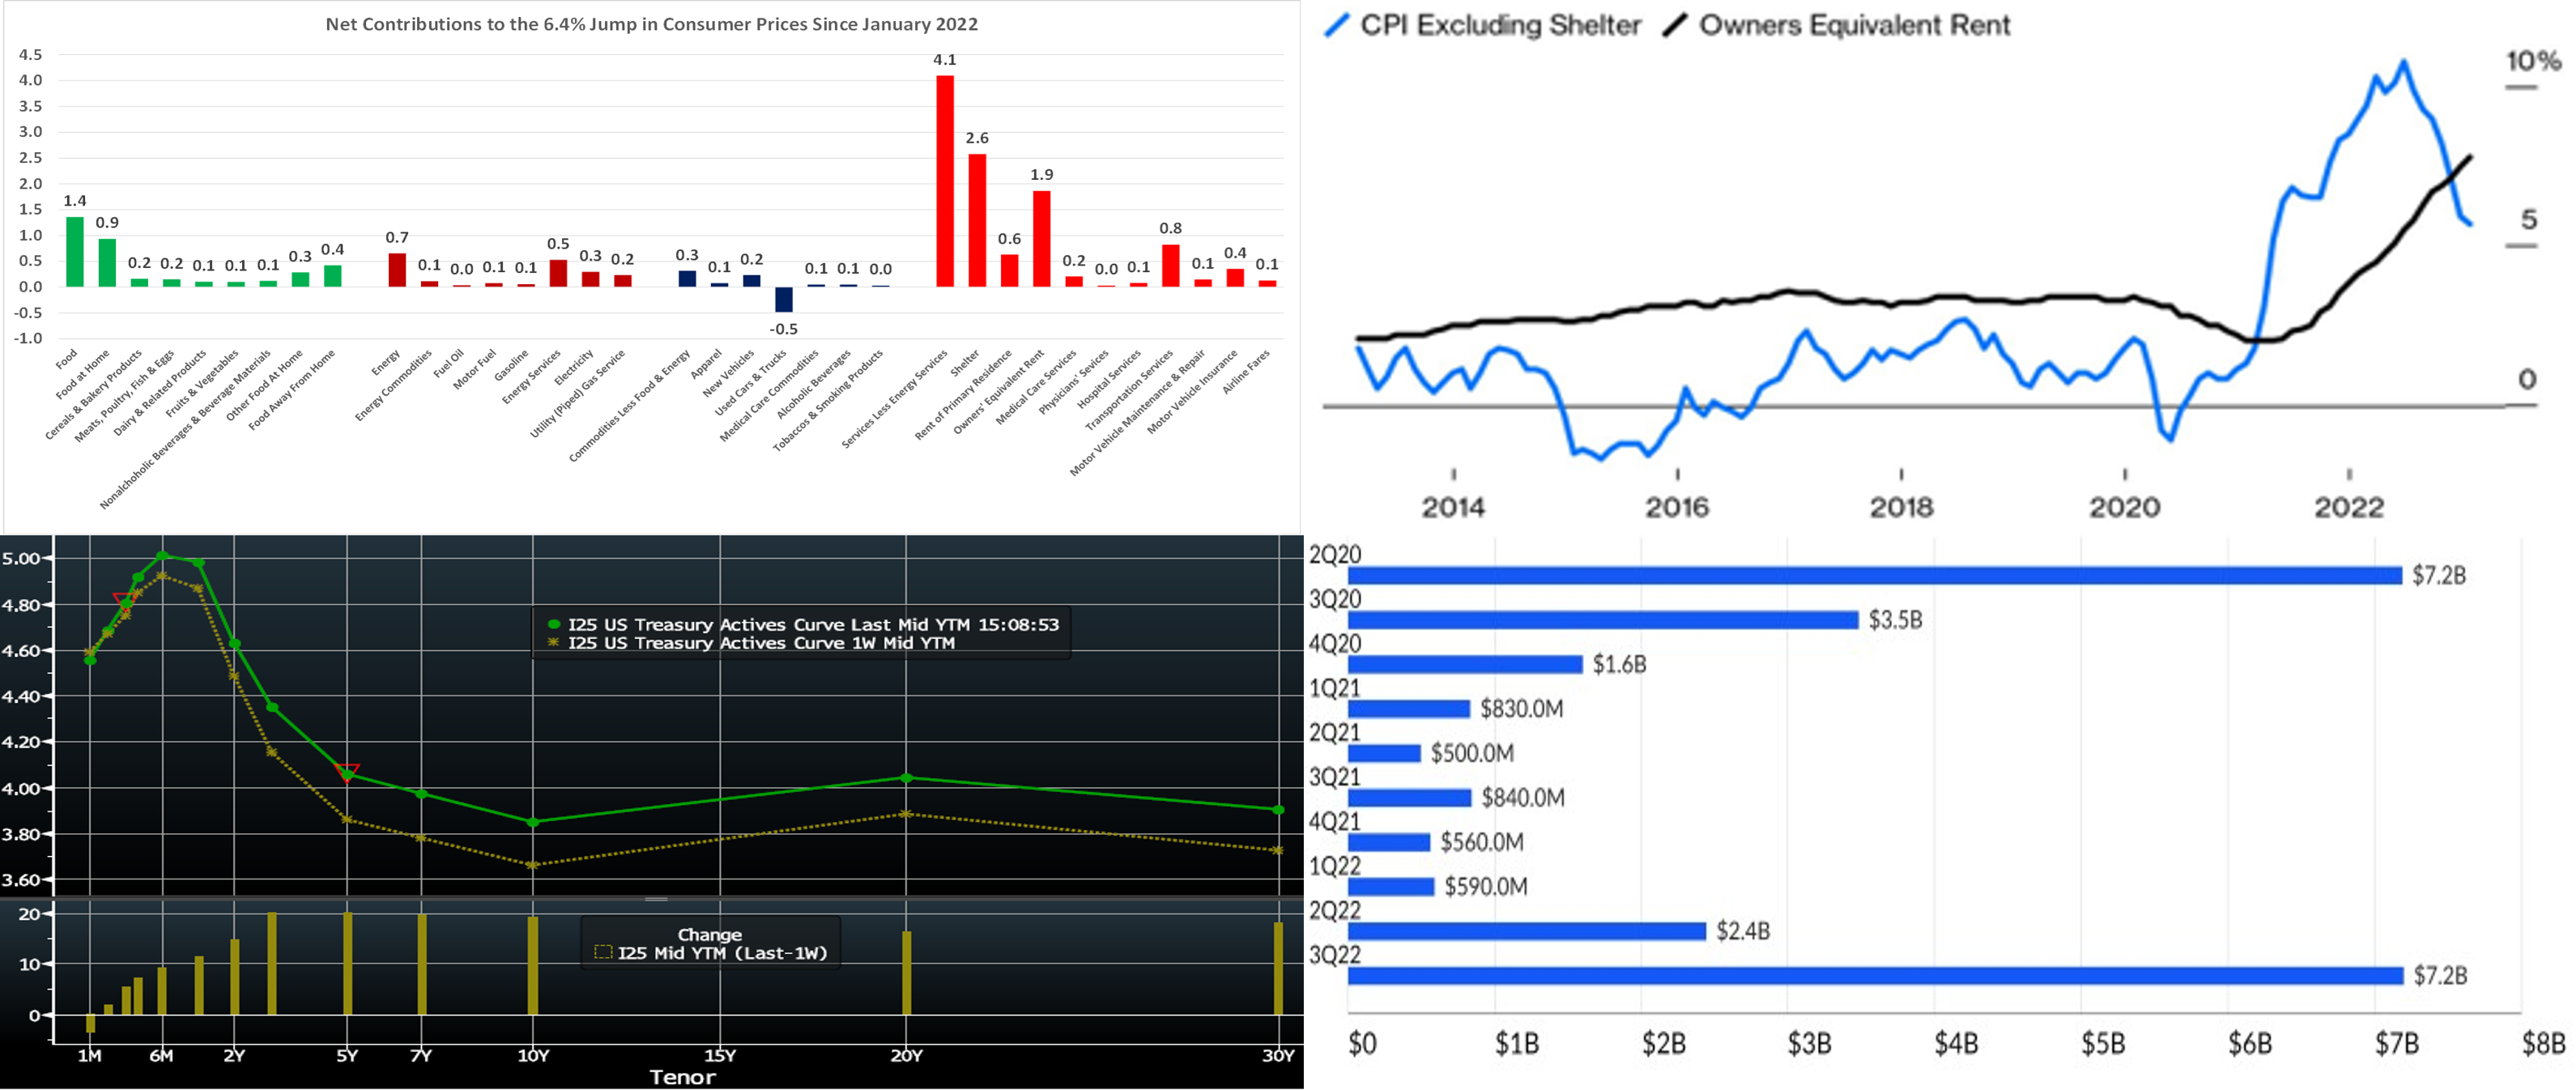
CHART 1 UPPER LEFT
Source: Bureau of Labor Statistics; FHLB-NY. January’s pickup in both overall and core consumer price measures matched market expectations. It is instructive to take a closer look at the factors driving consumer price inflation since the beginning of last year. While the 6.4% jump in CPI since January 2022 has been broadly based across goods and services categories, a little over 60% of the reported rise was attributable to higher food and shelter costs. On a positive note, available data suggest that the latter should be poised for a significant pullback in coming months.
CHART 2 UPPER RIGHT
Source: Bloomberg Intelligence. Here is a view of the just-noted impact of shelter costs on headline CPI. The Owners Equivalent Rent component (estimate of implicit rent that would be payable for properties) continues to increase while an index excluding shelter has dropped sharply since a peak above 10% last summer. As hinted above, an encouraging point is that rent in the index tends to be backward-looking, since it includes all leases currently in force. Various estimates, based on contracts begun in recent months, suggest that rents are beginning to decline month-on-month. This dynamic will take time, and various services components of CPI are not yet in retreat; in this light, the Fed will be highly attuned to ongoing data and surely be patient in declaring that its work is done.
CHART 3 LOWER LEFT
Source: Bloomberg. Top pane is yield (LHS, %), bottom pane is change (bps). As of Thursday afternoon, UST term yields moved ~9 to 20 bps higher week-over-week, led by the 3 to 10-year sector. The CPI/PPI/retail sales releases this past week were each on the stronger side of market expectations, and Fed-speak sustained a hawkish tone. Debates on the 2023 economic “flight path” had previously centered on “soft vs. hard landing” but now include “no landing”. Consequently, the market has further repriced higher and longer the prospective path of Fed hikes. The market’s pricing for end-2023 is now ~5.02%, up from last week’s 4.85%. The market has also priced higher the peak rate to ~5.23% for this August, up from ~5.145% of a week ago. Fed members have promoted in recent months a “higher for longer” rates posture, and the market has definitively gotten on board in the past few weeks, albeit still pricing a year-end easing timeline at odds with Fed projections.
CHART 4 LOWER RIGHT
Source: Federal Reserve; American Banker. Shown here is recent Fed quarterly data on bank borrowing from its discount window. Usage rose to $7.2bn in Q3 2022, the highest since the early stages of the pandemic in 2020. Declining cash and deposit levels have fed the uptrend, and smaller banks, which generally possess less wholesale funding options and feel less stigma regarding discount window usage, have driven most of the interest. The Fed noted the decline in the total level of reserves in the banking system; indeed, the Fed’s ongoing reduction of the asset side of its balance sheet should keep this dynamic intact near-term. When considering either the discount window or any other funding source, please remember to assess and compare the “all-in” (incorporating FHLB-NY’s dividend) cost of our advances. The latest dividend for Q4 2022, announced this past Wednesday, was 7.50%. The dividend’s impact on the all-in cost of an advance can be notable; for more information and to obtain our “All-in” Rate Calculator tool, kindly contact us on the desk.
FHLBNY Advance Rates Observations
Front-End Rates
- Short-end rates were unchanged in the very short-end but 2 to 11 bps higher, in steepening fashion, in the 1-month-and-out tenors, week-over-week. The move higher was essentially on upwardly revised pricing of the Fed’s hiking path. Please see the previous section for more specific Fed-pricing color.
- Given the Fed’s ongoing tightening and data-dependent posture, rates will be most responsive to Fed-speak and the data calendar.
Term Rates
- The longer-term curve moved 14 to 19 bps higher week-over-week, as of Thursday afternoon, led by the 3 to 7-year sector and generally mirroring moves in USTs and swaps. The 1-year advance only increased ~6bps, owing to fortuitous funding markets in that zone. Kindly refer to the previous section for relevant market color. The advance curve remains inverted out to 5-year, thereby offering opportunities to extend in advance duration at lower coupon cost.
- On the UST term supply front, this upcoming week serves 2/5//7-year auctions. Corporate bond issuance is likely to maintain its early-year heady pace. Data releases are on the lighter side. Kindly call the Member Services Desk for information on market dynamics, rate levels, or products.
Product Alert: FHLBNY is pleased to announce the reintroduction, after a temporary suspension owing to Libor-cessation, of the Putable Advance, Fixed-Rate with SOFR Cap Advance, and ARC with SOFR Cap/Floor Advance. The Callable Advance continues to be offered. This expansion of the product menu will provide members with more options and flexibility for the management of funding and/or hedging needs.
Forward Start Advance (FSA): For members with upcoming borrowing or refunding plans, consider the FSA as a method to opportunistically “lock in” rates before advance settlement date. Please contact the Member Services Desk at (212) 441-6600 for more information.
The Symmetrical Prepayment Advance Feature
For those anticipating term funding needs, and with rates on an uptrend, it can be an appropriate juncture to consider our SPA feature. This feature allows the member to capture, at prepayment, changes in the fair value of the advance which are favorable to the member. Contact Member Services Desk to discuss.
Looking for more information on the above topics? We’d love to speak with you!
Questions?
If you wish to receive the MSD Weekly Market Update in .pdf format (includes FHLBNY rate charts) or to discuss this content further, please email the MSD Team.