Member Services Desk
Weekly Market Update
This MSD Weekly Market Update reflects information for the week of June 21, 2021.
Economist Views
Click to expand the below image.
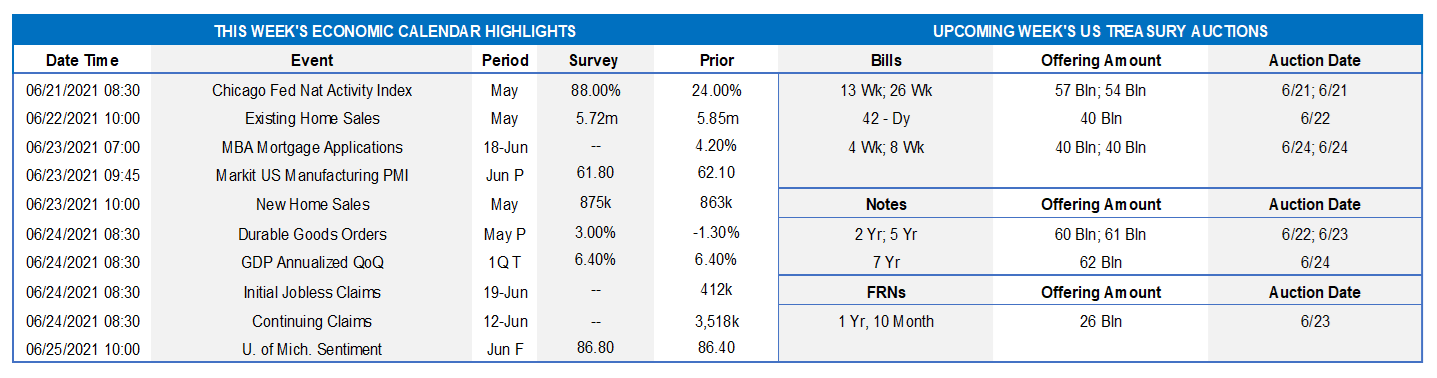
Existing Home Sales: Contract signings over the March-April span suggest that existing home sales probably declined by 1.9% to an 11-month low SAAR of 5.74mn in May. With the number of dwellings on the market likely dipping by 100K to 1.15mn during the reference period, the stock of unsold homes is expected to remain at 2.4 months’ supply.
New Home Sales: Last month’s reported pullback in single-family building permits suggests that new home sales likely dipped by .9% to a SAAR of 850K in May.
Durable Goods Orders: Paced by an anticipated pickup in transportation equipment bookings, durable goods orders probably climbed by 3% in May, more than offsetting the 1.3% decline posted in April. May’s nondefense capital goods shipments excluding commercial jetliner deliveries, which are expected to have risen by .7%, will allow economists to fine-tune their projections for the contribution of business equipment spending to Q2 real GDP growth.
Gross Domestic Product: The Bureau of Economic Analysis’ final estimate of real GDP growth during the winter quarter is expected to remain at 6.4%.
Jobless Claims: Initial and continuing claims under regular state unemployment insurance programs likely moved lower during their latest respective reporting periods. Those figures continue to camouflage the slow healing of the labor market from the healthcare crisis, however. Indeed, as of May 29, roughly 14.8mn persons were still receiving some sort of assistance, down from the pandemic peak of 32.4mn reached last June but well above the 2.1mn level before COVID-19 struck in March 2020.
Personal Income & Spending: Reflecting a further reduction in government transfer payments to individuals, personal income likely declined by 2.8% in May, after a 13.1% drop in the previous month. While the headline figure may appear weak, labor-market soundings point to yet another solid increase in wages and salaries after a pair of 1% gains in April and March. Consumer spending growth probably slowed during the reference period, rising by .3% following a .5% prior-month gain.
Federal Reserve Appearances:
- June 21: St. Louis Fed President Bullard to discuss the economic outlook at virtual event.
- June 22: Cleveland Fed President Mester to discuss monetary policy and financial stability at Norges Bank workshop.
- June 22: Fed Chair Powel to testify before a House select subcommittee on COVID-19 response and economy.
- June 23: Boston Fed President Rosengren to discuss economy at event hosted by the National Association of Corp Directors.
- June 24: Atlanta Fed President Bostic and Philadelphia Fed President Harker to take part in monetary policy panel discussion.
- June 24: New York Fed President Williams to take part in a moderated discussion hosted by the College of Staten Island.
- June 24: Federal Reserve to release bank stress test results.
Click to expand the below images.
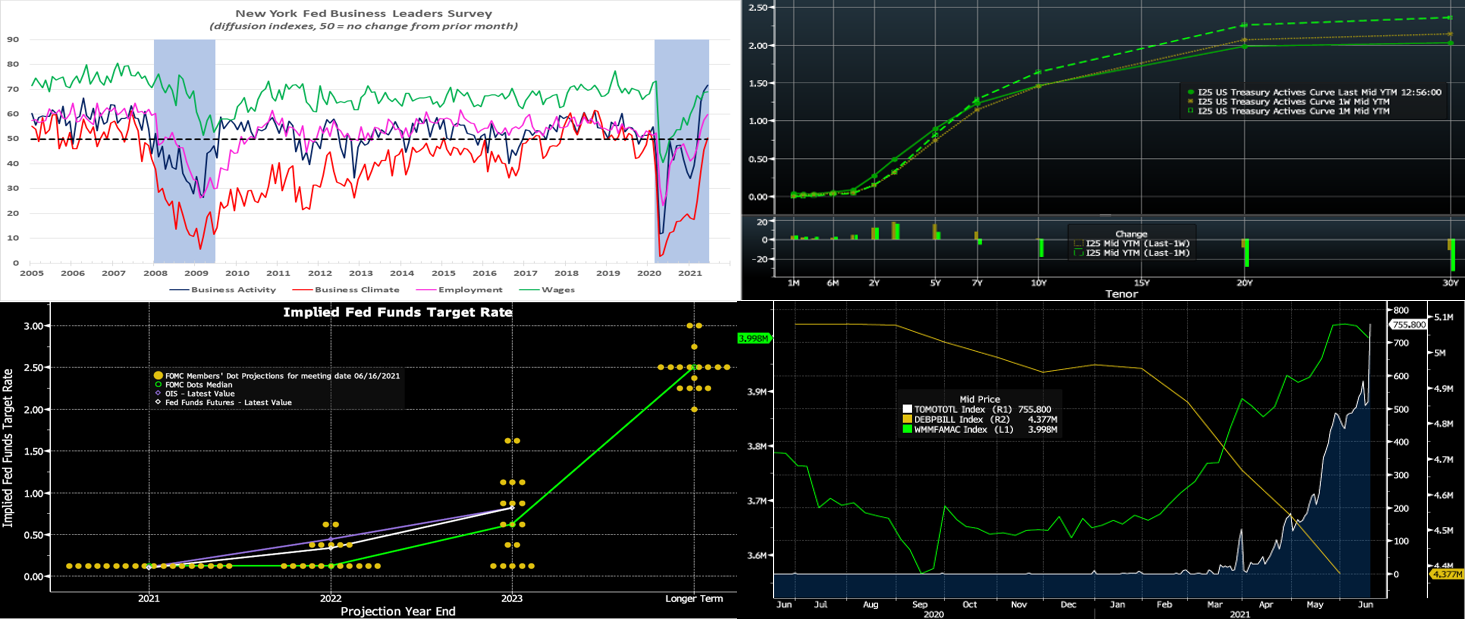
CHART 1 UPPER LEFT
Source: FRB NY; FHLBNY. The NY Fed’s Business Leaders Survey – a canvass of service-producing firms in the NY metro area– revealed that business activity grew at a record-setting pace in June. The headline business activity diffusion index – the percentage of respondents experiencing an improvement in current conditions less those witnessing a deterioration – climbed by 4.4 percentage points (ppts) to 43.2% – the highest reading since the survey’s inception. Reflecting the positive impact of expanding vaccinations and easing of social-contact restrictions, our current business conditions barometer – the percentage of respondents experiencing a rise in activity plus one-half those noting no change – rose by 2.2 ppts to an all-time peak of 71.6%. Our business climate gauge improved by 4.8 ppts to 50.5% during the reference period – the first reading above the 50% mark associated with a normal operating environment since January 2020. Surveyed firms added workers at a faster pace than in May, with reports of firms extending wage increases also expanding. Looking ahead, contacts continued to express widespread optimism about business prospects.
CHART 2 UPPER RIGHT
Source: Bloomberg. Note: top pane is yield (%), bottom pane is change (bps). The Fed this past week surprised with a mildly hawkish “mark to market” on itself, via acknowledging that inflation could rise faster than their prior expectations. Projections of the Fed Funds rate increased (see specifics below) and Chair Powell indicated that “talk of talking about tapering of asset purchases” had occurred. The market reaction was pronounced in a “reflation trade unwind”; significant curve flattening ensued, as the market priced the Fed to be less prone to “fall behind” on inflation forces, thereby leading to less term and inflation premium priced into longer maturities. The volatile markets also indicated sizable stop-outs of well-populated “steepener” trades. As of midday Friday, the 3-year UST was ~18 bps higher on the week, 5-year ~15, 10-year roughly unchanged, and 30-year ~10 bps lower. The upcoming week will determine if the market reaction has been overdone, and participants will monitor economic data and especially “Fed-speak” for fresh clues on the direction of rates.
CHART 3 LOWER LEFT
Source: Bloomberg. Depicted here is the Fed’s fresh “Dot plot” of Fed Funds rate projections. Most notably, the median dot for 2023 now reflects two 25 bp hikes, up from none in the last projection in March. Moreover, 13 of 18 participants now expect a hike by then. Somewhat on the hawkish side as well are the ‘22 dots, where now 7 participants expect a hike, up from 4 in March (the median expectation is still for no hikes). It appears that the Fed would like to hold the option of a hike in late 2022, if conditions warrant. In turn, this stance suggests that the start of the tapering process may not be far away and as soon as this autumn.
CHART 4 LOWER RIGHT
Source: Bloomberg. Shown here are the Fed’s RRP balance (RHS-1, white, $bn), Government-only Money Market Fund (“MMF”) AUM (LHS, green, $trn), and current US T-bills outstanding (RHS-2, gold, $trn). A fundamental driver of low money market rates has been the steady increase of cash in the system (via Fed asset purchases, stimulus plans, Fed drawdown on the TGA) and concomitant increase in MMF AUM, while, concurrently, the stock of short-maturity assets such as T-bills has been on the decline. The Fed’s increase in the RRP rate this week from 0 to .05% (note that IOER was also hiked to .15% from .10%), was designed to manage the Fed Funds rate and somewhat address these dynamics. The RRP rate increase spurred a spike of usage to a fresh daily record of ~$756bn on June 17th.
FHLBNY Advance Rates Observations
Front-End Rates
- Short-end Advance rates finished 2 bps higher week-over-week. The catalyst for the move higher was the Fed’s 5 bp increase in the RRP rate which served to influence all short-end rates upwards. Moreover, Money Market Funds’ AUM declined by ~$27bn on the week, somewhat sapping demand for paper, albeit some of that decline may have been funds going directly to the RRP post the rate adjustment. The overall paradigm persists, however, as the GSEs continue to invest larger sums into money markets, and the US TGA continues its decline. In a more recent development, state and local governments are receiving federal disbursements from the most recent relief bill and are parking funds in short-term investment “placeholders”. For any members experiencing such municipal deposit inflows, consider our Refundable Municipal Letter of Credit product; please call the Member Services Desk to discuss.
- UST issuance overall is now net positive supply in that more is being issued than what the Fed is buying in its programs. However, with short UST rates at rock-bottom levels and the Fed on hold for a long period, rates are likely to persist in a near-term sideways pattern. Importantly, weekly net T-bill issuance has been lower since 2020 and negative in recent months, and Treasury intends to shift issuance out the curve. Further legislative packages and related borrowing may lead to an eventual increase of T-bill auction sizes and positive net supply, but for now overall market supply/demand dynamics should keep short rates in check from large moves to the upside.
Term Rates
- On the week, medium and longer-term Advance rates exhibited a notable curve flattening. While the 3-year was ~16 bp and 5-year ~15 bp higher week-over-week, the 10-year finished ~2 bp lower. Kindly refer to the previous section for further color on relevant market dynamics.
- The upcoming week brings heavy and record-high UST term supply in the form of the Treasury’s quarterly refunding of 3/10/30-year notes. This supply is likely the reason for the curve to modestly steepen towards the end of the week. Treasury also announced its plans to lengthen the maturity profile of its issuance via more longer–term issuance and less T-bills. Attention will remain on further relief legislation and certainly also on COVID-19 and the question of whether or not it is being managed effectively enough to avoid further pauses in reopening. A key data highlight will be the jobless claims release and its trends.
New Product Alert: In order to satisfy member needs and provide greater product flexibility to match bond and derivative market conventions, FHLB-NY now offers SOFR-linked advances based on SOFR-index compounding. Note that this product is in addition to SOFR-linked advances based on SOFR-index averaging which have been offered since November 2018.
The Symmetrical Prepayment Advance Feature
With rates at or near multi-year lows, it is a compelling juncture to use the SPA feature on term advances. This feature allows member to capture, at prepayment, changes in the Fair Value of the advance which are favorable to the member. Contact us to discuss.
Looking for more information on the above topics? We’d love to speak with you!
Questions?
If you wish to receive the MSD Weekly Market Update in .pdf format (includes FHLBNY rate charts) or to discuss this content further, please email the
MSD Team.
Special Member Alert
The FHLBNY recently announced a newly expanded and flexible Disaster Relief Funding (DRF) advance program which offers discounted rate advances with maturities 1-mo and greater. Additionally, we have announced that PPP loans will be accepted as eligible collateral. Please contact us with any questions.