Member Services Desk
Weekly Market Update
This MSD Weekly Market Update reflects information for the week ending June 9, 2023.
Economist Views
Click to expand the below image.
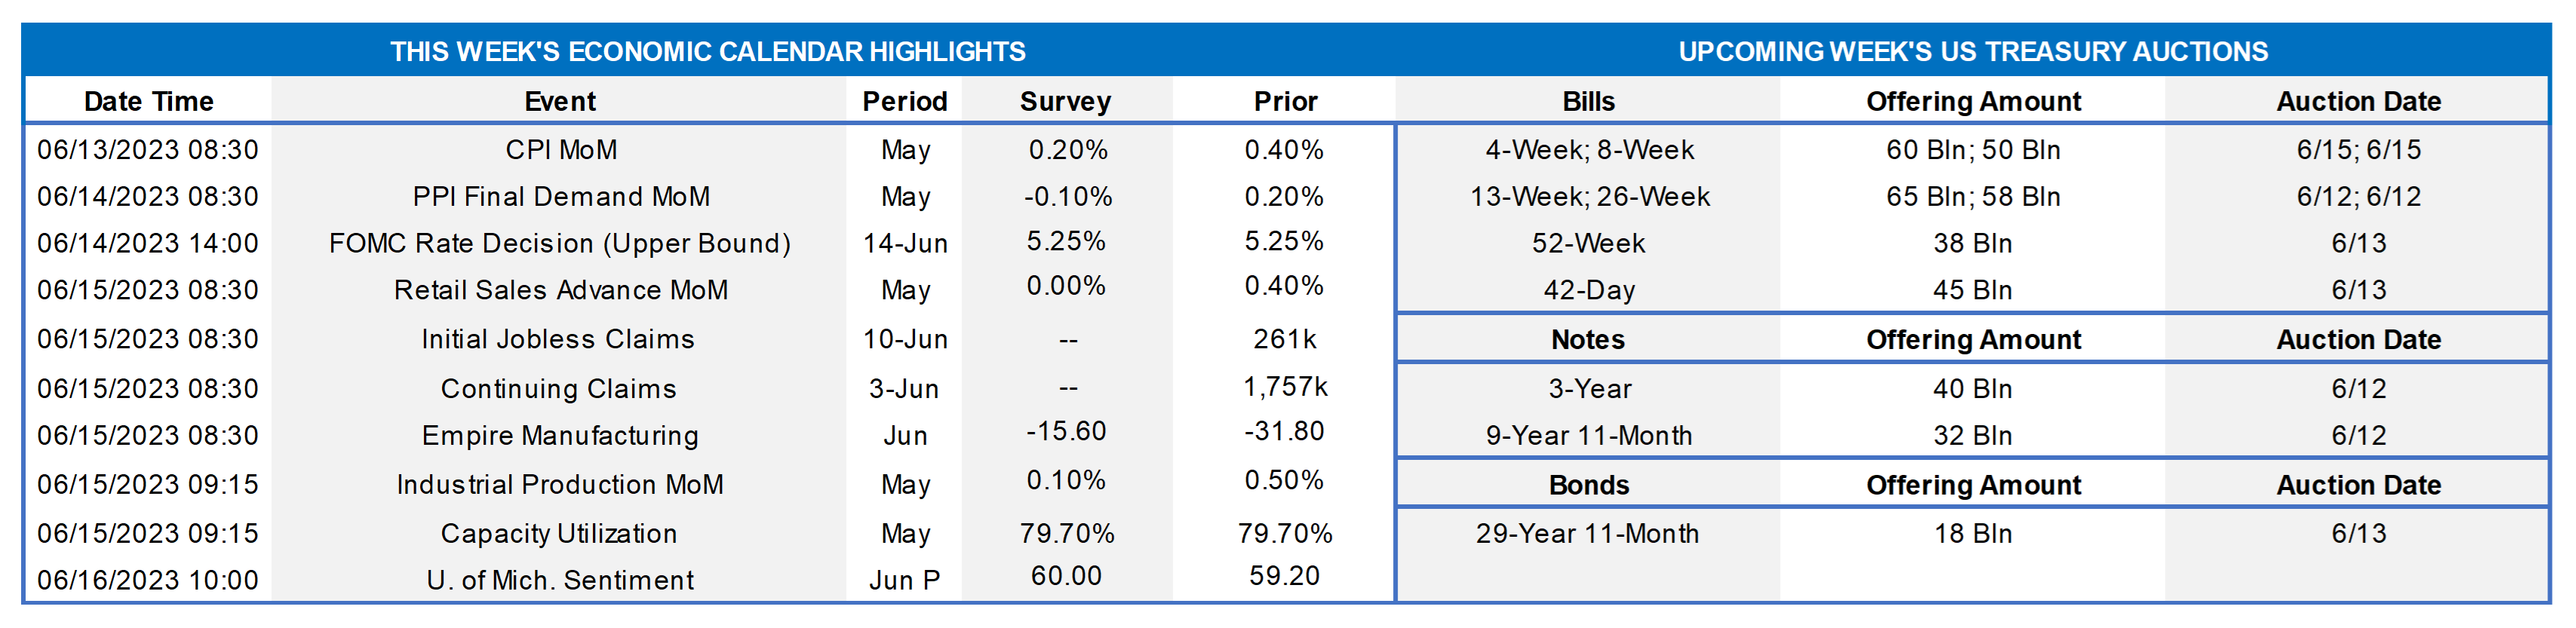
The Federal Open Market Committee (FOMC) meeting will be the marquee event. The FOMC is expected to leave the target range for the federal funds rate unaltered at 5% to 5¼%. The post-meeting communiqué likely will reiterate that economic activity continues to expand at a modest pace, job gains have been robust, and the unemployment rate has remained low. Echoing the statement issued after their May FOMC, policymakers probably will highlight that the banking system is sound and resilient, although tighter credit conditions for households and businesses likely will weigh on economic activity, hiring, and inflation. While the FOMC remains highly attentive to inflation risks, the previous communiqué removed the forward guidance that some additional firming may be appropriate to attain a stance of monetary policy that is sufficiently restrictive to return inflation to 2% over time. Depending on the results of the consumer inflation report for May to be released Tuesday, forward guidance could be reintroduced, thereby raising market expectations of a resumption of rate increases in late July. The FOMC will continue to reduce its holdings of UST and agency debt and agency MBS. As per convention, the Fed will release an updated Summary of Economic Projections, or SEP. With the federal funds rate target already at policymakers’ median year-end 2023 projection in the March SEP, the so-called “dot plot” will be watched very closely for any changes to their expectations over the year-end 2023-2025 horizon.
Consumer Prices: Capped by lower retail energy costs, the Consumer Price Index (CPI) likely climbed by .2% in May after a .4% increase in April. While the core CPI excluding volatile food and energy items is expected to have risen .4% for a third straight month, available figures on used vehicle prices and apartment rental rates hint that the risks may lie to the downside of that forecast. The Street’s estimates, if realized, would place the overall and core CPIs 4.2% and 5.3% above their respective year-ago levels – both still well above Federal Reserve’s desired 2% target.
Retail & Food Services Sales: Capped by an anticipated pullback in auto-dealer revenues, sales probably held steady in May, following a .4% gain in April. Excluding the projected falloff in auto sales, retail purchases are expected to have climbed by .2%, building on the .4% prior-month rise. Market participants will pay attention to so-called “control” sales excluding auto, building materials and gas purchases for clues to consumer spending as the spring quarter progresses. Barring any prior-month revisions, the .3% increase projected by the Street would place core purchases over the April-May span 1.8% annualized above their January-March average, after a 5.8% annualized winter-quarter gain.
Jobless Claims: Initial claims for unemployment benefits likely returned to the 225-235K range that prevailed before the week, including Memorial Day. Keep an eye on continuing claims for signs that furloughed employees may be having a tougher time finding work.
Empire State Manufacturing Survey: Manufacturing activity in New York State probably ebbed once again in June but at a slower pace than in May. The general business conditions diffusion index – the percentage of survey respondents experiencing a rise in activity less those witnessing a decline – is expected to improve to -16% from -31.8% in the previous month.
Industrial Production & Capacity Utilization: Output at the Nation’s factories, mines, and utilities is expected to have expanded by just .1% last month, after a .5% gain in April. With additions to productive capacity expected to match output during the reference period, the overall operating rate probably held steady at 79.7%.
Michigan Consumer Sentiment Index: Rosier appraisals of economic conditions probably propelled the U of M’s consumer confidence gauge to 61 in early June from 59.2% in the preceding month.
Federal Reserve Appearances: June 14: FOMC monetary policy announcement; Federal Reserve Chair Jerome Powell to hold a press conference following FOMC meeting.
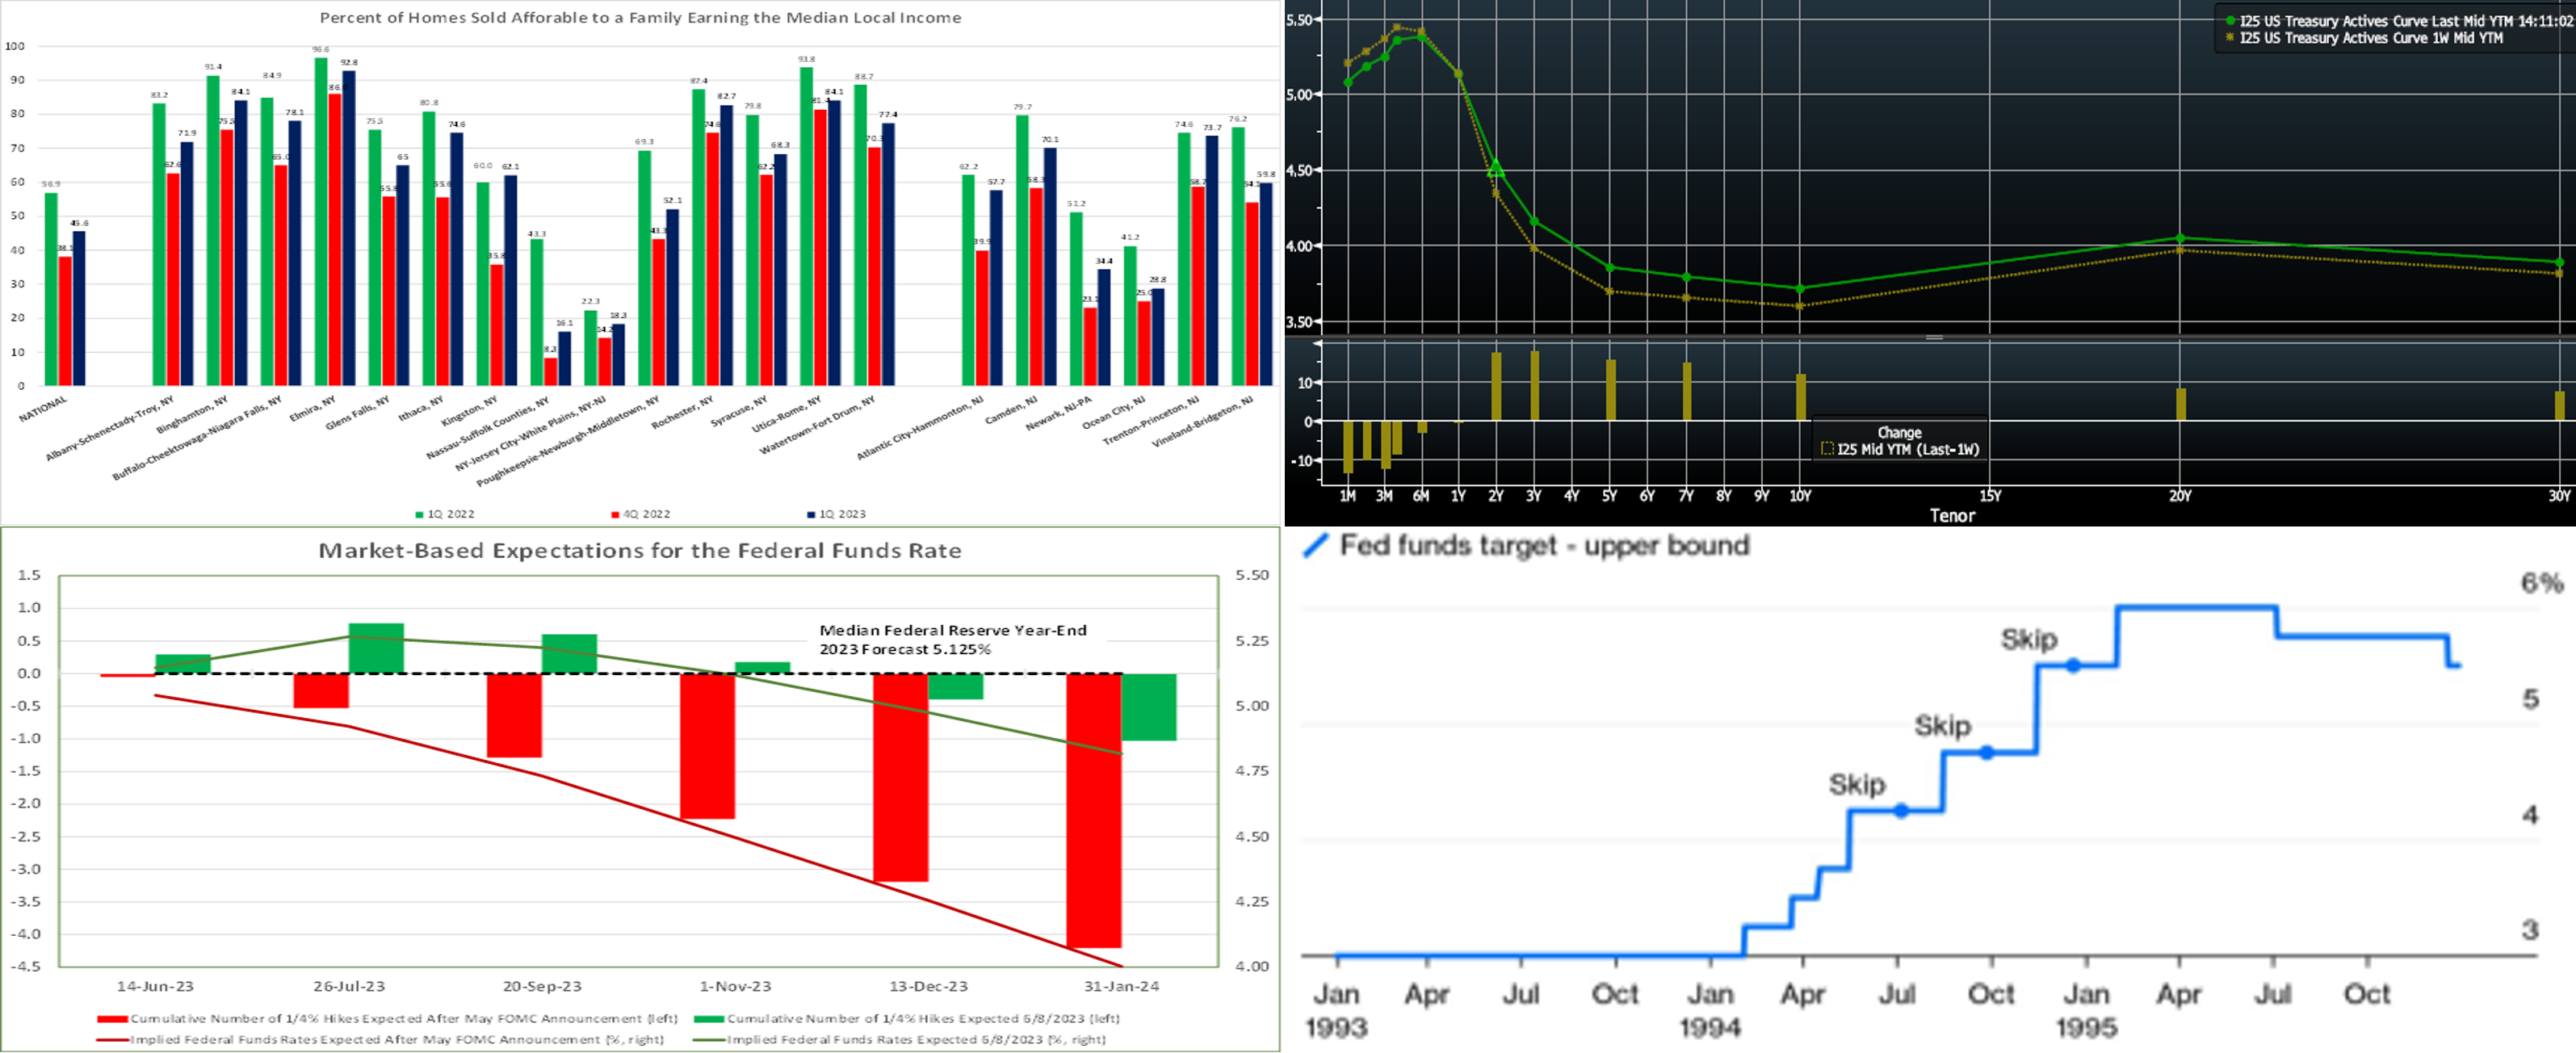
CHART 1 UPPER LEFT
Source: NAHB/Wells Fargo; FHLB-NY. Housing affordability improved across the Nation and within the FHLB-NY district during Q1 2023. The NAHB/Wells Fargo Housing Opportunity Index (HOI) for a given area is defined as the share of homes sold that would have been affordable to a family earning the local median income based on standard mortgage underwriting criteria. In all, 45.6% of new and existing homes sold from the beginning of January and end of March were affordable to families earning the median income of $96.3K. This is up from 38.1% posted in Q4 2022, the lowest level since tracking of affordability began on a consistent basis in 2012. However, the Q1 HOI reading remains significantly lower than the 56.9% witnessed a year ago, a reminder of ongoing affordability challenges. Opportunity improved markedly across segments of the FHLB-NY area, with the average HOI climbing by 9.6 ppts to 61.8%. Despite that gain, the mean HOI in the district remained well below the 73.3% witnessed a year ago. Housing opportunity in our district during Q1 2023 ranged from a high of 92.8% in Elmira, NY, to a low of just 16.1% across Nassau and Suffolk counties, NY.
CHART 2 UPPER RIGHT
Source: Bloomberg. Top pane is yield (LHS, %), bottom pane is change (bps). From last Thursday afternoon to this one, UST term yields finished higher and flatter, with 2 to 5-year yields up by ~10 to 16 bps. The debt ceiling agreement of late last week, along with the stronger-than-expected jobs data last Friday, inspired some of the move. As of this Thursday afternoon’s writing, the market prices the odds of a 25 bps hike at the looming June 14th FOMC at ~33%. The cumulative probability of a 25 bp hike for the July 27th FOMC is ~82%. Conversely, the market is pricing in ~57% probability of a 25 bps cut for the November 1 FOMC. The year-end Fed Funds forward is ~5%, ~15 bps higher than a week ago. Please call the Member Services Desk for further information on market dynamics and/or products.
CHART 3 LOWER LEFT
Source: Bloomberg; FHLB-NY. Shown here, and illuminating the above color, is the current (green) market-implied Fed Funds rate expectations (LHS is number of cumulative 25 bps moves, RHS is rate, both derived from Fed Funds futures and swaps) compared to just after the May FOMC (red). Clearly there has been a shift higher. After the May FOMC, there was a slight chance of an ease priced for the June meeting! Two weeks ago, a ~70% chance of a hike was implied for the June meeting. As of this writing Thursday afternoon, the probability of a hike has dipped to ~33%. For the rest of 2023, the market has notably retraced its previous pricing of Fed cuts, as Fedspeak and economic data evolved to make nearer-term cuts a more improbable Fed path. The market eagerly awaits the upcoming meeting for not only the rate decision but also the fresh “dot plot” and any related forward guidance.
CHART 4 LOWER RIGHT
Source: Bloomberg. Will the Fed hike or pause? Will it be a “hawkish pause”? We will find out on June 14th. But the case for a “hawkish pause” or a “skip ‘n’ hike” pattern unfolding is not without precedent. As seen here, during the Greenspan Fed of the mid-90’s, the Fed repeatedly skipped meetings and then subsequently hiked rates. Perhaps as an omen, this past Wednesday, the Bank of Canada surprised the markets with a 25 bps hike after three successive pauses/skips; US yields rose in sympathy on this news. Either way, and given current market pricing, rates are likely to move on the upcoming FOMC outcome; as we highlighted last week, market pricing for this meeting has been “all over the place” in the past six weeks.
FHLBNY Advance Rates Observations
Front-End Rates
- Short-end rates are 3 to 10 bps lower from a week ago, led by the shorter tenors. In prior weeks, the debt ceiling issue pressured T-bill yields higher which, in turn, dragged ours and other short-end rates higher too. But the debt ceiling agreement of late last week brought relief and allowed short-tenor yields to subside over this past week. Net T-bill supply will remain robust as Treasury rebuilds its account post-debt ceiling agreement; thus far, it has been absorbed without heavy impacts, as Money Market Funds are expected to switch from the Fed’s RRP to the Treasury’s new 6-week-and-in offerings with slightly higher yields.
- The June 14th FOMC outcome will undoubtedly be the prime driver of rates this upcoming week. Please see the previous section for color on Fed pricing.
Term Rates
- The longer-term curve bears flattened from last week, generally mirroring moves in USTs and swaps. While 1-year was up ~7 bps, the 2 to 10-year sector was ~10 to 15 bps higher in flattening fashion. Kindly refer to the previous section for relevant market color. The advance curve remains inverted out to 5-year, thereby offering opportunities to extend in advance duration at lower coupon cost.
- On the UST term supply front, this upcoming week serves 3, 10, and 30-year auctions. While there is a plethora of economic data releases on tap, the FOMC will be the week’s focus. Please contact the Member Services Desk for further information on market dynamics, rate levels, or products.
Product Alert: FHLBNY is pleased to announce the reintroduction, after a temporary suspension owing to Libor-cessation, of the Putable Advance, Fixed-Rate with SOFR Cap Advance, and ARC with SOFR Cap/Floor Advance. The Callable Advance continues to be offered. This expansion of the product menu will provide members with more options and flexibility for the management of funding and/or hedging needs.
Forward Start Advance (FSA): For members with upcoming borrowing or refunding plans, consider the FSA as a method to opportunistically “lock in” rates before advance settlement date. Please contact the Member Services Desk at (212) 441-6600 for more information.
The Symmetrical Prepayment Advance Feature
For those anticipating term funding needs, and with rates on an uptrend, it can be an appropriate juncture to consider our SPA feature. This feature allows the member to capture, at prepayment, changes in the fair value of the advance which are favorable to the member. Contact Member Services Desk to discuss.
Looking for more information on the above topics? We’d love to speak with you!
Questions?
If you wish to receive the MSD Weekly Market Update in .pdf format (includes FHLBNY rate charts) or to discuss this content further, please email the MSD Team.