Member Services Desk
Weekly Market Update
Economist Views
Click to expand the below image.
The Federal Open Market Committee meeting and announcement on Wednesday, November 3 will be the marquee event of the week. While policymakers are universally expected to leave the federal funds rate target range unaltered at 0 to ¼%, predictions are widespread that a tapering of the current pace of Treasury and agency mortgage‑backed securities purchases of $120bn per month will be announced to begin as soon as mid-November. Market participants will also contend with a very crowded economic release calendar. Canvasses of manufacturing and service-producing activity conducted by the Institute for Supply Management likely will reveal that activity accelerated at the beginning of the fall quarter. Motor vehicle purchases probably moved higher for the first time since April. Hiring likely reaccelerated last month, leaving the civilian jobless rate at a new pandemic low.
Construction Spending: The nominal value of new construction put-in-place is expected to have risen by .5% in September, following no change in the preceding month. With government statisticians assuming a pullback in such outlays in their first pass at Q3 real GDP growth, such a result would point to a potential modest upward revision.
ISM Manufacturing Index: Factory activity probably expanded for a 17th straight month in October. Available Federal Reserve bank surveys suggest that the Institute for Supply Management’s Purchasing Managers Index likely climbed to 63% – the highest level since March.
Motor Vehicle Sales: Industry watchers expect unit motor vehicle sales to rise for the first time in six months from the seasonally adjusted annual rate of 12.2mn posted in September. While new-vehicle purchases are still facing constraints from limited deliveries to dealerships, strong consumer demand and a lack of inventory is leading to record selling prices and profit for each unit sold.
ADP National Employment Report: ADP Employer Service’s update on private sector hiring in October could color expectations heading into the official government report on Friday. The Street expects 400K net new jobs to be created, after a 568K jump in September. Given last month’s sizable miss from the Bureau of Labor Statistics’ 317K count, ADP’s September estimate could be marked lower in this report.
ISM Services Index: District Federal Reserve Bank surveys suggest that the ISM’s service-producing activity gauge climbed to an all-time high of 66.5% in October from 61.9% in the preceding month.
Jobless Claims: Initial and continuing claims under regular state unemployment insurance programs likely remained on downtrends during their latest respective reporting periods. The termination of pandemic-related jobless benefits suggests that the total number of persons receiving assistance will also decline further during the week ended October 16 from the 2.83mn, or 1.8% of the civilian labor force, recorded in the prior week.
Employment Situation Report: Declines in both initial and continuing unemployment insurance claims since the September establishment survey period suggest that nonfarm payrolls probably expanded by 650K in October, after a comparatively modest 194K rise in the prior month. The dramatic decline in the state insured unemployment rate over the latest four weeks, combined with historically upbeat consumer appraisals of labor market conditions, hints that the civilian jobless rate may have moved below the 4.5% mark. Given the current sensitivity to inflation soundings, average hourly earnings will undoubtedly receive considerable scrutiny in this week’s report.
Federal Reserve: Nov. 3 Federal Reserve Chairman Jerome Powell to hold press conference following FOMC meeting.
Click to expand the below images.
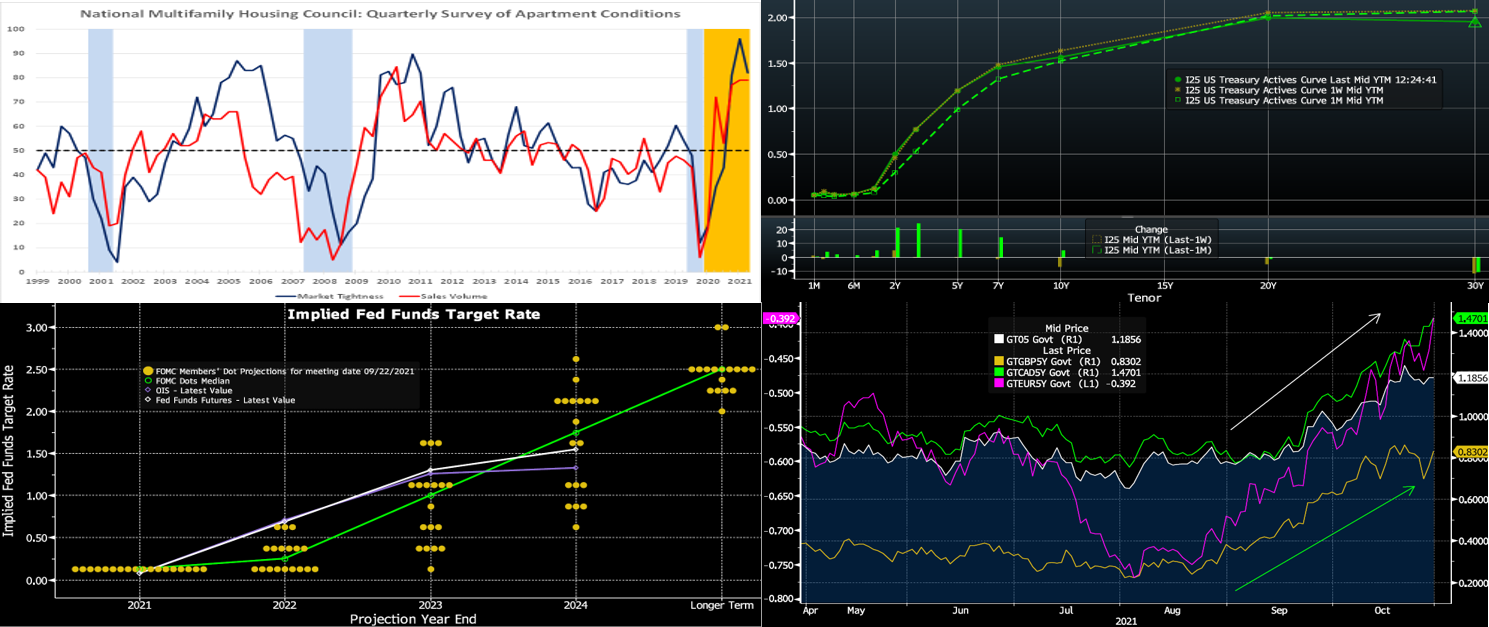
CHART 1 UPPERLEFT
Source: NMHC, NBER, FHLBNY. Notes: Diffusion indexes are calculated by taking half the difference between positive and negative responses and adding 50. A reading above 50 indicates that apartment markets are tightening and sales volumes increasing across the country. Blue-shaded areas denote recessions; orange-shaded area highlights the current economic expansion. The NMHC’s Quarterly Survey of Apartment Market Conditions for October portrayed continued improvement. The Market Tightness Index decreased from 96 to 82, indicating that market conditions became tighter, albeit by a lesser amount than during the spring quarter; 71% of respondents reported tighter market conditions than three months earlier, compared to only 8% who reported looser conditions. Signaling continued strength, the Sales Volume Index remained unchanged at a historically lofty 79. Of note, more than half (61%) of respondents reported higher sales volume than in April, while 32% felt they were unchanged. According to the NMHC, demand for apartments remains strong and broad-based across the country, as the economic expansion continues. Sunbelt markets are evidently experiencing historic levels of occupancy and rent growth, while most urban, coastal areas have returned to or even surpassed pre-pandemic levels.
CHART 2 UPPERRIGHT
Source: Bloomberg. Note: Top pane is yield (%), bottom pane is change (bps). As of midday Friday, the UST curve again finished flatter week-over-week. The curve out to 5-year was modestly changed. Note that while the chart depicts 2-year as ~3.5 bps higher, this change really portrays the higher yield of the newly auctioned 2-year UST which is a longer maturity than the previous “on-the-run” security. Longer end yields finished ~6 to 10 bps lower, with the 30-year leading that move. Action has been volatile; indeed, yields had traded several bps higher Friday morning before subsiding again. The curve flattening appears to be driven by the market‘s belief that the Fed will counter and contain the longer-term inflation threat via a taper announcement this upcoming week or by mid-December and thereby “kick off” a removal of accommodation and application of rate hikes later next year. Adding to the flattening dynamic have been stop-outs by frequent-trading-players of short-end long and/or curve steepener positions, while demand for the very long end from real money investors, such as pension funds, has also lent support to the flattening theme.
CHART 3 LOWER LEFT
Source: Bloomberg. Focus will be keenly trained on the FOMC this week. As seen here, the markets price for a Fed Funds rate of ~.67% (LHS, %) at the end of 2022. Given that current Fed Funds trades at ~.08%, this market pricing implies well over 2 hikes of 25 bps by the end of next year. This pricing is significantly higher than that of just a month ago. Notably, the pricing for end-2022 is now above all (and well above the median) Fed member projections from the Fed’s last “Dot Plot”. After the last FOMC, the market had priced more in sympathy with the dovish set of projections, and so this move is significant. The Fed has not “pushed back” against this change in market pricing, perhaps indicating that a taper is sure to be announced this week.
CHART 4 LOWERRIGHT
Source: Bloomberg. The recalibration of central bank tightening expectations has not been isolated to the U.S. Indeed, global 5-year government bond yields have all markedly risen in the past six weeks. Depicted is US (RHS, %, white), UK (RHS, %, tan), Canada (RHS, %, green), and EUR (LHS, %, fuchsia). Global bond markets can move in sympathy, given many large investors participate across markets. And the supply chain-driven inflation dynamic is definitively a global one.
FHLBNY Advance Rates Observations
Front-End Rates
Short-end Advance rates finished a bp higher on the week. The debt ceiling issue has essentially been pushed off to December, but this issue, and the T-bill curve kinks it has caused, have not materially impacted our rates. Demand for short paper and the Fed’s RRP, which hit a record $1.6trn a few weeks ago and stands last ~$1.5trn, remains strong. The Fed acknowledged this dynamic at the last FOMC, as they raised the RRP counterparty limit to $160bn from $80bn. The overall supply/demand paradigm persists in suppressing rate levels, as the GSEs continue to invest large sums into money markets, the TGA has declined, Fed purchases instill funds to the banking system, and short-maturity paper is in low supply.
UST issuance overall is now net positive supply in that more is being issued than what the Fed is buying in its programs. However, with short UST rates at rock-bottom levels and the Fed on hold, rates are likely to persist in a near-term sideways pattern. Importantly, weekly net T-bill issuance has been lower since 2020 and negative for months, and Treasury intends to shift issuance out the curve. T-bills are likely to experience a near-term issuance uptick on some “catch-up” issuance from the debt ceiling issue slowdown, but this uptick should not alter the overall money markets picture. Further legislative packages and related borrowing may lead to an eventual increase of T-bill auction sizes and positive net supply, but for now overall market supply/demand dynamics should keep short rates in check from large moves to the upside.
Term Rates
The Advance rate curve bull flattened on the week. While 1 to 4-year was relatively unchanged, the 5 to 10-year sector was ~5 to 8 bps lower, led by the 10-year point. Kindly refer to the previous section for further color on relevant market dynamics.
On the UST supply front, this week brings a reprieve in auctions. The past week’s 2/5/7-year auctions experienced strong demand, as some investors may believe the curve, at this point, is more than “fairly priced” for Fed hikes. The market will closely monitor this week’s FOMC (Wednesday announcement), legislative developments, and jobs data (Friday) for market direction.
New Product Alert: FHLBNY is pleased to announce the launch of the Business Development Advance (BDA) on Thursday, November 4, 2021. The BDA is a 0% advance to help our members provide funding to qualifying small businesses to promote community & economic growth. The BDA is subsidized funding in the form of interest-rate credits. There is a total of $3 million of interest-rate credits available in 2021. Members can request to reserve their interest-rate credits up to $50,000 on a first-come/first-served basis. For further details, please see our BDA overview page, attend this Thursday’s BDA webinar, and/or contact the Member Service Desk at 1-800-546-5101 option 1.
New Product Alert: In order to satisfy member needs and provide greater product flexibility to match bond and derivative market conventions, FHLB-NY now offers SOFR-linked advances based on SOFR-index compounding. Note that this product is in addition to SOFR-linked advances based on SOFR-index averaging which have been offered since November 2018.
The Symmetrical Prepayment Advance Feature
With rates at or near multi-year lows, it is a compelling juncture to use the SPA feature on term advances. This feature allows member to capture, at prepayment, changes in the Fair Value of the advance which are favorable to the member. Contact us to discuss.
Looking for more information on the above topics? We’d love to speak with you!
Questions?
If you wish to receive the MSD Weekly Market Update in .pdf format (includes FHLBNY rate charts) or to discuss this content further, please email the MSD Team.