Member Services Desk
Weekly Market Update
Economist Views
Click to expand the below image.
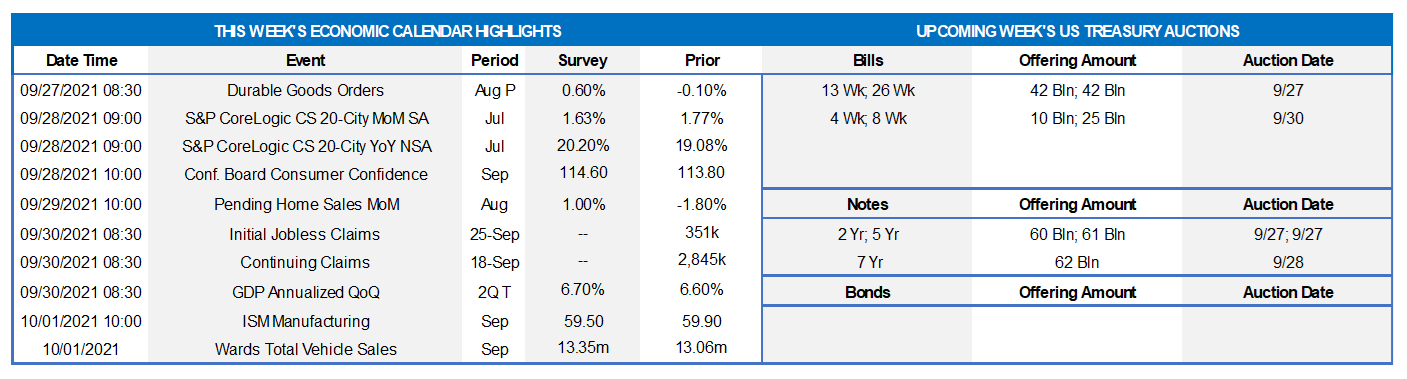
With the latest FOMC meeting in the rear-view mirror, market participants will weather a storm of public appearances by policymakers this week. Of note, the House Financial Services Committee will hold a hearing on the Fed and Treasury Department responses to the pandemic. As of this writing, the list of witnesses has not been published, but Fed Chair Powell and Treasury Secretary Yellen have appeared in the past. New York Fed President Williams’ discussion of the outlook before the Economic Club of NY will also be watched closely. The remaining appearances will center on not only the economic outlook and monetary policy but also a variety of other timely topics. Next week’s slate of economic reports is expected to be positive. Durable goods orders and pending home sales probably moved slightly higher in August. Home-selling prices likely remained on a tear at the beginning of the summer. Consumer confidence is expected to recover in September, after the surprisingly large drop suffered in August. The nationwide manufacturing expansion probably continued, with the pace of growth accelerating from the prior month’s clip.
Durable Goods Orders: Durable goods orders are expected to have risen by .6% in August, following a modest .1% dip the previous month. Excluding a modest dip in transport requisitions, “hard goods” bookings are expected to have edged .5% higher, boosting the cumulative rise since February to 7.7%. Last month’s nondefense capital goods shipments excluding commercial jetliner deliveries will be watched closely for clues to the contribution of business equipment spending to Q3 real GDP growth.
S&P CoreLogic Case-Shiller (SPCLCS) 20-City Home Price Index: Home prices probably continued apace in July across the twenty major metropolitan areas canvassed by SPCLCS. Indeed, the 1.8% increase anticipated by the Street, after a similar rise in June, would place home selling prices a record 20.3% above their year-ago level.
Conference Board Consumer Confidence: Weekly sentiment soundings suggest that this gauge climbed to 120 in September from 113.8 the previous month. Focus on the so-called labor differential – the percentage of survey respondents feeling that jobs are plentiful is less than those believing they are hard to get – for clues to the likely change in the civilian unemployment rate in September.
Pending Home Sales: Still constrained by the lack of homes on the market, contract signings probably climbed by 1% in August, reversing a little over half of the 1.8% decline recorded in July. That estimate, if realized, would be consistent with a .3% dip in existing home sales to a seasonally adjusted annual rate of 5.86mn in the National Association of Realtors’ September report.
Real GDP: Data released since the Bureau of Economic Analysis’ preliminary report suggest that spring-quarter growth may be boosted slightly from the previously estimated 6.6% annualized pace.
Personal Income & Spending: Personal income likely edged .2% higher in August, following the government childcare-led 1.1% jump posted in July. By contrast, nominal consumer spending is expected to have quickened during the reference period, rising by .6% after a .3% prior-month advance.
ISM Manufacturing Index: Factory activity likely expanded for a 16th straight month in September. Available Federal Reserve bank surveys hint that the Institute for Supply Management’s Purchasing Managers Index likely rose slightly to 60.5% from 59.9% in the previous month.
Federal Reserve
- Sept. 27 Chicago Fed President Evans to speak at National Association for Business Economics (NABE) annual meeting.
- Sept. 27 New York Fed President Williams to discuss the economic outlook before the Economic Club of New York.
- Sept. 28 Atlanta Fed President Raphael Bostic to discuss the economic outlook at a virtual banking conference.
- Sept. 30 House Financial Services Committee hearing on Federal Reserve and Treasury Dept. responses to the pandemic.
Click to expand the below images.
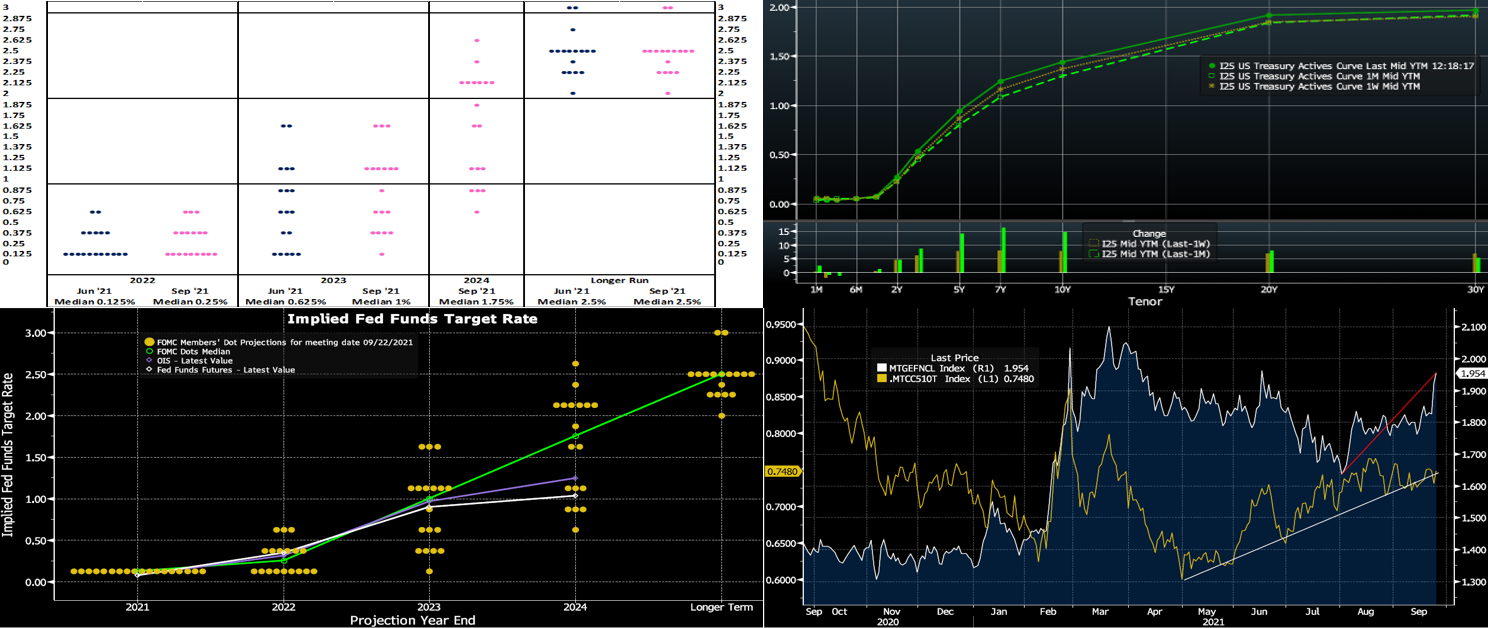
CHART 1 UPPER LEFT
Source: Federal Reserve Board; FHLB-NY. While the Federal Open Market Committee’s indication that a moderation in the pace of asset purchases may be on the next meeting docket received considerable attention, the updated Summary of Economic Projections, or SEP, contained significant changes to policymakers’ outlooks for the federal funds rate target. The so-called “dot plot” revealed that Fed officials are now equally split over whether the initial hike in administered rates will occur by the end of next year. The median forecast for yearend 2023 was boosted from .625% to 1%, while the first pass for 2024 anticipated additional increases to 1.75%. Fed officials continue to believe that a median nominal federal funds rate of 2.5% will be appropriate over the longer run.
CHART 2 UPPER RIGHT
Source: Bloomberg. Note: Top pane is yield (%), bottom pane is change (bps). UST yields finished higher week-over-week, as of midday Friday, led by the belly of the curve. While the 2-year was ~4bps higher, the 5 to 10-year sector traded ~7-8 bps higher and the 20 to 30-year sector closed ~6 bps higher. Most of the moves occurred mid to late-week after the keenly anticipated FOMC meeting. Although jobless claims were higher than expected, other economic data was generally positive and lent support as well to higher yields. The FOMC outcome was dubbed “mildly hawkish” by some market strategists. While no immediate changes or major surprises were announced, the Fed revealed that the taper process is likely to be announced in November and to end in mid-2023; the revelation of the taper’s end date was a few months sooner than market expectations and thereby contributed to the upward move in yields. To conclude, by mid-2021, the taper would essentially require monthly Fed purchase reductions of $10bn USTs and $5bn MBS. Nonetheless, the market has been expecting the taper process, and UST supply is expected to moderate in the months ahead which should offset some of the supply/demand impact of the taper. This week’s UST auctions should prove a timely test of investor demand post the FOMC outcome.
CHART 3 LOWER LEFT
Source: Bloomberg. Turning back to the Fed’s “dot plot”, here we can gauge market pricing/sentiment as compared to the Fed members’ projections. From the OIS and Fed Funds futures curves, it is evident that the market is pricing for a lower, relative to the Fed’s median, Fed Funds rate in the “out years” of 2023 and 2024. In essence, the market is pricing more in alignment with the “core dove members” of the Fed who forecast lower policy rates in the years ahead. The market is likely also factoring in the history of recent hiking cycles which were interrupted, therefore rates failed to eventually reach previous forecasts or yield curve-implied levels.
CHART 4 LOWER RIGHT
Source: Bloomberg. Depicted here is the Agency MBS Current Coupon (computed yield of a par-priced security, RHS, %) and the Current Coupon’s spread (LHS, %) to the average of the UST 5 and 10-year yields. The latter has trended higher in recent months towards levels of late winter. Meanwhile, the rise in yields of the past week (and since last month), in tandem with the wider spread, has pushed the former to the highs of recent months. This development may afford a welcome opportunity to buy securities for those in high-cash positions and/or looking to deploy funds.
FHLBNY Advance Rates Observations
Front-End Rates
Short-end advance rates finished unchanged to a bp lower on the week. Money Market Funds’ AUM increased by a sizable ~$51bn this past week. Demand for short paper and the Fed’s RRP, which stands ~$1.3trn, remains strong, and this increase in MMF AUM will only add to the demand. The Fed acknowledged this dynamic at the past week’s FOMC, as they raised the RRP counterparty limit to $160bn from $80bn. The overall supply/demand paradigm persists in suppressing rate levels, as the GSEs continue to invest large sums into money markets, the TGA continues its decline, Fed purchases instill funds to the banking system, and short-maturity paper is in low supply.
UST issuance overall is now net positive supply in that more is being issued than what the Fed is buying in its programs. However, with short UST rates at rock-bottom levels and the Fed on hold, rates are likely to persist in a near-term sideways pattern. Importantly, weekly net T-bill issuance has been lower since 2020 and negative for months, and Treasury intends to shift issuance out the curve. Moreover, the looming federal debt ceiling may further constrain issuance. Further legislative packages and related borrowing may lead to an eventual increase of T-bill auction sizes and positive net supply, but for now overall market supply/demand dynamics should keep short rates in check from large moves to the upside.
Term Rates
The Advance rate curve finished higher on the week, led by the belly. While 1 and 2-year were ~2 and 4 bps higher, the 5 and 10-year were ~9 and 8 bps higher. Kindly refer to the previous section for further color on relevant market dynamics.
On the UST supply front, this week brings 2/5/7-year auctions; these auctions should prove a timely test of post-FOMC investor demand/sentiment. The market will monitor economic data and pandemic developments. Corporate issuance will continue to add supply to the market but at a lesser pace than that of early September.
Product Enhancement Alert: FHLBNY this past week announced an enhancement to the Callable Adjustable Rate Credit Advance (“Callable ARC”). The product features a 1-time call/cancel option (member’s option) to extinguish funding early at no cost via two distinct option structures, thereby giving members flexibility in meeting the demands of a fluctuating balance sheet. Given the shorter-term nature of the current borrowing environment, the minimum term for the Callable ARC has been lowered to 4-month (from the previous 7-month) for our 1-month-left-to-maturity call option (SOFR or 1-month Libor index available) to better meet our members’ needs. Meanwhile, the 3-year Non-Call 2-year product for SOFR continues to be offered to members for their longer-term needs.
New Product Alert: In order to satisfy member needs and provide greater product flexibility to match bond and derivative market conventions, FHLB-NY now offers SOFR-linked advances based on SOFR-index compounding. Note that this product is in addition to SOFR-linked advances based on SOFR-index averaging which have been offered since November 2018.
The Symmetrical Prepayment Advance Feature
With rates at or near multi-year lows, it is a compelling juncture to use the SPA feature on term advances. This feature allows member to capture, at prepayment, changes in the Fair Value of the advance which are favorable to the member. Contact us to discuss.
Looking for more information on the above topics? We’d love to speak with you!
Questions?
If you wish to receive the MSD Weekly Market Update in .pdf format (includes FHLBNY rate charts) or to discuss this content further, please email the MSD Team.
Special Member Alert
The FHLBNY recently announced a newly expanded and flexible Disaster Relief Funding (DRF) advance program which offers discounted rate advances with maturities 1-mo and greater. Additionally, we have announced that PPP loans will be accepted as eligible collateral. Please contact us with any questions.