Member Services Desk
Weekly Market Update
This MSD Weekly Market Update reflects information for the week of October 26, 2020.
Economist Views
Click to expand the below image.
With Federal Reserve officials observing the traditional blackout period ahead of the November 4-5 FOMC meeting, the focus of market participants will fall squarely on economic reports this week. Head and shoulders above the rest, the Bureau of Economic Analysis’ (BEA) advance estimate of real GDP growth during the summer will undoubtedly receive the most attention. While a wide range of projections persists as of this writing, most appear to be centered near an annualized jump of 32.0%, after the 31.4% dive posted in Q2. If that forecast and the current consensus expectation of a further 4.0% rise in Q4 are on the mark, real GDP would end the year 3.3% below its Q4 2019 level, suggesting that a full recovery of the output lost to the pandemic will not occur until the latter half of 2021.
New Home Sales: Reported jumps in single-family building permits and housing starts suggest that the consensus call for a 1.4% rise in new home sales to a seasonally adjusted annual rate of 1.025mn in September is likely too low. A more likely outcome near 1.1mn dwellings would place contract signings at the highest level since April 2006 prior to the Great Recession.
Durable Goods Orders: Durable goods bookings are expected to have edged 0.6% higher in September, following a similarly modest 0.6% rise in August. Particular attention should be paid to non-defense capital goods shipments excluding jetliner deliveries, in this report. This key input into the BEA’s estimate of business equipment spending in real GDP probably rose last month after a 1.5% increase in August.
Conference Board Consumer Confidence: Early month readings from the University of Michigan point to a Conference Board sentiment figure near 103.0 in October, up from 101.8 in the previous month. While likely improving over the latest two months, consumer confidence would remain well below the 131.5 average that prevailed before the COVID-19 crisis.
Jobless Claims: Online inquiries on how to apply for unemployment insurance benefits suggest that initial claims probably moved lower to 750K during the period ended October 25 from 787K in the past week. Any prospective decline would still leave new filings well above the 233K average that prevailed before the COVID-19 crisis began in late March, however.
Pending Home Sales: Home-purchase contract signings likely remained on an uptrend in September. The 3.0% median increase anticipated by the Street would place the National Association of Realtors’ Pending Home Sales Index at 136.8 – 98.2% above the pandemic low of 69.0 posted in April. With pending home sales leading closings by one to two months, the consensus forecast would point to a 4.3% rise in existing home sales to a seasonally adjusted annual rate of 6.82mn in October – the highest level since March 2006.
Federal Reserve Appearances:
Oct. 28: Dallas Fed President Kaplan, a 2020 FOMC voter, to moderate a virtual panel discussion on global perspectives with former Bank of England Governor Mark Carney.
Click to expand the below images.
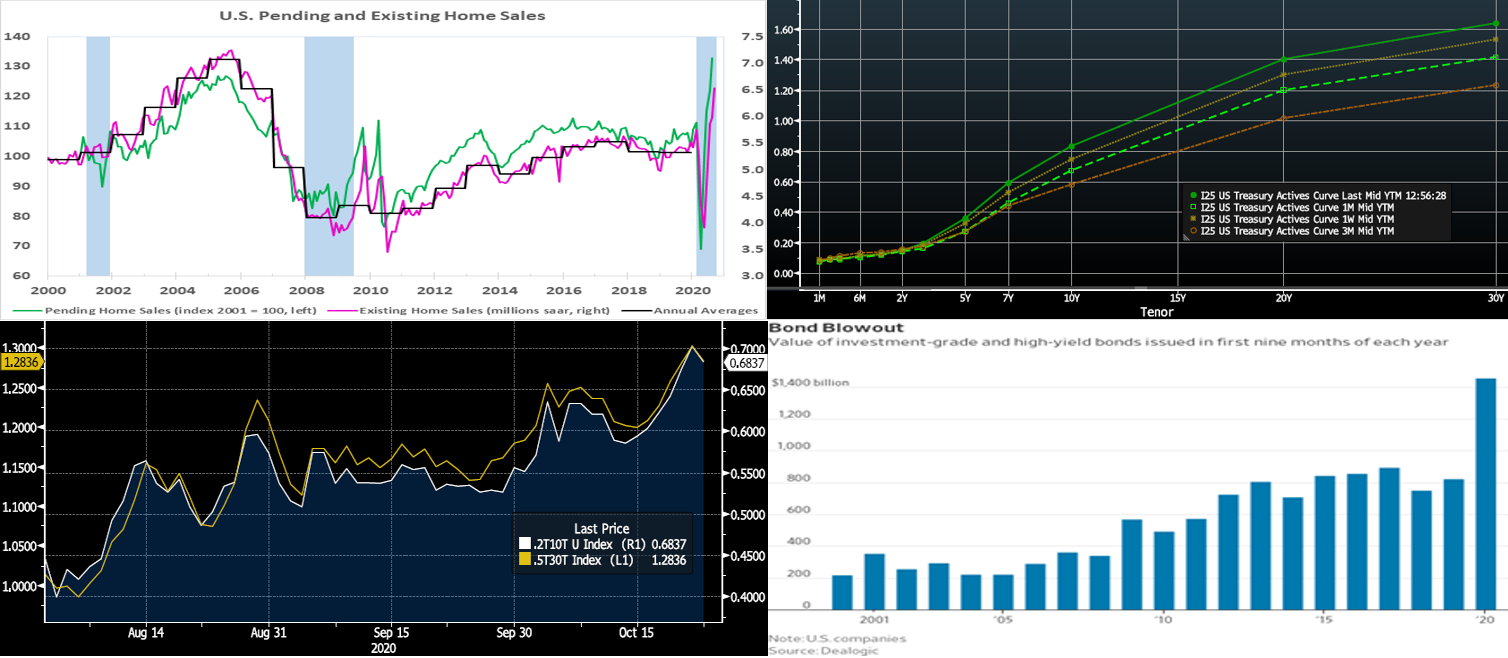
CHART 1 – UPPER LEFT
Source: National Association of Realtors; FHLB-NY. Tipped off by the recent surge in purchase-contract signings, existing home sales jumped by 9.4% to a SAAR of 6.54mn in September – the highest number of closings since March 2006. All areas of the country enjoyed sharp increases in resale activity during the reference period. Given that contract signings lag closings by one to two months, additional gains likely are in store during the fall quarter. The inventory situation nationwide tightened further last month. The number of available dwellings on the market dipped by 0.8% to a record low 1.388mn after seasonal adjustment, while the months’ supply at the current sales pace moved lower to 2.55 months. The extremely tight demand/supply dynamic continues to put significant upward pressure on home selling prices. The average price increase in our region – 12.3% to $371.5K – while not the largest, it did eclipse the 11.6% average nationwide gain. Low rates continue to fuel this sector.
CHART 2 – UPPER RIGHT
Source: Bloomberg. The UST curve “bear steepened” this past week, with notable upward moves in longer maturity yields. The Fed’s guidance and programs have served to pin the shorter maturities, and so again the longer end of the curve led the changes. While shorter maturity yields increased a few bps, the 5-year and longer sector increased 2 to 10 bps in progressive fashion out the curve. Prompts for the move were better economic data, a potential albeit “in limbo” status of an additional near-term fiscal relief package, perceived greater fiscal action upon any potential federal governmental changeover, and expectations of increased UST supply ahead.
CHART 3 – LOWER LEFT
Source: Bloomberg. Here is an isolated snapshot of the UST 2-year/10-year and 5-year/30-year yield curve slopes (in %). Following on the previously cited color and as the economy has seemingly exited the depths of the crisis, the curve has notably steepened in the past few months. The 2-year/10-year slope (RHS) and that for 5-year/30-year (LHS) has increased ~30bps since early August. Indeed, the latter is at its steepest level in four years.
CHART 4 – LOWER RIGHT
Source: Dealogic; WSJ. In addition to UST supply pressures, another contributor to recent yield curve steepening has been the historic and record amount of corporate bond issuance in recent months. As evident here, this issuance has dwarfed that of prior years. Sizable amounts of bonds have been issued in longer maturities, as companies strove to secure historically low rates.
FHLBNY Advance Rates Observations
Front-End Rates
Short-end advance rates generally finished 1bps lower week-over-week. Heavy T-bill issuance was a feature, as usual, but net supply has been slowing and thereby allowing for easier market absorption. Continuing a recent trend, money market funds experienced ~$6.2bn of outflow on the week. Overall market supply of short paper has moderated in recent months, however, thereby somewhat blunting the impact of these investor outflows.
Heavy T-Bill issuance will remain a theme; UST issuance overall is now net positive supply in that more is being issued than what the Fed is buying in its programs, and so this scenario could prove a small challenge. However, with short UST rates at rock-bottom levels, and the Fed likely on hold for a long period, rates may trade in a sideways pattern. Net T-bill issuance has been lower since mid-summer, and Treasury has announced plans to shift issuance out the curve, but a new fiscal relief package may complicate/alter this forecast.
Term Rates
Medium and longer-term advance rates were 2 to 10 bps higher on the week, in a “bull steepening” shift that served to more than reverse the prior week’s move. Rates 5-year and shorter generally remain pinned in a narrow range, and so again it was the portion of the curve past 5-year that led the week’s change. Please refer to the previous section for further color on the market moves.
Rates trade at historically low levels across the yield curve, and the curve is priced for the Fed to be on hold for several years. If suitable or sensible from an ALM perspective, it may be worthwhile to consider extending liabilities and locking in term rates. Note that the impending election has the potential to spur further moves in the curve and rates. Please call the Member Services Desk to discuss rate levels and potential ideas.
This week features 2/5/7-year UST auctions. Corporate issuance should add yet again to its historic record pace. Attention will remain on the prospects of further relief legislation and certainly also on COVID-19 developments.
The Symmetrical Prepayment Advance Feature
With rates at or near multi-year lows, it is a compelling juncture to use the SPA feature on term advances. This feature allows member to capture, at prepayment, changes in the Fair Value of the advance which are favorable to the member. Contact us to discuss.
Looking for more information on the above topics? We’d love to speak with you!
Questions?
If you wish to receive the MSD Weekly Market Update in .pdf format (includes FHLBNY rate charts) or to discuss this content further, please email the
MSD Team.
Special Member Alert
The FHLBNY recently announced a newly expanded and flexible Disaster Relief Funding (DRF) advance program which offers discounted rate advances with maturities 1-mo and greater. Additionally, we have announced that PPP loans will be accepted as eligible collateral. Please contact us with any questions.