Member Services Desk
Weekly Market Update
This MSD Weekly Market Update reflects information for the week ending May 5, 2023.
Economist Views
Click to expand the below image.
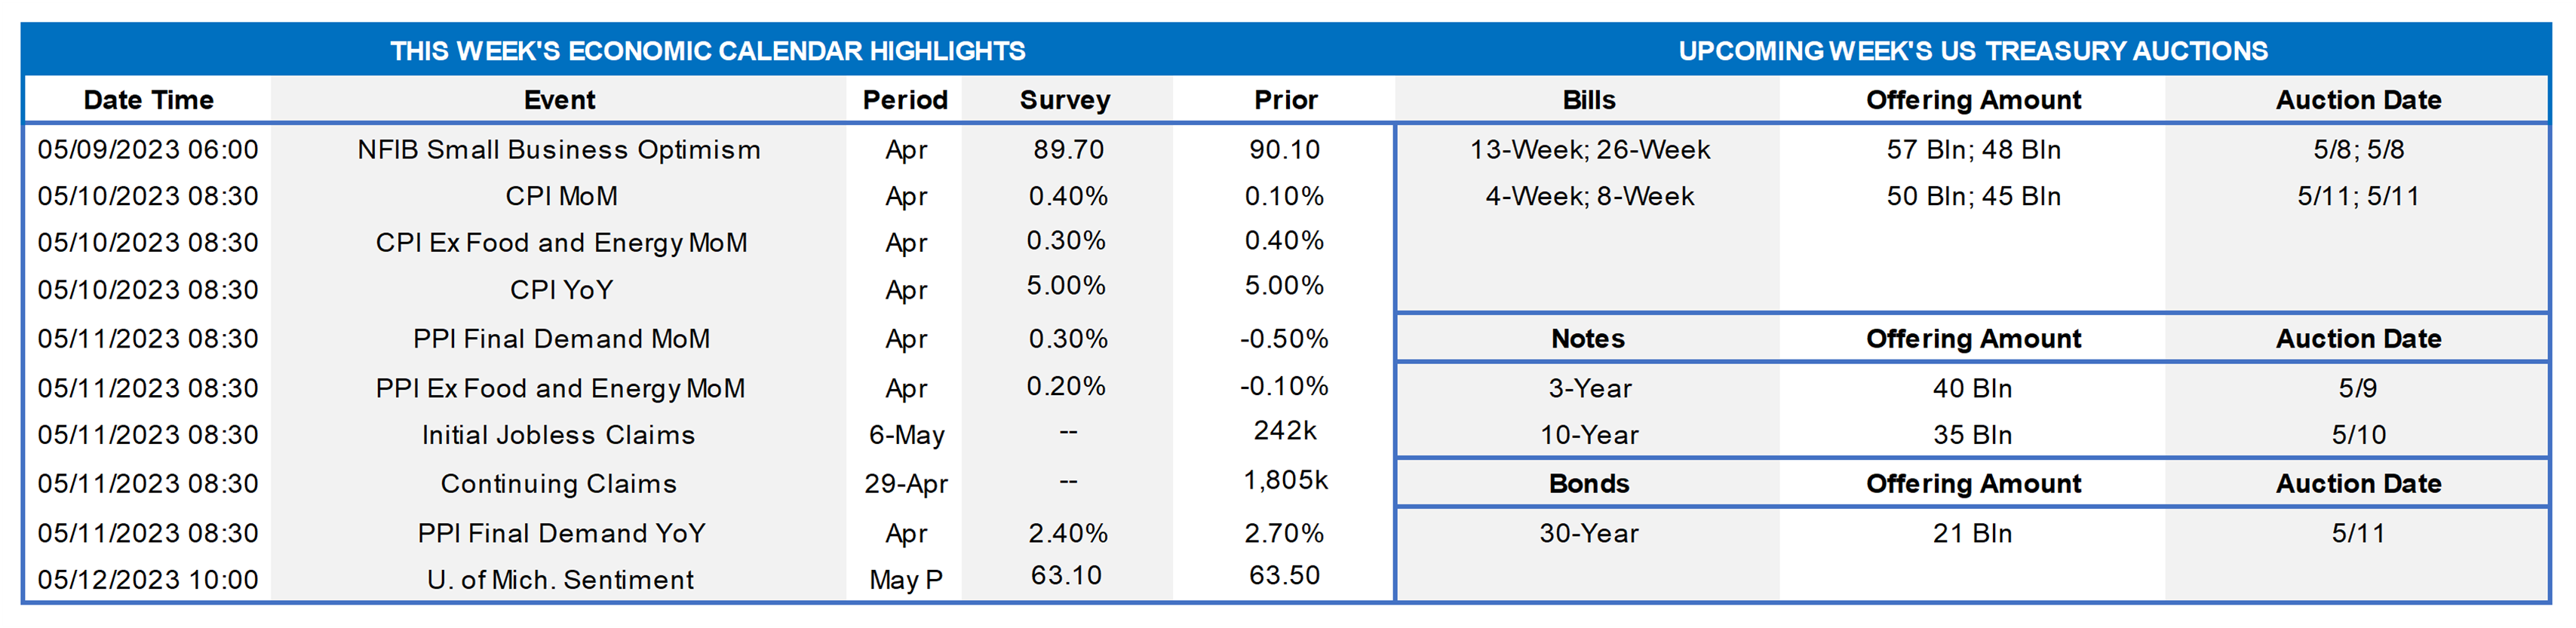
With the Federal Open Market Committee (FOMC) removing forward guidance biased toward additional tightening from its communiqué post this past Wednesday’s meeting, the attention of market participants will be squarely on the economic release calendar. Although assessments of the appropriate stance of monetary policy are now data dependent, statistical agencies will be offering relatively thin gruel this week. The Bureau of Labor Statistics update on consumer prices last month will undoubtedly be the most closely watched report this upcoming week. Little progress is expected in returning the overall and core inflation measures to policymakers’ desired 2% target. Updated counts of initial and continuing jobless claims will shed light on labor-market conditions beyond the survey period for the April employment report. Public appearances by a trio of Federal Reserve officials may provide useful color on FOMC meeting participants’ thoughts on the prospective path of monetary policy.
NFIB Small Business Optimism Index: Echoing the reported modest improvements in larger-firm sentiment surveys in April, the National Federation of Independent Business’ optimism gauge probably rose from the 90.1 reading recorded in March.
Consumer Prices: Buoyed by anticipated increases in retail energy costs, the Consumer Price Index (CPI) likely climbed by .4% in April after a modest .1% uptick in the preceding month. Excluding projected movements in volatile food and energy prices, the so-called core CPI probably rose by .3%, following a .4% uptick in March. The projected April increases, if realized, would leave the overall and core CPIs 5% and 5.4% above their respective year-ago level, well above the Federal Reserve’s 2% goal.
Jobless Claims: Initial claims for unemployment benefits likely remained within their recent 230-250K range during the filing period ended May 6. Keep an eye on continuing claims for evidence that furloughed employees may be having a tougher time finding work.
Producer Prices: Broad-based increases in wholesale goods and services costs probably propelled the Producer Price Index (PPI) for final demand .3% higher in April, reversing a little over half of the .5% decline witnessed in March. Despite the anticipated April rebound, the year-to-year growth of the headline PPI is projected to slow to 2.4% from 2.7% in the previous month.
University of Michigan Sentiment Index: Consumers’ appraisals of current and prospective economic conditions probably were little changed in early May, thereby leaving the University of Michigan’s confidence gauge near the 63.5 reading posted in April.
Federal Reserve Appearances:
- May 9 New York Fed President John Williams to address the Economic Club of New York.
- May 12 Fed Governor Jefferson and St. Louis Fed President Bullard take part in a panel discussion on monetary policy.
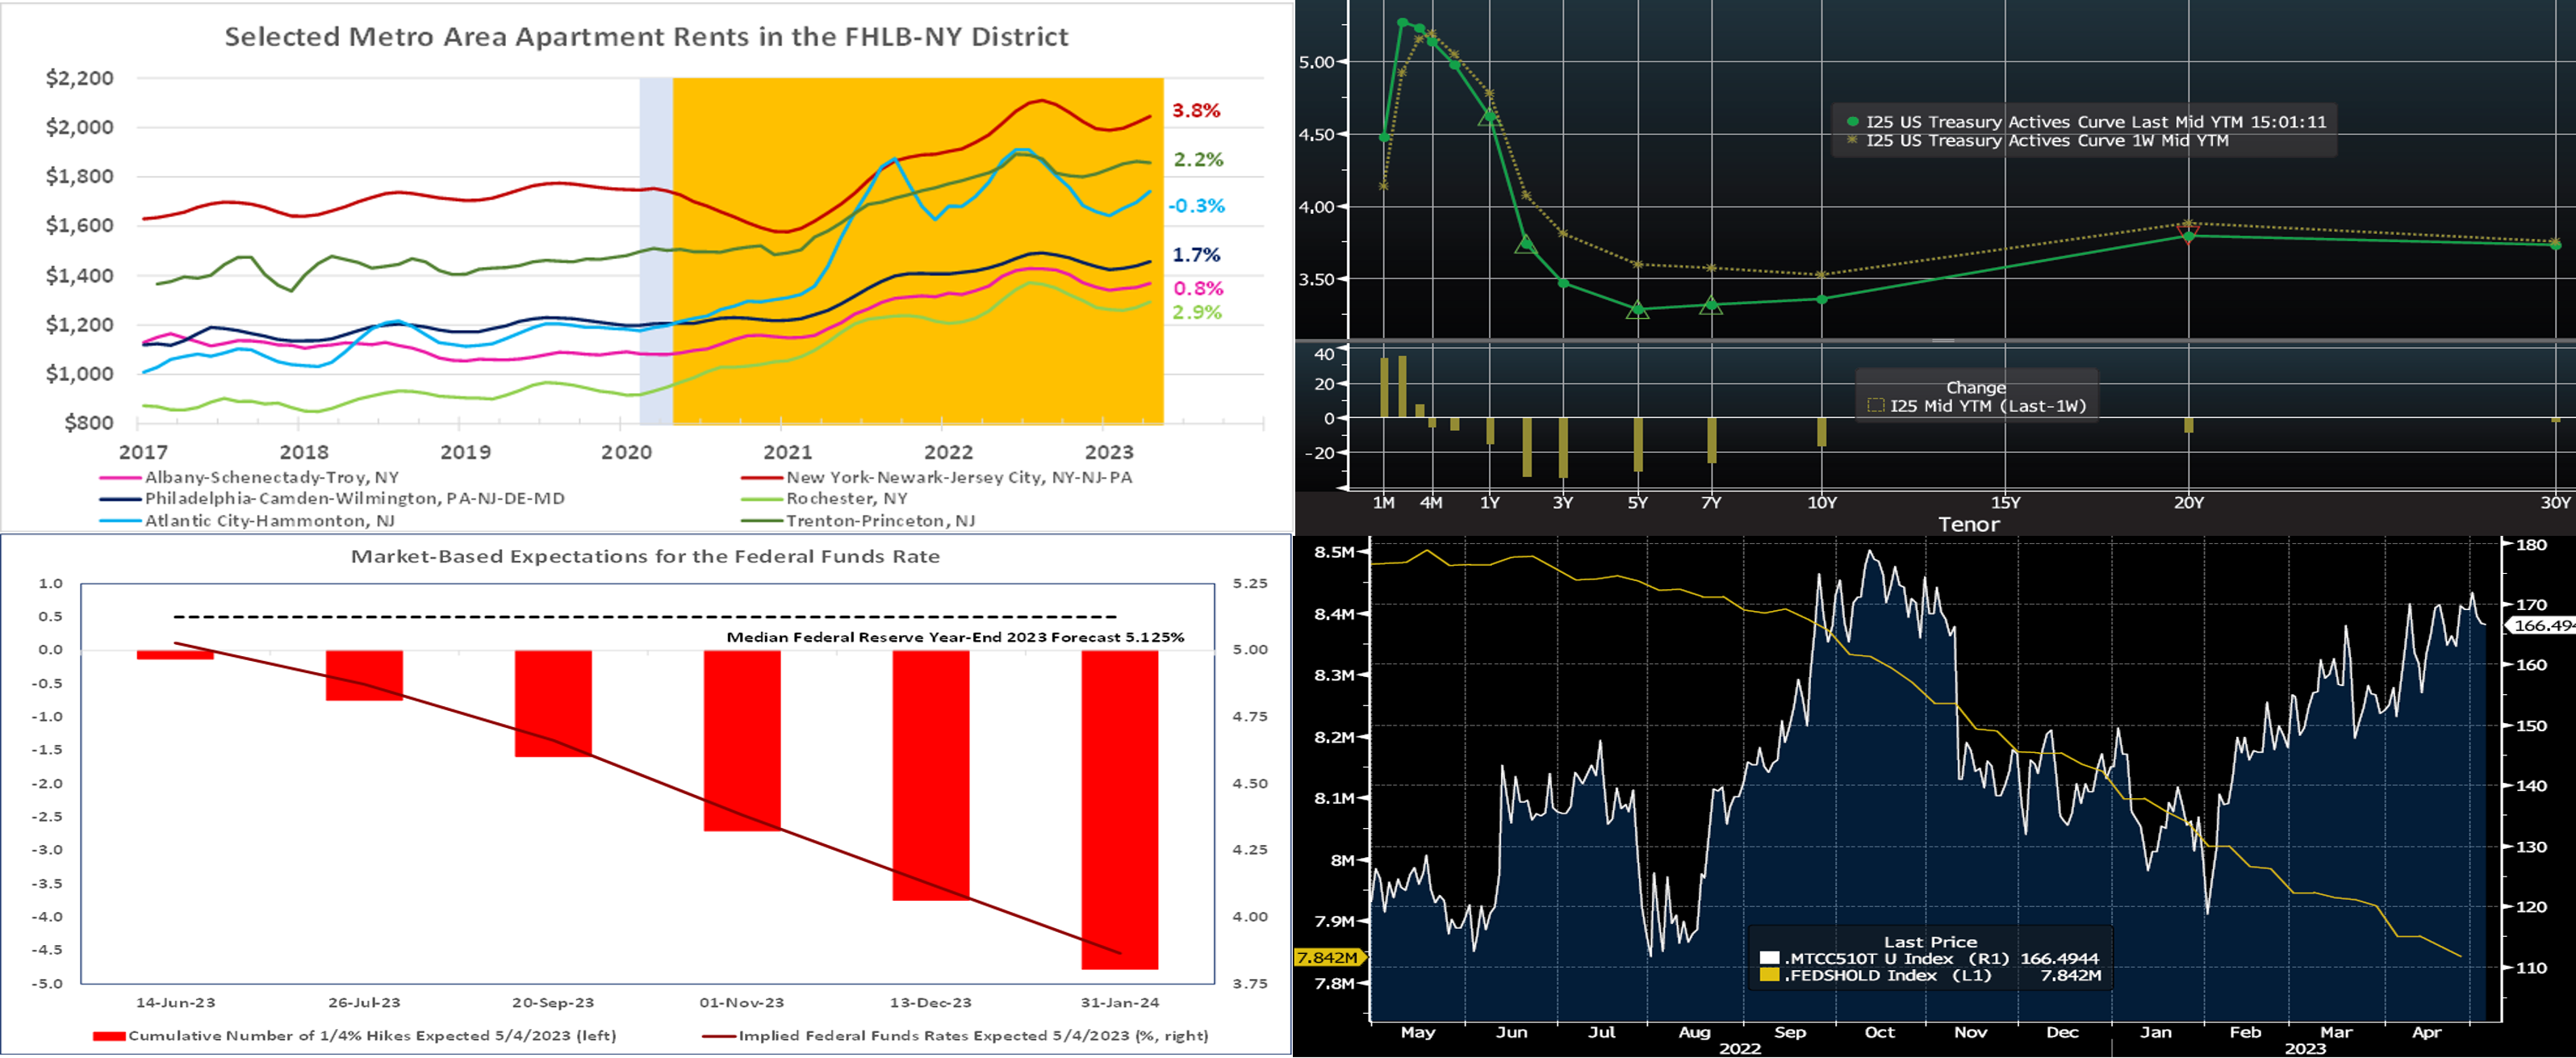
CHART 1 UPPER LEFT
Source: Apartmentlist.com; National Bureau of Economic Research; FHLBNY. Notes: Blue-shaded areas denote recession, while orange-shaded highlights the current economic expansion; percentage changes are from April 2022. Apartment rents have been edging higher across selected metropolitan areas within the FHLB-NY district over the past three months, ranging from a 1.4% uptick in the Trenton-Princeton area to a 6.0% jump in the Atlantic City-Hammonton region. Running the available monthly rental data through widely used statistical programs reveals that the reported increases are most likely due to normal seasonal effects as the year progresses. Indeed, annual rental increases, which had been in doubled-digit territory at the beginning of last summer, have slowed to low single-digit clips across most of the highlighted areas.
CHART 2 UPPER RIGHT
Source: Bloomberg. Top pane is yield (LHS, %), bottom pane is change (bps). From last Thursday afternoon to this one, UST term yields were notably lower. The 2 to 5-year sector led the move and was ~30 to 33 bps lower week-on-week, as of this writing. While data continues to generally reflect some economic slowing and rising credit constraints, inflationary embers appear still present and job markets have remained relatively strong. Indeed, the Fed cited such a backdrop in its “neutral hike” this past Wednesday. But the market’s nerves appear frayed over lingering banking industry concerns and the potential for a contracting economic backdrop. Indeed, the market has now priced an earlier and more aggressive Fed cutting path. As of this Thursday afternoon’s writing, the market prices the odds of a 25 bps cut at the June 14th FOMC at ~12%, and it prices a cumulative 100% probability of a 25 bps cut by the end of summer. The year-end Fed Funds forward is ~4.155%, roughly 48 bps lower than last week! All is subject to change, especially post tomorrow’s jobs data. Please call the Member Services Desk for further information on market dynamics and/or products.
CHART 3 LOWER LEFT
Source: Bloomberg; FHLB-NY. Illuminating the color above, here is a view of the market’s current (Thursday afternoon) pricing, via Fed funds futures and swaps, of the prospective Fed policy path. As stated above, it is highly prone to change and will be the fulcrum driving changes in the yield curve.
CHART 4 LOWER RIGHT
Source: Bloomberg. While often less prominent relative to official rate moves, another outcome of the latest FOMC was that “QT,” the tapering/reduction of the Fed’s securities holdings, remains in place. The Fed’s portfolio has been “rolling off” (net reducing) UST holdings by up to $60bn/month, with Agency and Agency MBS rolling off at a pace of up to $35bn/month. Portrayed here (LHS, $trn, tan line) is the decline in the Fed’s UST and Agency/Agency MBS holdings over the past year; the portfolio currently sits at ~$7.84trn. Also shown is the 30-year Agency MBS Current Coupon (imputed yield of a par-priced bond) spread (RHS, bps, white line) to the 5-year/10-year UST yield average. Despite a low net-issuance MBS environment, QT has clearly pressured mortgage spreads wider. Further spread-widening pressure has been caused by bank portfolio reductions, initially as banks replaced securities with loans but in recent months also for cash liquidity purposes. Added to this mix is the FDIC now as a seller, as it unwinds securities portfolios of the banks it assumed. For those without liquidity or balance constraints, there may be opportunity to add bonds at historically attractive spread levels.
FHLBNY Advance Rates Observations
Front-End Rates
- Short-end rates out to 6-month were flat to 31 bps higher from a week ago, with the very short maturities leading the change in a flattening dynamic. Essentially, all maturity dates have now crossed over the timeline of the Fed’s expected hike of this past Wednesday. Meanwhile, the dynamic from last month of low supply vs. voracious demand in the short-end markets ebbed further over the course of the past week. The 6-month declined 2 bps week-on-week as the market more aggressively priced Fed cuts during Thursday’s session. Please see the previous section for color on Fed pricing.
- With the FOMC in the past, Fed-speak and economic data should dictate rates direction; in particular, the latter should assume a top role now that the Fed appears to be in data-dependent mode.
Term Rates
- The longer-term curve week-on-week, generally mirroring moves in USTs and swaps, was lower by 16 to 33 bps, with the 2 to 4-year zone leading the decline. Kindly refer to the previous section for relevant market color. The advance curve remains inverted out to 5-year, thereby offering opportunities to extend in advance duration at lower coupon cost.
- On the UST term supply front, this upcoming week serves 3/10/30-year auctions. Please contact the Member Services Desk for further information on market dynamics, rate levels, or products.
Product Alert: FHLBNY is pleased to announce the reintroduction, after a temporary suspension owing to Libor-cessation, of the Putable Advance, Fixed-Rate with SOFR Cap Advance, and ARC with SOFR Cap/Floor Advance. The Callable Advance continues to be offered. This expansion of the product menu will provide members with more options and flexibility for the management of funding and/or hedging needs.
Forward Start Advance (FSA): For members with upcoming borrowing or refunding plans, consider the FSA as a method to opportunistically “lock in” rates before advance settlement date. Please contact the Member Services Desk at (212) 441-6600 for more information.
The Symmetrical Prepayment Advance Feature
For those anticipating term funding needs, and with rates on an uptrend, it can be an appropriate juncture to consider our SPA feature. This feature allows the member to capture, at prepayment, changes in the fair value of the advance which are favorable to the member. Contact Member Services Desk to discuss.
Looking for more information on the above topics? We’d love to speak with you!
Questions?
If you wish to receive the MSD Weekly Market Update in .pdf format (includes FHLBNY rate charts) or to discuss this content further, please email the MSD Team.