Member Services Desk
Weekly Market Update
Economist Views
Click to expand the below image.
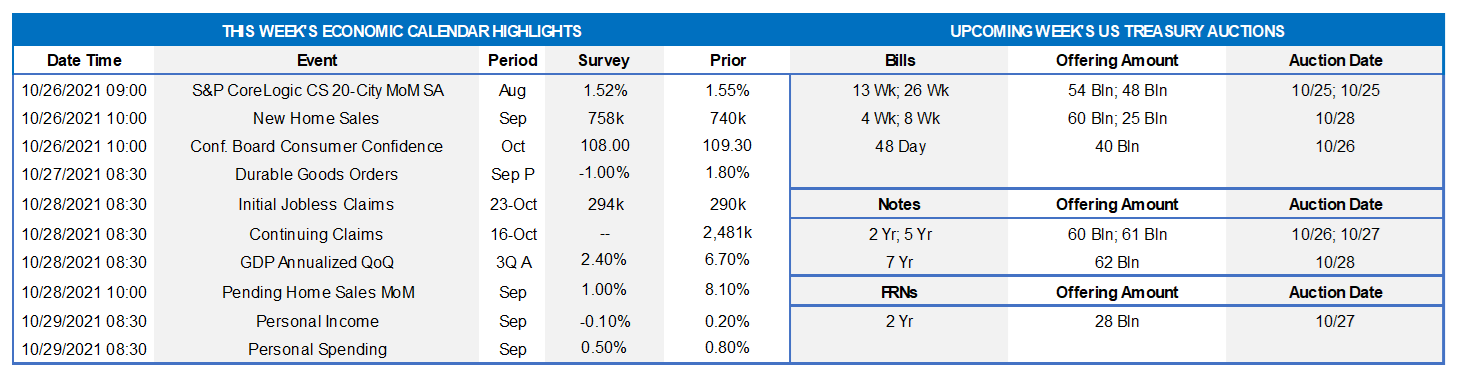
With Federal Reserve officials observing the traditional blackout period ahead of the November 2-3 FOMC meeting, fiscal policy developments and the economic release calendar will move to the forefront. As of this writing, Congressional Democrats are trying to finalize negotiations on a roughly $2trn compromised version of President Biden’s plan that would allow a House vote on the separate $550bn bipartisan infrastructure bill. On the data front, home-price increases likely hit a new record pace over the 12 months ended August, while real GDP growth is expected to slow sharply from the spring quarter’s pace. Concerns about prospective business activity, hiring and incomes probably weighed on consumer sentiment in October.
S&P CoreLogic Case-Shiller (SPCLCS) 20-City Home Price Index: Home prices probably continued apace across the twenty major metropolitan areas canvassed by SPCLCS in August. Indeed, the 1.5% increase anticipated by the Street, after a similar rise in July, would place home selling prices a record 20.2% above those of a year ago.
New Home Sales: Contracts to buy a newly constructed dwelling likely rose to a five-month high seasonally adjusted annual rate of 745K in September.
Conference Board Consumer Confidence: Available sentiment soundings suggest that this gauge slipped for a fourth straight month to 102.5 in October from 109.3 in September. As always, pay attention to the so-called labor differential – the percentage of survey respondents feeling that jobs are plentiful less than those believing they are hard to get – for clues to the likely change in the civilian jobless rate this month.
Durable Goods Orders: Pared by a jetliner-led pullback in transportation, orders probably declined by 1% in September, reversing roughly half of the 1.8% gain recorded in August. Excluding the projected decline in transport requisitions, “hard goods” bookings are expected to have edged .4% higher, almost matching the prior-month .6% gain. Last month’s nondefense capital goods shipments excluding commercial jets will allow economists to take a final look at their business equipment spending estimates before the next day’s advance report on Q3 real GDP growth.
Jobless Claims: Initial and continuing claims under regular state unemployment insurance programs likely moved lower during their latest respective reporting periods. The recent termination of pandemic-related jobless benefits suggests that the total number of persons receiving assistance will also decline further during the week ended October 9 from the 3.28mn, or 2% of the civilian labor force, recorded in the prior week.
Real GDP Growth: Reduced consumer outlays prompted by the Delta variant outbreak, combined with supply disruptions and labor shortages, are expected to have capped real GDP growth at an annual rate of 2.4% in Q3, after a 6.7% jump during Q2. As is common with the Bureau of Economic Analysis’ advance report, the range of forecasts is quite wide and extends from .8% to 3.8%.
Pending Home Sales: Still constrained by the lack of available homes on the market nationwide, contract signings probably climbed by 1% in September, after the surprising 8.1% jump recorded in August. The estimated strength in pending home sales over the latest two months, if realized, would be consistent with a 2.7% increase in existing home purchases to an 8-month high SAAR of 6.49mn in the National Association of Realtors’ October report.
Personal Income & Spending: Reflecting reduced government unemployment insurance payments, personal income likely dipped by .1% in September, erasing half of August’s estimated gain. Consistent with the reported increase in “control” retail sales, consumer spending probably climbed by .5% during the reference period, after a .8% prior-month gain.
Federal Reserve: No public appearances. Federal Reserve officials will observe blackout period ahead of November 2-3 FOMC meeting.
Click to expand the below images.
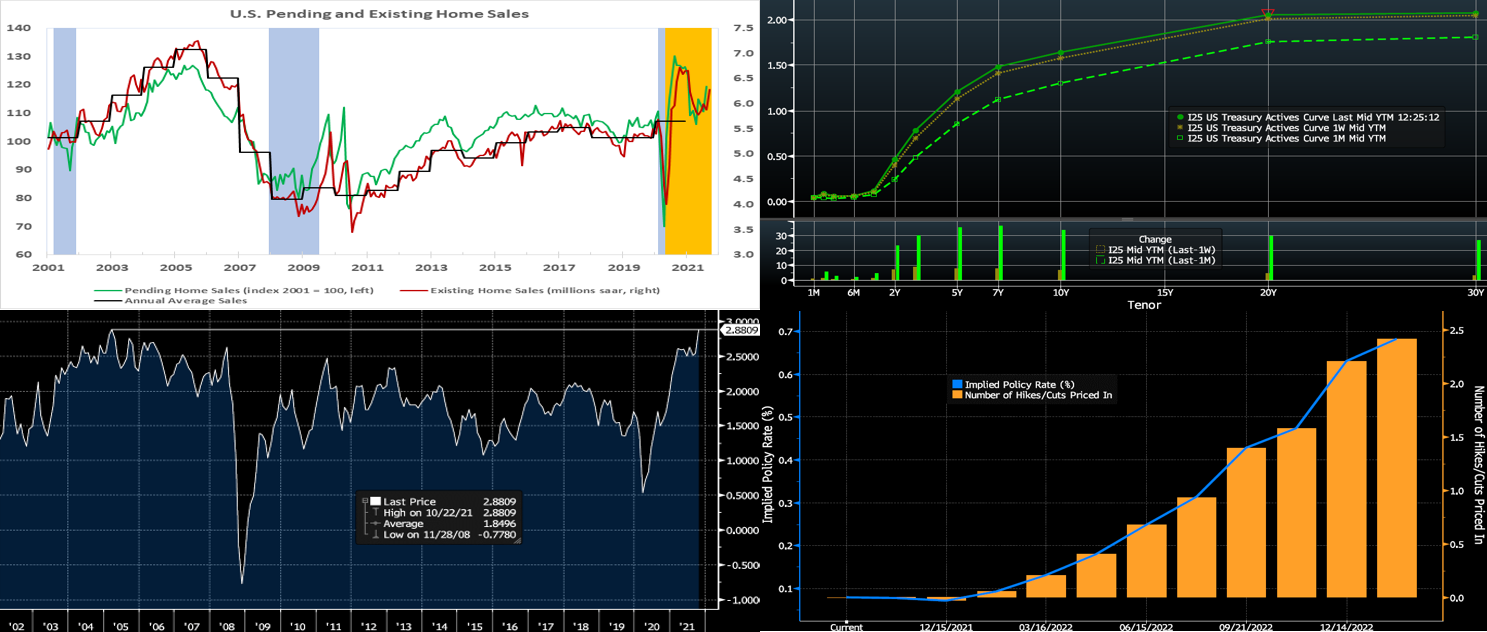
CHART 1 UPPER LEFT
Source: National Association of Realtors, FHLB-NY. Note: orange-shaded area highlights current economic expansion; blue-shaded areas denote recessions. Consistent with the surge in home-purchase contracts signed in August, closings on existing dwellings jumped by 6.9% to a seasonally adjusted annual rate of 6.29mn in September – the highest level since January. All regions of the country contributed to last month’s reported gain. Notably, existing home sales in the Northeast climbed by 5.5% to a seven-month high of 770K. With the number of homes on the market dipping by .8% to 1.27mn, the stock of unsold dwellings moved two ticks lower to 2.4 months’ supply.
CHART 2 UPPER RIGHT
Source: Bloomberg. Note: Top pane is yield (%), bottom pane is change (bps). As of midday Friday, the UST curve again finished higher and flatter week-over-week. The 2-year was ~7 bps higher, 3-year ~9 bps higher, and the 5 to 10-year sector ~6 to 8 bps higher. The very long end finished a few bps higher. Most of the upward moves in yields have occurred in the 2 to 4-year zone, as the market has more aggressively priced Fed hikes into the curve (see below for further color). Heavy corporate issuance and rising global yields also contributed to the move. Action has been somewhat volatile; indeed, yields had traded even higher until Friday morning comments from Fed Chair Powell spurred a downward and flattening move of 2 to 7 bps. Powell essentially declared that tapering will soon commence and conclude mid-2022 and that it was too early yet for rate hikes. He also opined that inflation should moderate over time as constraints (supply chain, for e.g.) ebb, but he also declared that the Fed is at-the-ready to “use their tools” in combating upside risks to the inflation outlook. The curve flattening appears to be driven by the market ‘s belief that the Fed will counter and contain the longer-term inflation threat via a taper announcement by mid-December and thereby “kick off” a removal of accommodation and application of rate hikes later next year.
CHART 3 LOWER LEFT
Source: Bloomberg. Depicted here is a long-term view, as of midday Friday, of the 5-year TIPS Breakeven inflation rate (RHS, %). As a refresher, the Breakeven is derived from the following equation: Breakeven inflation rate = Nominal UST yield – TIPS yield. This week the 5-year (and 10-year too) Breakeven hit historically high levels and even crossed the 3% level early Friday before retreating towards 2.90%. The market’s pricing of higher inflation expectations has contributed to the rise in nominal UST yields and a repricing of Fed hike expectations to quell it. Notably, the 5-year 5-year forward Breakeven has also traded higher in the past month; however, at ~2.36%, it indicates that the market expects lower longer-term inflation partly via the Fed’s navigation/actions.
CHART 4 LOWER RIGHT
Source: Bloomberg. Yields in the shorter end of the curve moved higher again this past week, mostly on a repricing of Fed hike expectations. As seen here, the markets price for a Fed Funds rate of ~.65% (LHS) at the end of 2022. Given that current Fed Funds trades at ~.08%, this market pricing implies just over 2 hikes (RHS) of 25 bps by the end of next year. This pricing is significantly higher (~30 bps and over 1 hike) than that of just a month ago.
FHLBNY Advance Rates Observations
Front-End Rates
Short-end Advance rates finished unchanged on the week. The debt ceiling issue has essentially been pushed off to December, but this issue, and the T-bill curve kinks it has caused, have not materially impacted our rates. Demand for short paper and the Fed’s RRP, which hit a record $1.6trn a few weeks ago and stands last ~$1.4trn, remains strong. The Fed acknowledged this dynamic at the last FOMC, as they raised the RRP counterparty limit to $160bn from $80bn. The overall supply/demand paradigm persists in suppressing rate levels, as the GSEs continue to invest large sums into money markets, the TGA has declined, Fed purchases instill funds to the banking system, and short-maturity paper is in low supply.
UST issuance overall is now net positive supply in that more is being issued than what the Fed is buying in its programs. However, with short UST rates at rock-bottom levels and the Fed on hold, rates are likely to persist in a near-term sideways pattern. Importantly, weekly net T-bill issuance has been lower since 2020 and negative for months, and Treasury intends to shift issuance out the curve. T-bills are likely to experience a near-term issuance uptick on some “catch-up” issuance from the debt ceiling issue slowdown, but this uptick should not alter the overall money markets picture. Further legislative packages and related borrowing may lead to an eventual increase of T-bill auction sizes and positive net supply, but for now overall market supply/demand dynamics should keep short rates in check from large moves to the upside.
Term Rates
The Advance rate curve finished higher on the week. While the 1-year was unchanged, the 2 to 10-year sector was ~ 8 to 12 bps higher, with the 3 to 5-year zone leading the move and the 3-year the outright leader. Kindly refer to the previous section for further color on relevant market dynamics.
On the UST supply front, this week brings 2/5/7-year auctions. These could prove a challenge, if the market prices even more aggressive Fed hikes. On the other hand, investors may believe the curve, at this point, is more than “fairly priced” for Fed action and thereby jump on the higher yields. The market will closely monitor legislative developments as well as economic data and pandemic news.
New Product Alert: FHLBNY is pleased to announce the launch of the Business Development Advance (BDA) on Thursday, November 4, 2021. The BDA is a 0% advance to help our members provide funding to qualifying small businesses to promote community & economic growth. The BDA is subsidized funding in the form of interest-rate credits. There is a total of $3 million of interest-rate credits available in 2021. Members can request to reserve their interest-rate credits up to $50,000 on a first-come/first-served basis.
New Product Alert: In order to satisfy member needs and provide greater product flexibility to match bond and derivative market conventions, FHLB-NY now offers SOFR-linked advances based on SOFR-index compounding. Note that this product is in addition to SOFR-linked advances based on SOFR-index averaging which have been offered since November 2018.
The Symmetrical Prepayment Advance Feature
With rates at or near multi-year lows, it is a compelling juncture to use the SPA feature on term advances. This feature allows member to capture, at prepayment, changes in the Fair Value of the advance which are favorable to the member. Contact us to discuss.
Looking for more information on the above topics? We’d love to speak with you!
Questions?
If you wish to receive the MSD Weekly Market Update in .pdf format (includes FHLBNY rate charts) or to discuss this content further, please email the MSD Team.