Member Services Desk
Weekly Market Update
This MSD Weekly Market Update reflects information for the week of November 2, 2020.
Economist Views
Click to expand the below image.
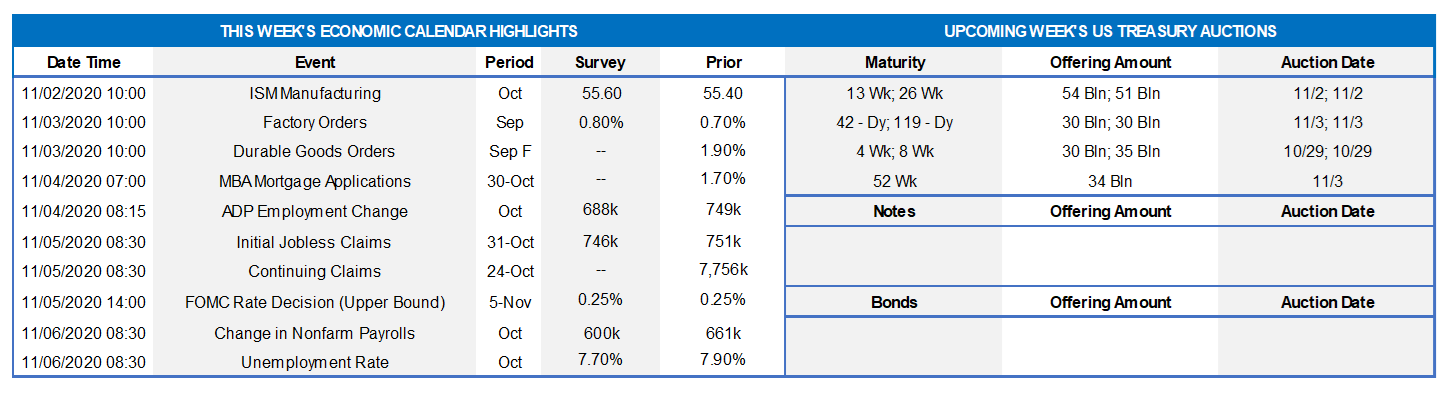
The marquee event of the week will be the 2020 Election on Tuesday. While the latest polls have former Vice President Biden comfortably ahead of President Trump and hint at the Democrats taking control of the Senate, the memory of their misses four years earlier loom large. The Federal Open Market Committee will meet following Election Day. While no changes are anticipated to the federal funds target range or the pace of security purchases, policymakers likely will upgrade their appraisals of current business activity. At the end of the week, the Bureau of Labor Statistics (BLS) will release the Employment Situation Report for October. Significant declines in initial and continuing jobless claims since the September survey period hint that there could be some positive surprises vis-à-vis market expectations in the upcoming report.
ISM Manufacturing Index: Available regional canvasses suggest that manufacturing activity expanded for a fifth straight month in October, with the Purchasing Managers’ Index likely rebounding to an above-consensus two-year high of 56.5.
Construction Spending: The nominal value of new construction put-in-place is expected to have risen by 1.0% in September, boosting the cumulative increase since May to 4.2%. Barring any prior-month revisions, construction spending will have climbed at an annualized pace of 9.1% in Q3, reversing a portion of the 15.2% dive in the spring.
Motor Vehicle Sales: Light vehicle sales are expected to have risen for a sixth consecutive month in October. The 16.45mn seasonally adjusted annual rate anticipated by the consensus would be just a touch below the 16.79mn average recorded over the three months prior to the shuttering of the economy in March.
ADP National Employment Report: ADP Employer Service’s update on private job growth could color market participants’ expectations heading into the Bureau of Labor Statistics’ report. The median Street forecast of a 750K rise would be a shade below the 749K gain posted in September.
ISM Non-Manufacturing Index: District Fed surveys suggest that the ISM’s service activity barometer moved two points higher to 59.8 in October – the strongest reading since November 2018.
Jobless Claims: Online inquiries on how to apply for unemployment insurance benefits suggest that initial claims probably moved below the 700K mark during the period ended October 31, from 751K in the previous week, but remained well above the 233K average that prevailed before the COVID-19 crisis began in late March.
Employment Situation Report: Consensus expectations for the October jobs report are for the addition of 600K net nonfarm jobs and a two-tick decline in the jobless rate to 7.7%. Given the sharp declines in continuing jobless claims and the state insured unemployment rates between the September and October canvassing periods – the weeks including the 12th of the month – the risks lie in favor of better-than-expected results. Layoffs of temporary workers hired to conduct the 2020 Census will pare the government job count by 147K. One final item, the unusually low 70.4% response rate to the BLS’ September survey, hints at the possibility of an upward adjustment to the preliminary 661K job gain estimated for that month.
Federal Reserve Appearances:
Nov. 4 to 5: Federal Open Market Committee (FOMC) meeting.
Nov. 5: At 2:00pm, FOMC Rate decision and communiqué released.
Nov. 5: At 2:30pm, Chair Powell to hold post-meeting press conference.
Click to expand the below images.
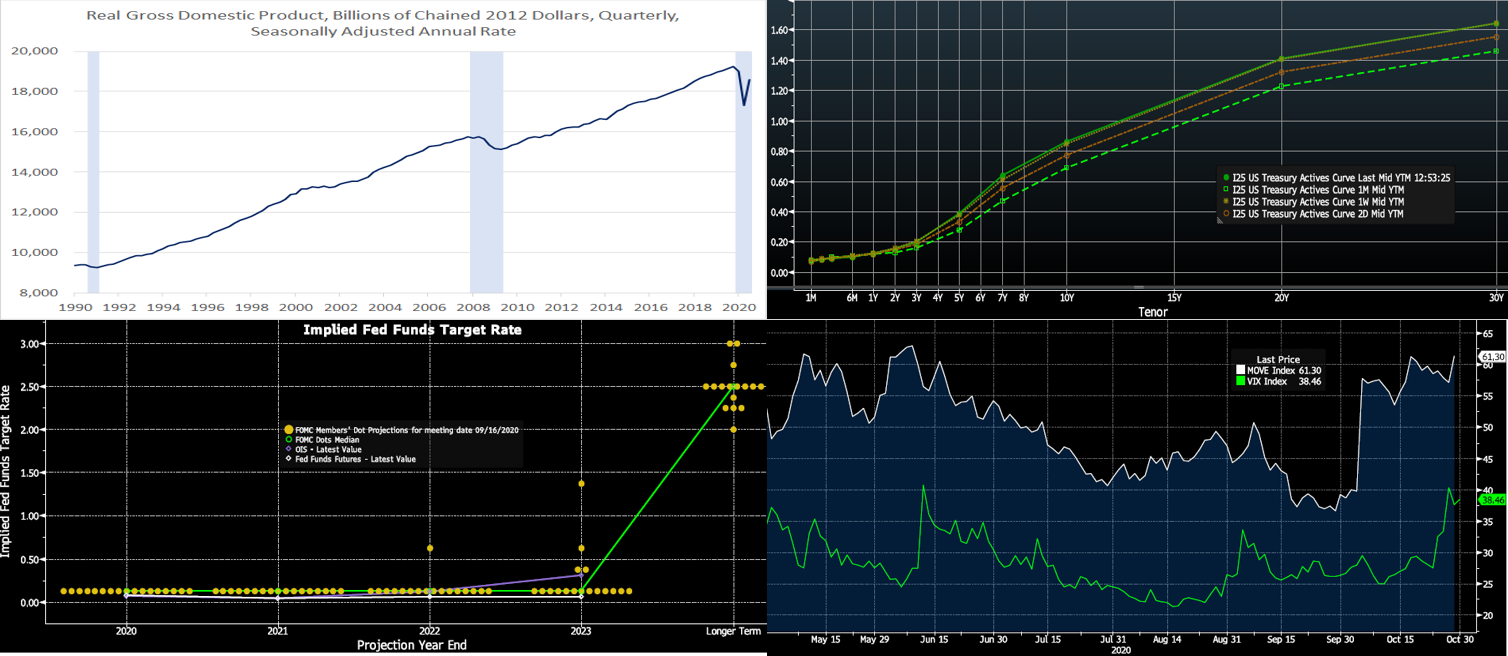
CHART 1 – UPPER LEFT
Source: Bureau of Economic Analysis, National Bureau of Economic Research; FHLB-NY. The BEA reported that real GDP expanded at a record SAAR of 33.1% during the summer quarter, following the shuttering-induced 31.4% plunge suffered in Q2. While a wide range of projections prevailed heading into this report, the BEA’s advance estimate was just a touch above the 32% gain anticipated by the Street. The snapback in Q3 real GDP growth was impressive, yet there remains considerable ground to recover to recoup the earlier lost output. The level of real GDP in Q3, at $18.584tn, remains 3.5% below the prior-expansion peak of $19.254tn at the end of 2019. Nonetheless, the progress made to date has been a tad better than that expected by Fed policymakers. Assuming Street consensus is correct that GDP will rise by 4.0% annualized in the final quarter of the year, the level of real GDP would stand 2.5% below that of Q4 2019 compared to the Fed’s projection of 3.7% below.
CHART 2 – UPPER RIGHT
Source: Bloomberg. The UST curve closed the week almost on top of its position last week and remains higher and steeper than a month ago. The Fed’s guidance and programs have served to pin the shorter maturities, and so again the longer end of the curve led intra-week moves. Note that yields traded lower mid-week (see “2D” chart line), as stocks suffered a slide. But yields recovered thereafter, despite stocks sliding yet again on Friday. Prompts for UST yields rebounding higher were better economic data and an enduring potential “at-some-point-in-the-months-ahead” status of an additional fiscal relief package which, in turn, would lead to increased UST supply.
CHART 3 – LOWER LEFT
Source: Bloomberg. Given the FOMC meeting this week, depicted here is the Fed’s “Dot Plot” (FOMC participant forecasts of the Fed Funds rate), the OIS (Overnight Indexed Swap) term curve, and the Fed Funds futures curve. The Fed Funds rate is expected to essentially “flatline” over the next few years. It is highly doubtful that this picture will change much, if at all, following the meeting.
CHART 4 – LOWER RIGHT
Source: Bloomberg. With the upcoming elections and heightened uncertainty, measures of market implied volatility in stocks and bonds have risen in recent weeks. Both the “VIX”, an index of implied volatility of the S&P 500, and the ”MOVE”, and index of implied volatility of UST’s, have clearly climbed higher. There are various potential scenarios and impacts on rates, most of which tend to influence the longer end of the yield curve; meanwhile, COVID-19 case numbers, infection and hospital rates, and total death counts have all risen in recent weeks. Please call the desk to discuss markets and potential scenarios for rates and the yield curve.
FHLBNY Advance Rates Observations
Front-End Rates
Short-end advance rates were unchanged, except for 5 and 6-mo which were a bp lower, week-over-week. Heavy T-bill issuance was a feature, as usual, but net supply has been slowing and thereby allowing for easier market absorption. Continuing a recent trend, money market funds experienced ~$12.6bn of outflow on the week. Overall market supply of short paper has moderated in recent months, however, thereby blunting the impact of these investor outflows.
Heavy T-Bill issuance will remain a theme; UST issuance overall is now net positive supply in that more is being issued than what the Fed is buying in its programs, and so this scenario could prove a small challenge. However, with short UST rates at rock-bottom levels, and the Fed likely on hold for a long period, rates may trade in a sideways pattern. Net T-bill issuance has been lower since mid-summer and even negative in recent weeks, and Treasury has announced plans to shift issuance out the curve, but a new fiscal relief package may complicate/alter this forecast.
Term Rates
Medium and longer-term advance rates were unchanged to a bp or two higher on the week, in a very slight “bull steepening” shift. Rates 5-year and shorter generally remain pinned in a narrow range, and so again it was the portion of the curve past 5-year that led the week’s change. Please refer to the previous section for further color on the market moves.
Rates still trade at historically low levels across the yield curve, and the curve is priced for the Fed to be on hold for several years. If suitable or sensible from an ALM perspective, it may be worthwhile to consider extending liabilities and locking in term rates. Note that the impending election has the potential to spur further moves in the curve and rates. Please call the Member Services Desk to discuss rate levels and potential ideas.
This week brings a reprieve in term UST auctions. Corporate issuance should add yet again to its historic record annual pace. Attention will remain on the elections, prospects of further relief legislation, the FOMC meeting, and certainly also on COVID-19 developments.
The Symmetrical Prepayment Advance Feature
With rates at or near multi-year lows, it is a compelling juncture to use the SPA feature on term advances. This feature allows member to capture, at prepayment, changes in the Fair Value of the advance which are favorable to the member. Contact us to discuss.
Looking for more information on the above topics? We’d love to speak with you!
Questions?
If you wish to receive the MSD Weekly Market Update in .pdf format (includes FHLBNY rate charts) or to discuss this content further, please email the
MSD Team.
Special Member Alert
The FHLBNY recently announced a newly expanded and flexible Disaster Relief Funding (DRF) advance program which offers discounted rate advances with maturities 1-mo and greater. Additionally, we have announced that PPP loans will be accepted as eligible collateral. Please contact us with any questions.