Member Services Desk
Weekly Market Update
This MSD Weekly Market Update reflects information for the week of April 18, 2022.
Economist Views
Click to expand the below image.
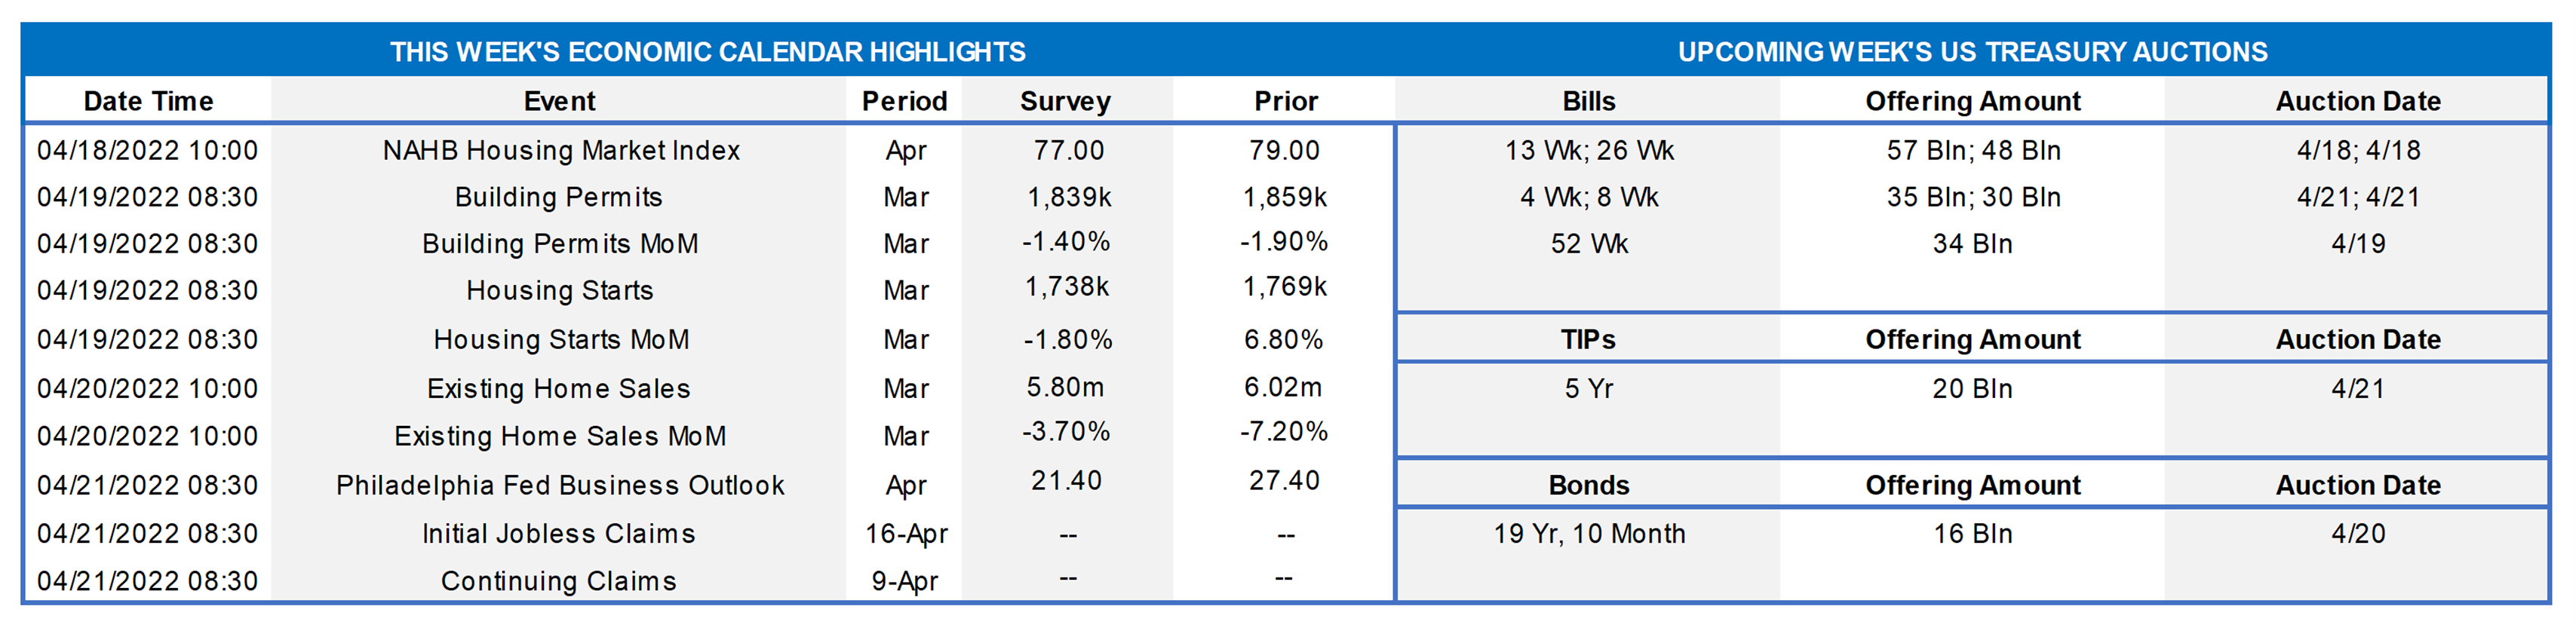
The focus of market participants will turn to housing indicators over the course of an otherwise quiet data week. While favorable climatic conditions likely buoyed new residential construction activity, existing home sales probably ebbed further in March. A quartet of Federal Reserve officials will make public appearances to discuss the outlook for the economy and monetary policy prospects. The latest edition of the Beige Book will provide useful color on developments in the FHLB-NY coverage area.
NAHB/Wells Fargo Housing Market Index (HMI): Home-builders’ appraisals of current and prospective sales likely eroded marginally in April, in response to the dramatic backup in mortgage rates. The market expects the HMI to move one point lower to 78, well above the 50-point mark associated with neutral market conditions.
Housing Starts & Building Permits: While economists expect housing starts and building permits to have retreated in March, unusually dry and warm weather conditions across the continental United States hint that there could be upside surprises in the Census Bureau’s report.
Existing Home Sales: The falloff in purchase-contract signings witnessed over the January-February span suggests that closings retreated by 4.7% to a seasonally adjusted annual rate of 5.77mn in March – the lowest level since the 4.84mn homes sold in June 2020. With normal seasonal patterns pointing to a modest rise in the number of homes on the market to 890K, the stock of unsold dwellings likely registered at 1.9 months’ supply.
Jobless Claims: With available positions eclipsing the number of jobless persons by a historically wide margin, initial and continuing state unemployment insurance claims probably moved lower.
Philadelphia Fed Manufacturing Survey: Factory activity in this district likely expanded for a 23rd straight month in April, although the pace of activity is expected to have slowed from March’s reported clip. The general business activity diffusion index – the percentage of respondents noting a pickup less than those witnessing a decline – probably narrowed to 21% from 27.4% in the prior month.
Index of Leading Economic Indicators: To be released 4/21, the Conference Board’s barometer of prospective economic activity probably climbed by .3% in March, matching February’s reported rise.
Federal Reserve Appearances:
- Apr. 18 St. Louis Fed President Bullard to discuss the economic and policy outlook with the Council on Foreign Relations.
- Apr. 19 Chicago Fed President Evans to address the Economic Club of New York.
- Apr. 20 San Francisco Fed President Daly to give speech on the mid-year outlook at the University of Las Vegas.
- Apr. 20 Chicago Fed President Evans to discuss the outlook at the Peterson Institute for International Economics.
- Apr. 20 Federal Reserve to release Beige Book Summary of Commentary on Current Economic Conditions.
- Apr. 21 Fed Chair Jerome Powell, ECB President Christine Lagarde, and Indonesian Finance Minister Indrawati to take part in a panel discussion on the global economy, hosted by the IMF.
Click to expand the below image.
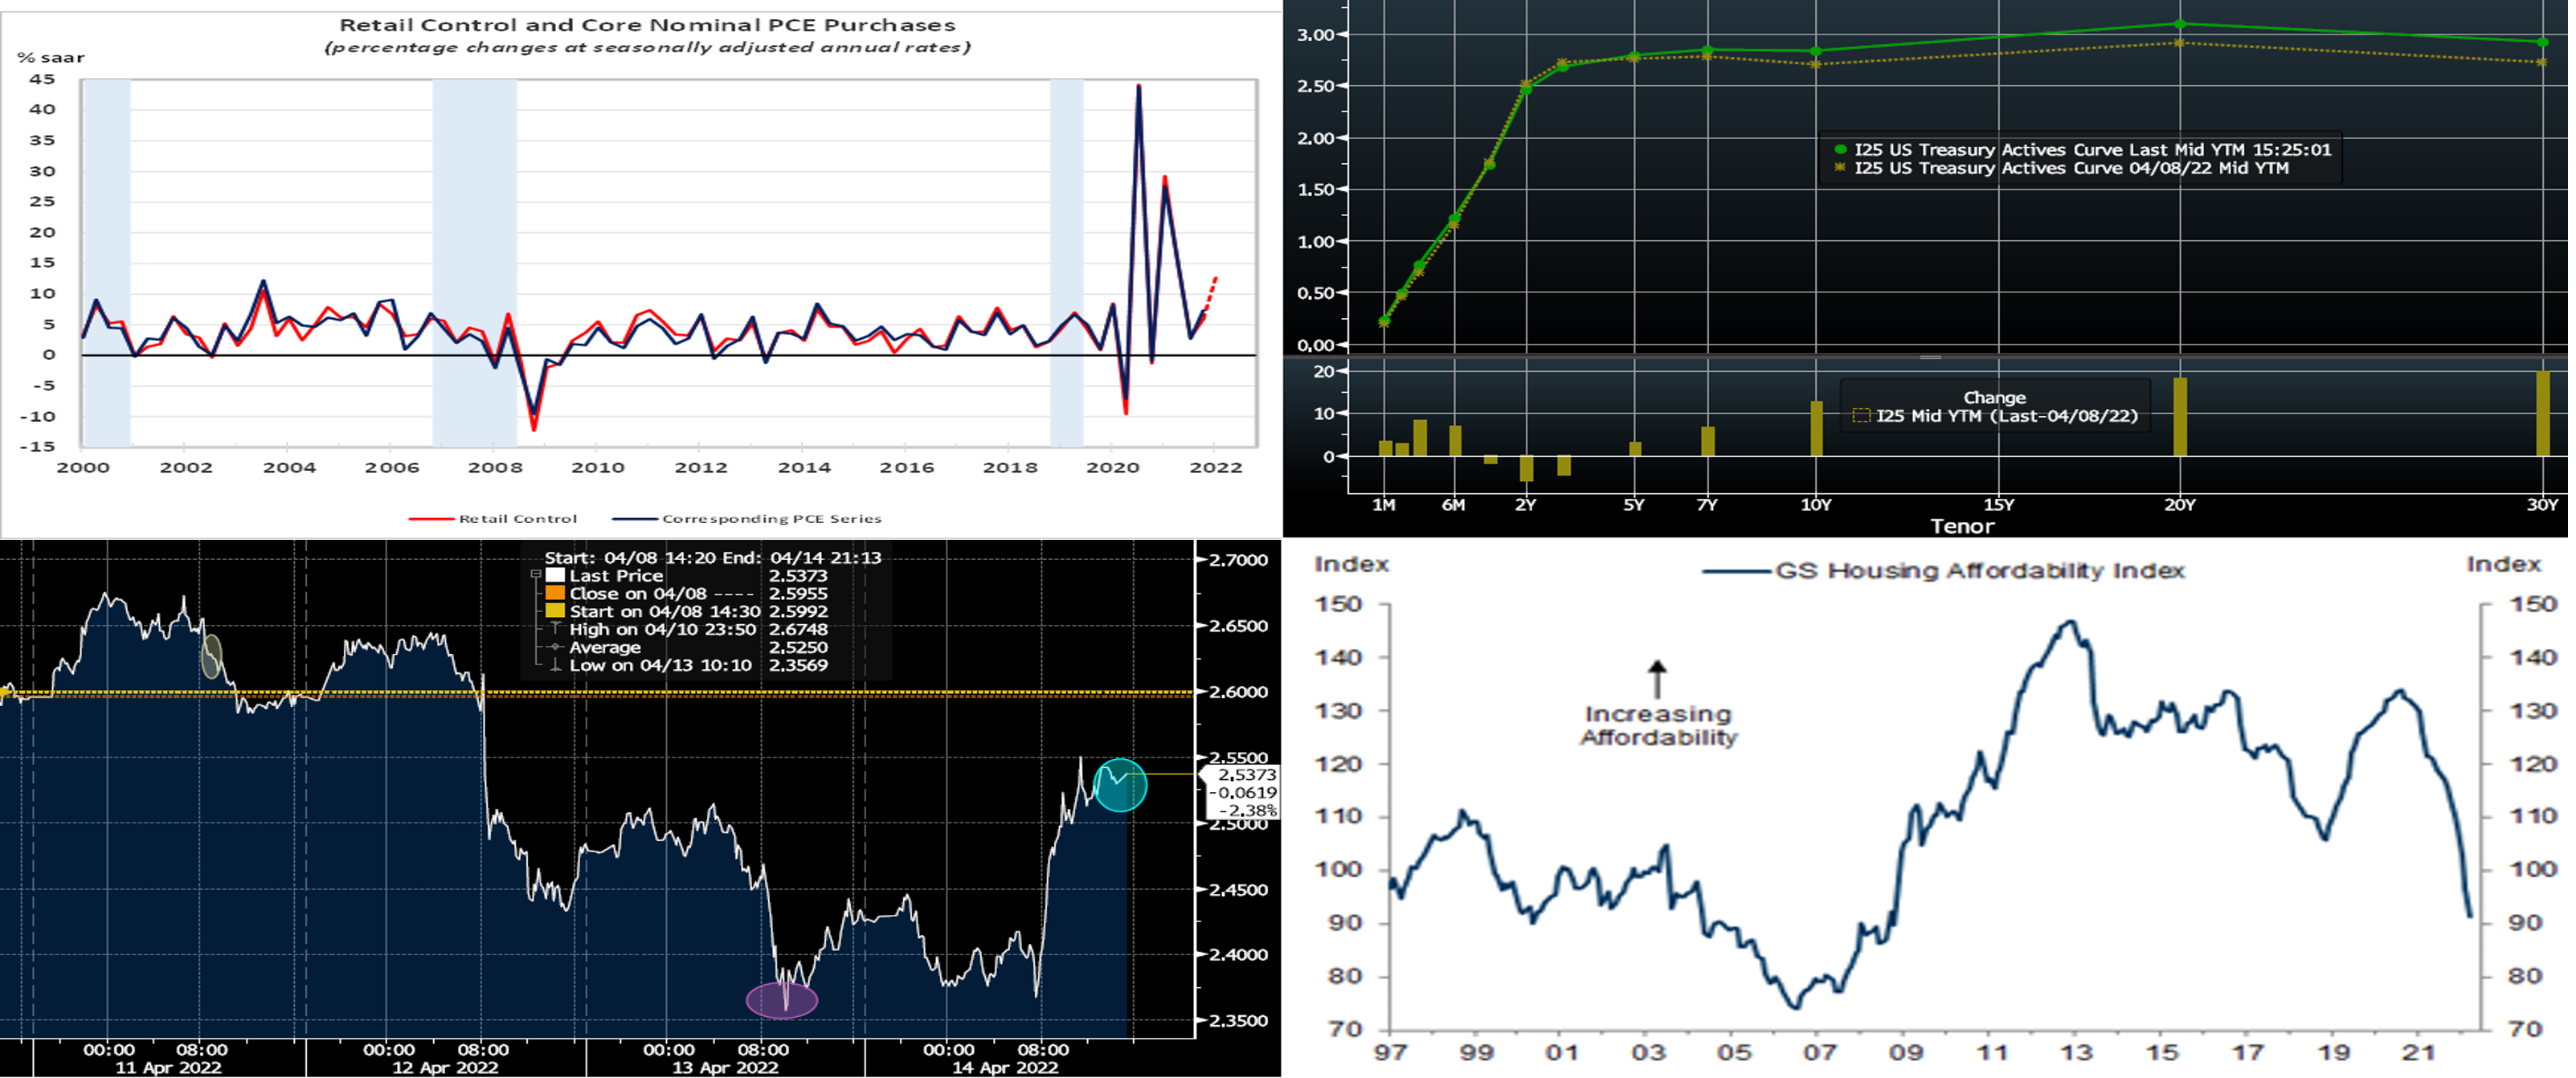
CHART 1 UPPER LEFT
Source: Commerce Dept.; NBER; FHLB-NY. Note: Shaded areas denote recessions. Retail and food services sales edged .5% higher in March, after upwardly revised increases of .8% in February and 5.1% in January. While March’s gain was marginally shy of the rise anticipated by the Street, prior-month adjustments pushed the level of purchases well above those implied by the median forecast. Excluding outlays on autos, building materials and gasoline, retail “control” – the portion of the Census Bureau’s report that is used by the Bureau of Economic Analysis to estimate nominal consumer goods spending – dipped by .1%, following a .9% decline in February and a 6.8% jump in January. Last month’s result, combined with revised February and January tallies, left key sales results during the winter quarter a solid 13% annualized above their October-December average, after a 5.9% annualized fall-quarter advance.
CHART 2 UPPER RIGHT
Source: Bloomberg. Note: Top pane is yield (%), bottom pane is change (bps). The UST yield curve notably steepened again week-over-week, mostly via a rise in longer-maturity yields. Yields in the 1 to 3-year sector finished ~5 bps lower, as the market priced slightly less aggressive Fed tightening later this year and 2023. Indeed, there are increasing numbers of market strategists and economists beginning to debate timing and odds of a potential recession in the next few years. A continued factor contributing to the curve’s bearish steepening in the longer maturities has been concern, while highly uncertain on timing, about the Fed potentially selling MBS as part of the pare-down of its asset portfolio. Much of the past week’s move higher in yields occurred on Friday, post an early-morning series of hawkish comments from ECB officials. Nearer-term, the market presently prices for a 100% chance of a 50 bps hike at both the May 4 and June 15th FOMC meeting; for the rest of 2022, it prices for ~215bps (down from ~233 last week) of cumulative hikes from the current level. Market focus will remain on Fed-speak while also turning to the Beige Book release.
CHART 3 LOWER LEFT
Source: Bloomberg. The past week’s market was another “topsy-turvy” one in which yields traded in a relatively wide range. Portrayed here is the 3-year SOFR swap rate in 10-minute intervals from Monday through the week’s close on Thursday afternoon. After finishing last week ~2.60% and opening Monday morning in the low 2.60s (yellow oval), it spiked lower to ~2.36% on Wednesday morning (purple circle) and subsequently bounced higher Thursday to close ~2.54%. As a reminder, our advance rates track UST and SOFR yields; hence, advance rates followed a similar pattern. As we have highlighted frequently in recent editions, for those in position to borrow, these market moves can present opportunities for better entry levels.
CHART 4 LOWER RIGHT
Source: Goldman Sachs Research. The Goldman Sachs U.S. Housing Affordability Index has declined markedly since last year. This nationwide trend is not that surprising, given that homeowner 30-year mortgage rates have risen over 2% to now ~5% , and home prices have also risen. These trends serve as a reminder that FHLB-NY’s community and affordable housing programs can have an impact in alleviating some of these housing market pressures on those less positioned to afford them. The 2022 Affordable Housing Program (AHP) General Fund Round will open on April 25, 2022, with an application submission deadline of June 3, 2022, at 5:00 PM ET. Informational resources can be found on our website (https://www.fhlbny.com/community/housing-programs/ahp/). We encourage our members to avail themselves of the opportunities offered by these programs.
FHLBNY Advance Rates Observations
Front-End Rates
- Short-end Advance rates finished higher week-over-week by varying degrees. Whereas 1-month was up ~10 bps, other maturities were up by less, with the 6-month unchanged. While the market continued to experience “safety flows” into very short instruments, the market’s ongoing aggressive pricing of forthcoming near-term Fed hikes have served to push advance rates higher. As of the early close on Thursday, the market priced for ~100% probability of 50 bps hikes at both the May 4 and June 15th FOMC. This pricing and the fact that maturities are crossing further into the timeline of the Fed hiking cycle, were causal factors in the rate moves.
- At this stage, all maturities lie within upcoming FOMC meetings, thereby making them highly responsive to the market’s moves and pricing of the Fed
Term Rates
- The advance rates curve generally mimicked the UST curve week-over-week and steepened from the week prior. For instance, while the 2-year was ~5 bps lower, the 10-year was ~12 bps higher. Kindly refer to the previous section for relevant market color. While our advance curve has lost previous points of inversion, it is still notably flat, particularly from 3 to 5-year and from 6 to 8-year. This condition may provide a compelling opportunity to extend liability duration at a minimal coupon increase.
- On the UST term supply front, this upcoming week brings auctions of 5-year TIPS and a 20-year nominal bonds. Markets and rates remain highly prone to move on Fed-speak. Given market volatility, members should monitor conditions for potentially more optimal timing on transactions. Please call the Member Service Desk for information on market dynamics, rate levels, or products.
Product Alert: FHLBNY is pleased to announce enhancements to our Advance Rebate Program, which provides members an opportunity to receive a cash rebate when prepaying an eligible advance and rebooking a new advance within a 30-day period. Rebate-eligible advances now must have a minimum of 6-months (reduced from 1-year) remaining. Moreover, the potential cash rebate has been increased. This program can be suitable for those wishing to extend their liability duration and/or potentially improve net interest margin. Please call the Member Service Desk at (212) 441-6600 for more information.
Forward Start Advance (FSA): For members with upcoming borrowing or refunding plans, consider the FSA as a method to opportunistically “lock in” rates before advance settlement date. Please call the Member Service Desk at (212) 441-6600 for more information.
The Symmetrical Prepayment Advance Feature
With rates at or near multi-year lows, it is a compelling juncture to use the SPA feature on term advances. This feature allows member to capture, at prepayment, changes in the Fair Value of the advance which are favorable to the member. Contact us to discuss.
Looking for more information on the above topics? We’d love to speak with you!
Questions?
If you wish to receive the MSD Weekly Market Update in .pdf format (includes FHLBNY rate charts) or to discuss this content further, please email the MSD Team.