Member Services Desk
Weekly Market Update
This MSD Weekly Market Update reflects information for the week of January 24, 2022.
Economist Views
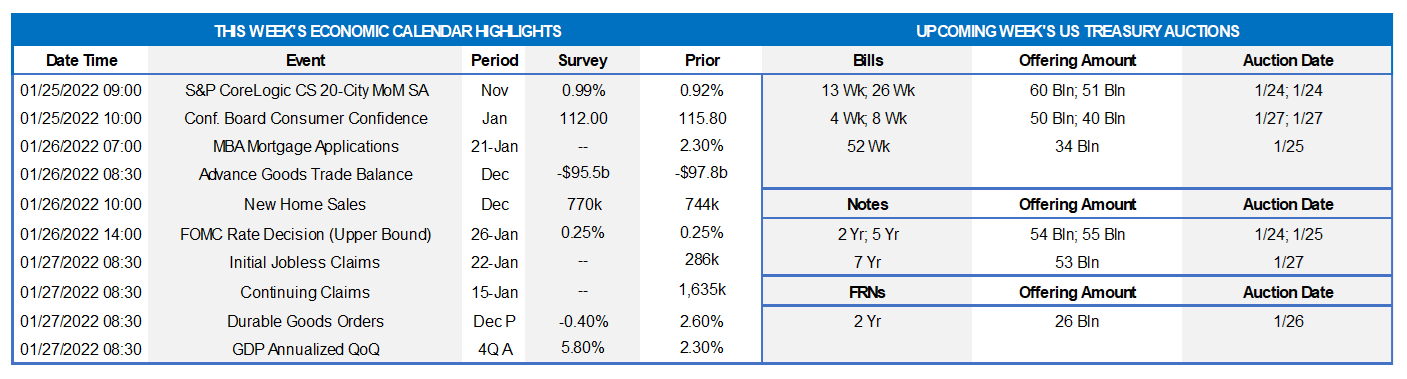
Click to expand the below image.
S&P CoreLogic Case-Shiller (SPCLCS) 20-City Home Price Index: Home prices probably continued to climb across the twenty major metropolitan areas canvassed by SPCLCS in November. Indeed, the 1% increase anticipated by the Street, after a .9% uptick in October, would place home selling prices 17.9% above those witnessed a year ago.
Conference Board Consumer Confidence: Available sentiment soundings suggest that the Conference Board’s consumer confidence gauge likely tumbled to an 11-month low of 107 in January from 115.8 in the previous month. Pay particular attention to the so-called labor differential – the percentage of survey respondents feeling that jobs are plentiful less than those believing they are hard to get – for clues to the likely change in the civilian jobless rate this month.
New Home Sales: Contracts to buy a newly constructed dwelling probably jumped by 6.9% to an eight-month high seasonally adjusted annual rate of 795K in December.
Jobless Claims: Tight labor-market conditions suggest that both initial and continuing claims under regular state unemployment insurance programs will move lower, following unusually large prior-period increases.
Durable Goods Orders: Capped by an anticipated decline in transportation equipment requisitions, durable goods orders probably dipped by .4% in December, reversing a portion of the 2.6% gain posted in November. Excluding the anticipated pullback in transport orders, “hard goods” bookings are expected to have climbed by .4% during the reference period, building on the prior month’s .9% rise. December’s nondefense capital goods shipments excluding commercial jet deliveries may provide a gauge on the momentum of business equipment spending heading into 2022.
Real GDP: Stepped-up inventory building and consumer spending, along with a rebound in residential investment and a narrower international trade deficit, likely boosted the pace of real GDP growth to 5.3% annualized in Q4, following a 2.3% advance during the summer. As is common with the BEA’s advance report, the range of forecasts is quite wide extending from 4.1% to 7.1%.
Pending Home Sales: To be released on the 27th – Despite being constrained by the lack of available dwellings on the market, contracts to purchase a home likely jumped by 6.5% last month, erasing the 2.2% decline witnessed in November. The estimated strength in pending home sales over the final two months of 2021, if realized, would be consistent with a 2.9% increase in existing home sales to a seasonally adjusted annual rate of 6.36mn in the National Association of Realtors’ January report.
Federal Reserve Appearances:
- Jan. 26 Federal Open Market Committee concludes two-day meeting.
- Jan. 26 Federal Reserve Chair Jerome Powell to hold post-meeting press conference.
Click to expand the below image.
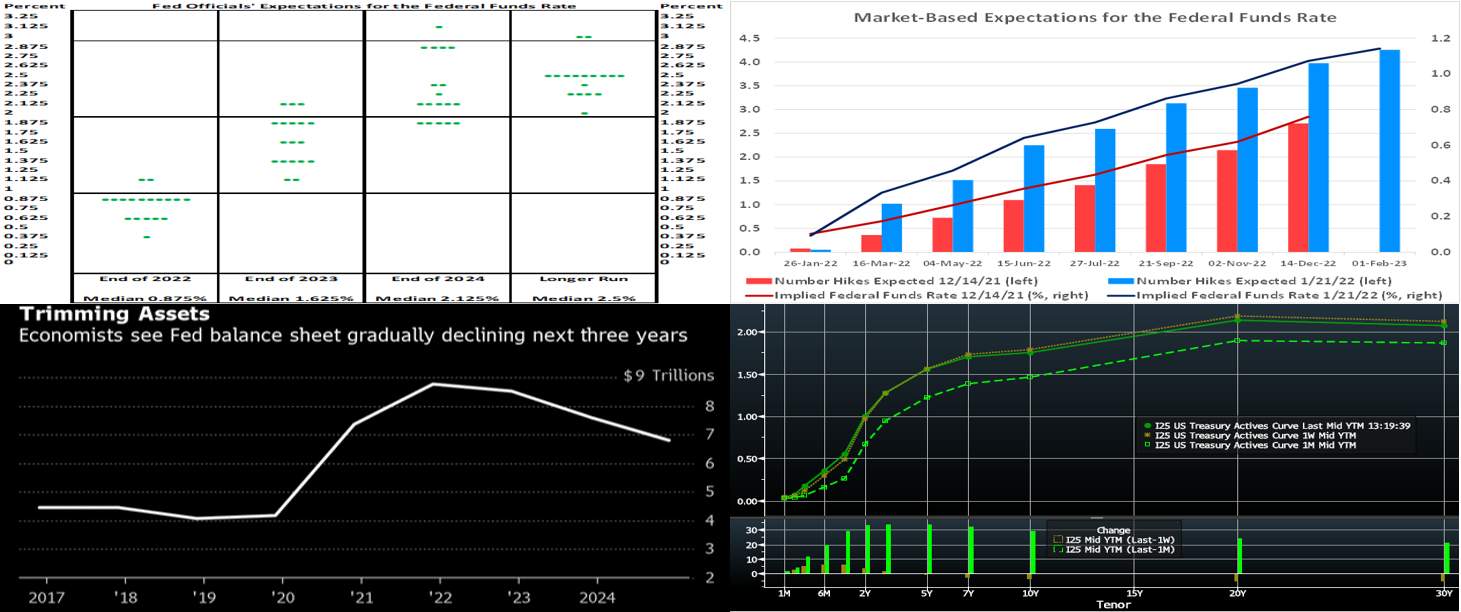
CHART 1 UPPER LEFT
Source: Federal Reserve; Bloomberg; FHLBNY. Given the impending FOMC meeting, we revisit our charts on Fed rate projections (“dot plot”) and market pricing of policy rates. In the communiqué following the December FOMC meeting, policymakers dropped the view that last year’s inflation flareup was due to transitory factors and acknowledged that supply and demand imbalances related to the pandemic and the reopening of the economy were contributing to the elevated price increases. Updated projections contained in December’s Summary of Economic Projections revealed that Fed officials anticipated raising the federal funds rate target range from ¾ to 1% by the end of this year, thereby implying three 25 bps increases. Since the last meeting, economic data has further raised Fed officials’ concerns, as reflected in their numerous comments, about inflation forces.
CHART 2 UPPER RIGHT
Source: Federal Reserve; Bloomberg; FHLBNY. Responding to the updated “dot plot” and heightened inflation concerns, market expectations of future rate hikes have risen sharply since the December FOMC meeting and are, as of midday Friday, ahead of policymakers’ projections. Indeed, the market now expects roughly four rate increases (of 25 bps each) to occur between now and the December 2022 FOMC meeting, as seen here. And the market prices for a solid 100% probability of a 25 bps hike at the March FOMC. At this stage, a surprise from the Fed would be a hike this week, a 50 bps hike in March, or simply more aggressive posturing this week about a potentially faster pace of tightening this year.
CHART 3 LOWER LEFT
Source: Bloomberg. Another surprise factor for the FOMC is the topic of Fed balance sheet reduction, i.e. not reinvesting matured securities and principal payments from its UST and MBS portfolios. While highly unlikely to contain any specific details, since the Fed prefers to focus on its primary tool of rate guidance, the topic may be addressed in general terms. This chart summarizes (median result) a Bloomberg survey of economists from January 14-19 on the size of the Fed’s balance sheet at year-ends. Runoff is likely to commence shortly after rate hikes, but economists have varying views on precisely when as well as the pace and composition thereof. Most expect the runoff to commence this year, with 29% looking for a start from April to June and 40% expecting July to September, with a median estimate of monthly reductions between $40 and $60bn. The runoff pace would bring the size of the balance sheet down to $8.5trn at the end of this year and $7.6trn at the end of 2023, still far above pre-pandemic levels. The Fed is likely to just allow runoff and not directly sell assets, according to 75% of those in the survey. Runoff will negate a source of securities demand from the market, and most importantly, it will also remove liquidity and funds from the overall banking system.
CHART 4 LOWER RIGHT
Source: Bloomberg. Note: Top pane is yield (%), bottom pane is change (bps). As of midday Friday, the UST yield curve modestly flattened week-over-week. The 2-year was a few bps higher, 5-year essentially unchanged, and longer maturities a few bps lower. Yields are notably higher than a month ago, in reaction to data and hawkish Fed rhetoric. Note, however, that yields were 4 to 10 bps higher, progressively from 2 to 10-year, this past mid-week. It appears that the ongoing declines in equities lent support to bonds, and so yields retreated and consolidated from the previous higher levels. Maximum market focus will be on the FOMC this week.
FHLBNY Advance Rates Observations
Front-End Rates
- Short-end Advance rates 6-month and shorter are again higher and steeper from the prior week. Net T-bill issuance has turned positive, as Treasury aims to rebuild their TGA cash balances. While this trend somewhat changes the short-end’s supply/demand dynamic, there is still ample demand for the shortest paper. Demand for the Fed’s RRP, which stands last at ~$1.71trn, remains strong. Money market funds’ AUM fell ~57bn from a week ago, however, thereby sapping some demand, as investors likely pulled more cash out of safe year-end “holding spots”. These dynamics have served to limit changes in the very short maturities. However, with more than a 100% probability of a Fed hike now priced into the curve for the mid-March FOMC meeting, maturities crossing this timeframe have adjusted upwards. While rates through 1-month were only 1 bp higher from a week prior, the 3 to 6-month sector was 7 to 8 bps higher.
- T-bills are experiencing an issuance increase, but this uptick should not alter the overall money markets paradigm of strong demand amidst limited supply, at least in the extreme front-end. To reiterate, however, as time ensues and maturities cross into or further past March, a timeframe the market prices a strong probability of rate hikes, these maturities’ rates are likely to experience further upward drift.
Term Rates
- The advance rates curve generally mimicked the UST curve week-over-week, with the shorter maturities up a few bps, while the 5-year was unchanged and longer terms a few bps lower. Kindly refer to the previous section for further color on relevant market dynamics.
-
On the UST supply front, this week brings 2/5/7-year auctions. Given the FOMC on Wednesday, the 2 and 5-year, occurring in the days prior, could spur a cautious backup in yields, as buyers will want to avoid being “underwater” post-Fed. Market focus will keenly square on the FOMC.
The Symmetrical Prepayment Advance Feature
For those anticipating term funding needs, and with rates on an uptrend, it can be an appropriate juncture to consider our Symmetrical-feature advance. This feature allows the member to capture, at prepayment, changes in the fair value of the advance which are favorable to the member. Please contact our Member Service Desk to discuss.
Looking for more information on the above topics? We’d love to speak with you!
Questions?
If you wish to receive the MSD Weekly Market Update in .pdf format (includes FHLBNY rate charts) or to discuss this content further, please email the MSD Team.