Member Services Desk
Weekly Market Update
This MSD Weekly Market Update reflects information for the week of October 3, 2022.
Economist Views
Click to expand the below image.
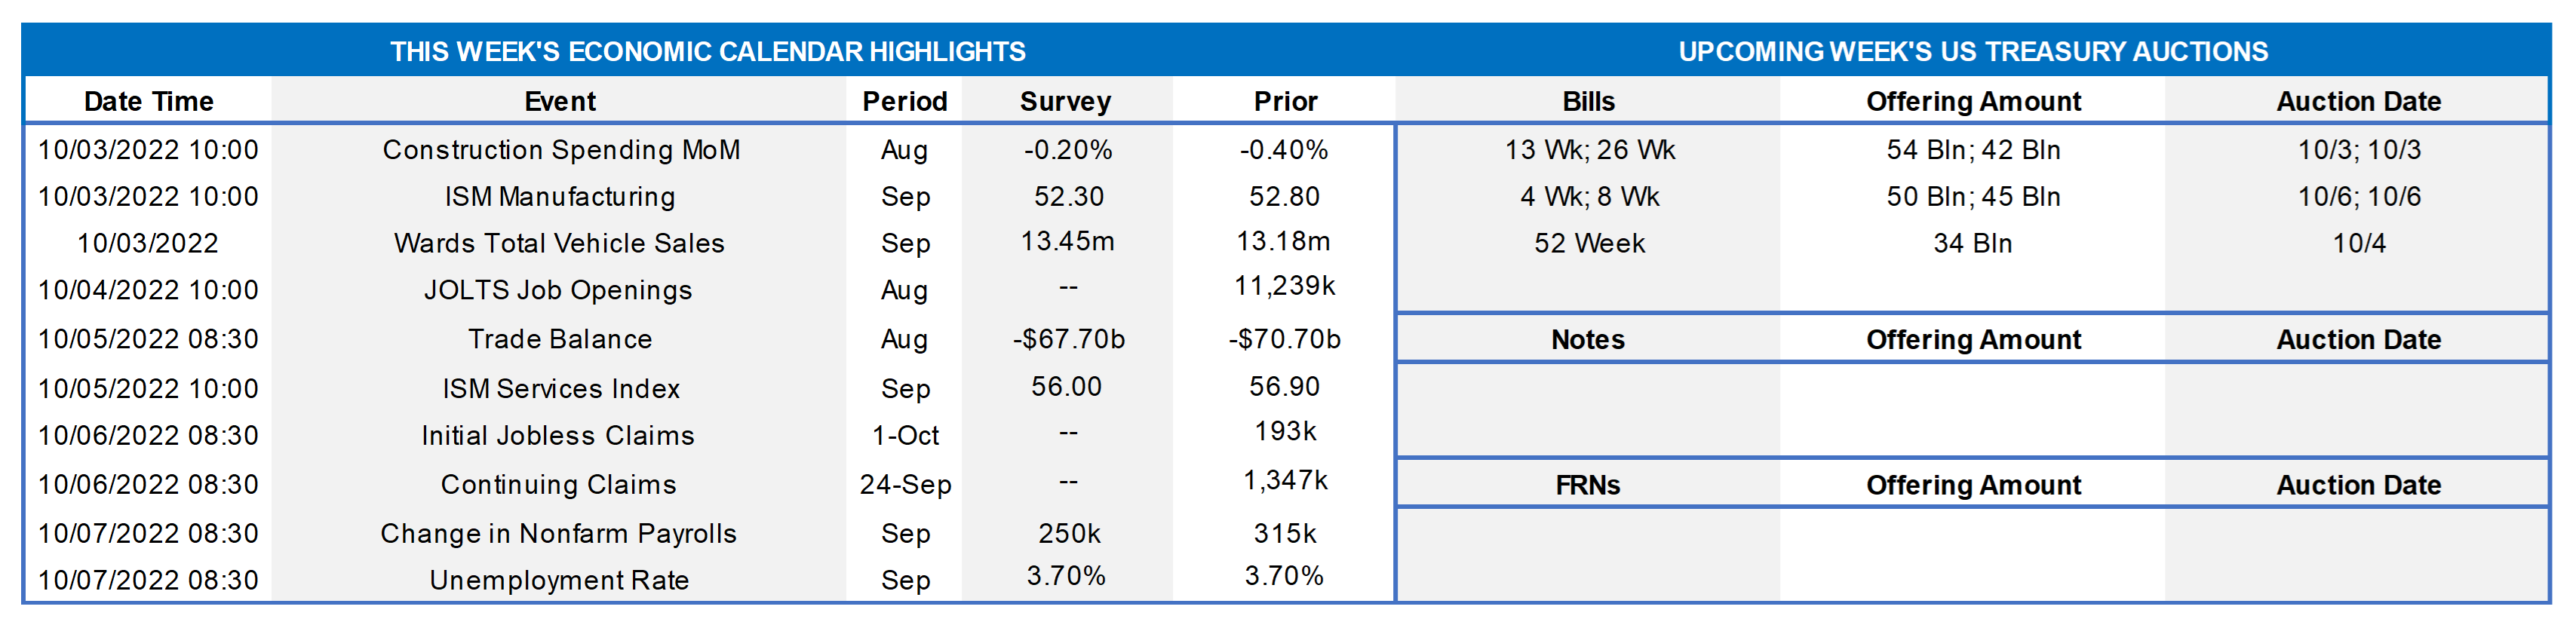
The markets will focus on the upcoming week’s data for clues to the prospective pace of forthcoming changes in monetary policy. Despite the aggressiveness of the current tightening cycle, few signs that the economy is retreating likely are in store. Both manufacturing and service-producing activity probably quickened in September, while motor vehicle sales ended the summer quarter on a high note. Job openings likely narrowed in August. Yet, with almost 1.9 positions available per unemployed person, jobless claims are expected to remain near historic lows. All signs are that last month’s jobs report will exceed consensus expectations. The Fed speaking calendar will be crowded once again, with almost a dozen public appearances scheduled on a variety of topics.
Construction Spending: The nominal value of new construction put-in-place is expected to have remained steady in August, after a .4% prior-month decline. That projection, if realized, would leave construction spending over the July-August span 2% annualized below the second-quarter average, following an 8.7% annualized gain during the spring.
ISM Manufacturing Activity Index: The nationwide manufacturing expansion likely continued as the summer ended. District Federal Reserve Bank canvasses and other surveys hint that the Purchasing Managers Index moved one-half percentage point higher to 53.3% in September.
Motor Vehicle Sales: Buoyed by modest production improvements, unit motor vehicle sales probably climbed by 3.2% to a five-month high seasonally adjusted annual rate of 13.6mn.
JOLTS Job Openings: A reported dip in online help-wanted postings suggests that total job openings retreated by 90K to 11.15mn in August, 710K shy of the 11.86mn record high set last March. Given the 344K rise in civilian unemployment during the reference period, that result would leave the gap between available positions and the jobless at 5.13mn. Put another way, there were likely almost 1.9 jobs available per unemployed person in August.
International Trade Balance: The deficit on international trade probably narrowed slightly to a ten-month low of $69.6bn in August from $70.7bn shortfall recorded in the prior month.
ISM Services Activity Index: Available soundings suggest that service-producing activity accelerated sharply in September. Indeed, the Institute for Supply Management Services Purchasing Managers Index probably jumped from 62% from 56.9% in August – the strongest reading since the end of 2021.
Jobless Claims: New claims for unemployment insurance benefits likely remained in a historically low 190-220K range during the week ended October 23. Continuing claims probably clocked in below the 1.4mn mark during the week ended September 24, supporting the view that recently laid-off employees are having little trouble finding work.
Employment Situation Report: Recent readings on jobless claims suggest that payroll employment growth quickened to 425K in September from the 378K clip witnessed over the June-August span. The decline in the state insured unemployment rate between canvassing periods points to dip in the national jobless rate to the half-century low of 3.5% posted in July. Solid demand for workers amid limited supply likely propelled average hourly earnings .5% higher last month and 5.2% above those received in September 2021.
Federal Reserve Appearances (selected among many):
- Oct. 4 New York Fed President Williams to give opening & closing remarks at an event on workplace culture.
- Oct. 6 Fed Governor Lisa Cook to speak at the Peterson institute for International Economics in Washington.
- Oct. 6 Cleveland Fed President Mester to discuss the outlook at an event hosted by the Council for Economic Education.
- Oct. 7 New York Fed President Williams to take part in moderated Q&A in Buffalo, New York.
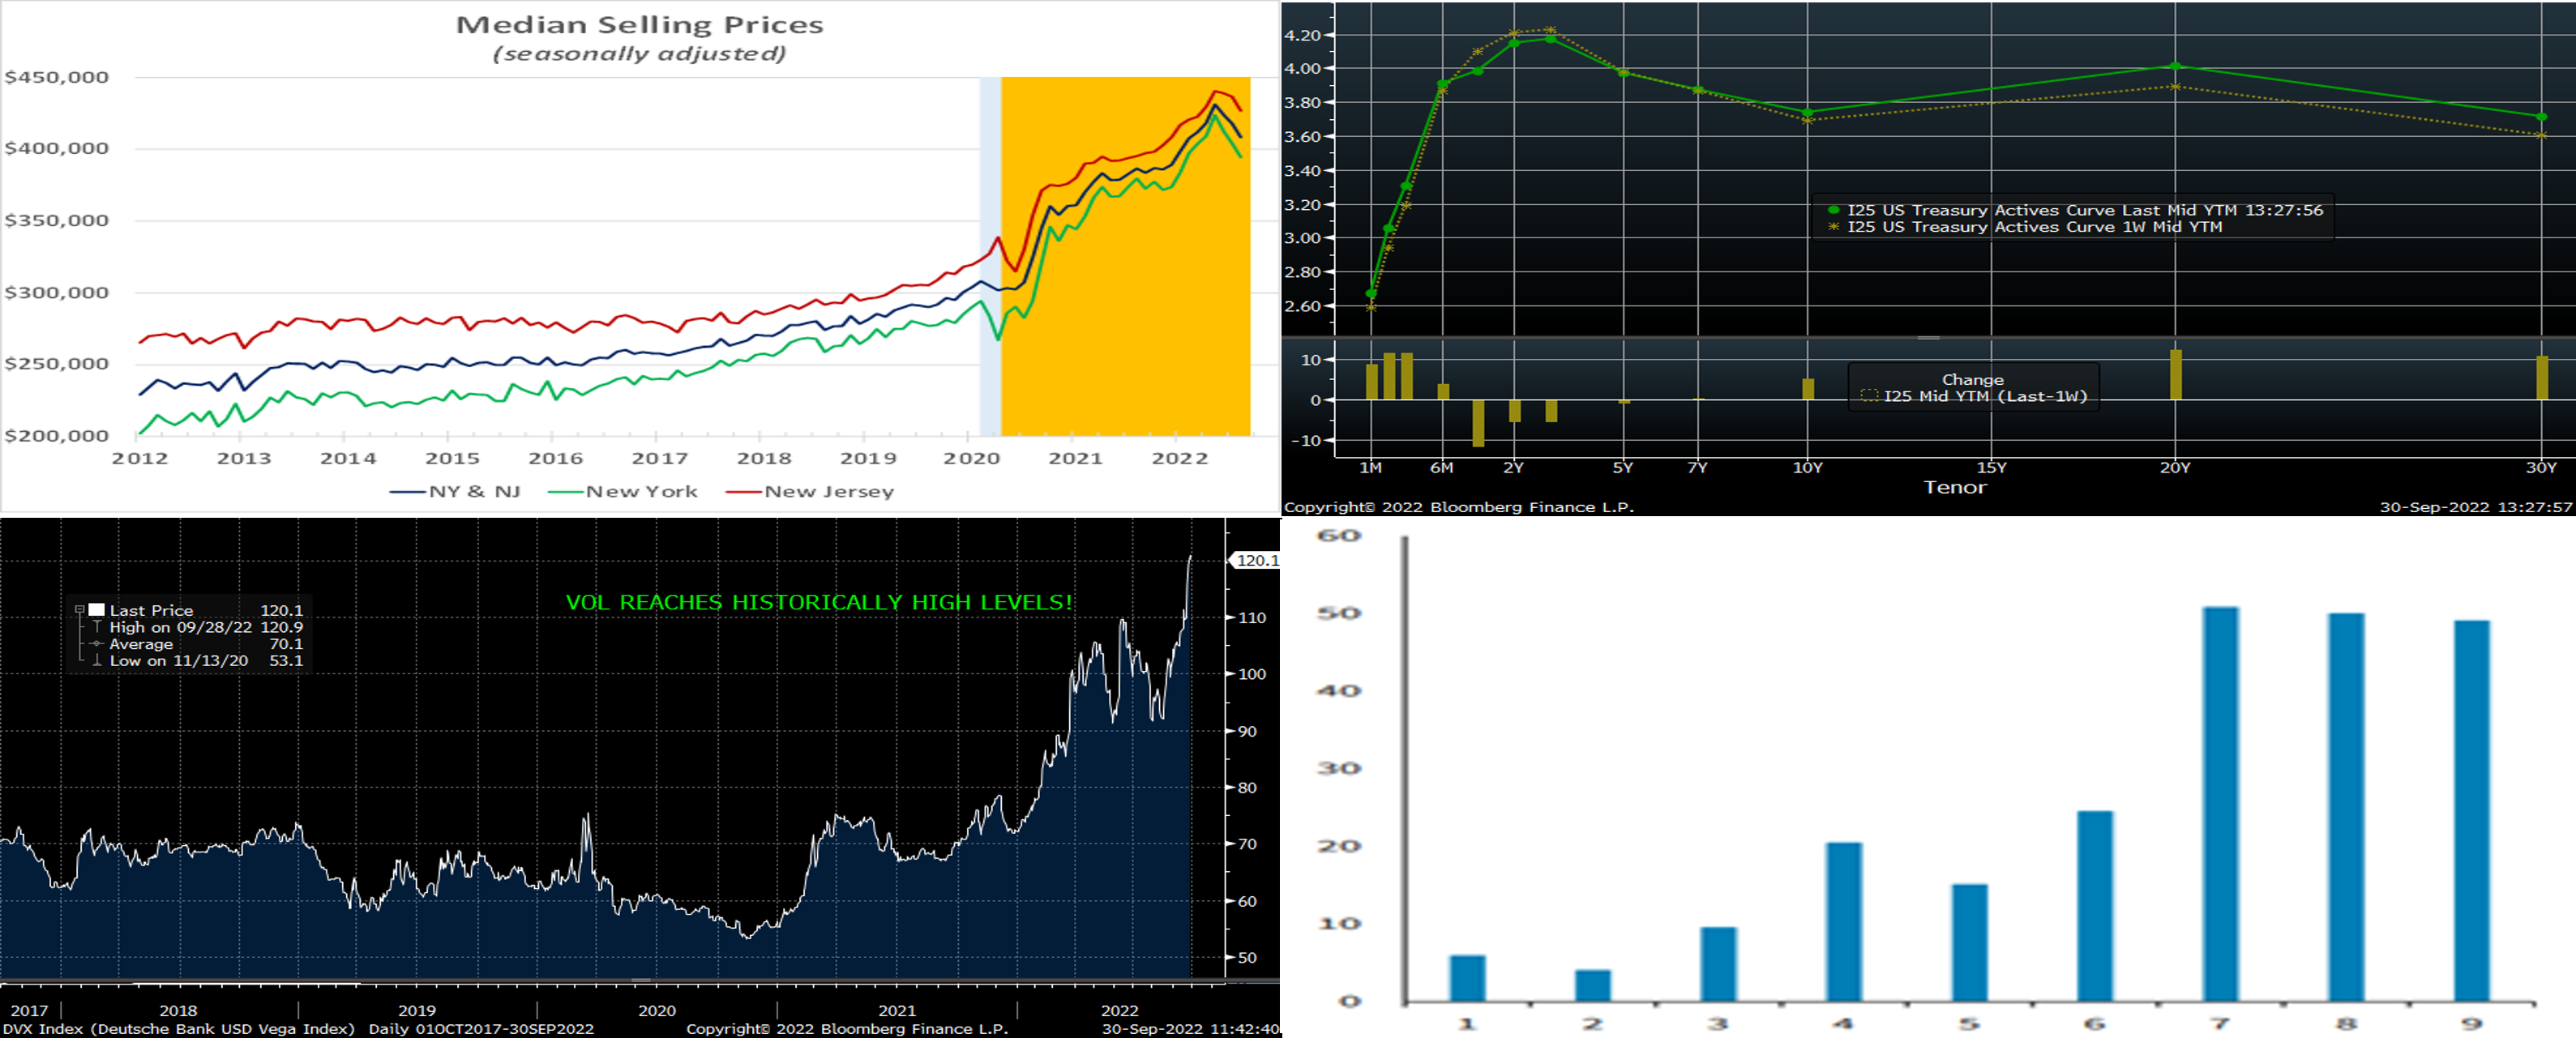
CHART 1 UPPER LEFT
Source: National Bureau of Economic Research, New York State Association of Realtors, NJ Realtors; FHLB-NY. Notes: Blue-shaded areas denote recent recession; orange-shaded areas highlight current economic expansion. Affordability-induced pullbacks in demand have had predictable impacts on home selling prices across New York and New Jersey in recent months. After seasonal adjustment, the median price received by sellers in NY has retreated an estimated 6.9% from its May peak to a little over $394K, while those in NJ have dipped by a more modest 3.1% to $427K. Despite the recent moderations, home prices in NYS and NJ remain 3.9% and 8%, respectively, above those of August 2021, with available dwellings continuing to change hands above posted asking prices. The percentage received above listing prices has, however, turned definitively lower in recent months and could continue that trend in the current interest rate climate.
CHART 2 UPPER RIGHT
Source: Bloomberg. Note: Top pane is yield (%), bottom pane is change (bps). The UST curve, as of Friday afternoon, finished steeper but modestly changed from the week prior, especially given the mid-week volatility that was driven mostly by developments in the UK gilt (government bonds) market. An example of the large mid-week moves was the 5-year SOFR swap which swiftly declined from ~3.92% late Tuesday to 3.68% on Wednesday and subsequently bounced up and down before stabilizing ~3.76% at week’s end. As of this past Friday afternoon and slightly lower from last week even amid persistent hawkish Fed-speak, the market priced for a 100% chance of a 50 bps hike for the November 2 FOMC, with ~50% chance of a 75 bps hike. For 2022 cumulatively from now, the market prices ~113 bps of hikes. The market anticipates further increases to ~4.46% (~24 bps less than implied in last week’s curve) by next May, but, in contrast to Fed officials, still expects the Fed to shift gears beyond that point. The current 4.21% Fed effective rate anticipated by the market at end-2023 is well below the 4.625% median projection in the latest Fed “dot plot.” In this regard, this section of the curve could be the most vulnerable to moves in either direction in response to fresh economic data.
CHART 3 LOWER LEFT
Source: Bloomberg. Emblematic of recent large rate moves and increases in market volatility, shown here is the multi-year high level reached this past week of the Deutsche Bank Vega (DVX) Index. This index is essentially a composite measure of implied volatility (“vol”) on medium-term expiry (1-year-and-out) swaptions. High implied vol levels, all else equal, increase the value of options. This dynamic, in turn, impacts the pricing of our structured embedded-option advances. Note that last week we re-introduced putable/cap/floor products to our product menu. The high implied vol levels have helped soften the blow from higher rates on putable advance levels, as the member is selling optionality in this product. For further information on these dynamics and products, please contact the desk.
CHART 4 LOWER RIGHT
Source: FDIC, Barclays Research. Depicted here is the percentage of each Fed hike that was passed through to bank deposit rates during each rate hike in the 2015-19 cycle. While the “beta” was slim in the earlier hikes, it grew noticeably in the later ones. A similar trend is likely underway in the current cycle. The prospective Fed hike on November 2nd would be the sixth of the current cycle. The Fed, meanwhile, has begun the roll-off of its securities holdings which, in turn, has removed liquidity from the banking system and reduced bank reserves held at the Fed. Money Market Funds have recently gained assets, likely signaling an exodus from bank deposits to higher-yielding alternatives. FHLB-system advance balances have markedly risen in recent months, in response to falling deposit levels. As always, FHLB-NY is here to help members navigate these changing dynamics.
FHLBNY Advance Rates Observations
Front-End Rates
- Short-end rates finished mixed week-over-week, with 1-month-and-in ~7 bps lower but longer tenors up a few bps. The market slightly tamed the odds of more aggressive forthcoming Fed hikes, despite persistent hawkish comments from Fed members. The extreme volatility experienced this past mid-week likely prompted investors to seek safety in ultra-short instruments; indeed, the Fed’s RRP reached a record $2.43trn. As of this past midday Friday and a tad lower from the week prior, the market priced for a 100% chance of a 50 bps hike at the November 2 FOMC, with ~50% chance of 75 bps hike. For 2022 cumulatively from now, the market prices for ~113 bps of hikes.
- Given the Fed’s tightening and data-dependent posture, rates will remain highly responsive to economic data and Fed-speak.
Term Rates
- The longer-term curve finished steeper from the week prior, generally mirroring the move in UST and swaps markets. Whereas 2-year was ~5 bps lower, 10-year was ~10 bps higher. Kindly refer to the previous section for relevant market color. The advance curve remains extremely flat overall and inverted at various points, thereby offering opportunities to extend in advance duration for minimal or lower coupon cost.
- On the UST term supply front, this upcoming week offers a reprieve from auctions. Market focus will be keenly trained on Fed-speak and economic data, especially Friday’s jobs report. Please call the desk for information on market dynamics, rate levels, or products.
Product Alert: FHLBNY is pleased to announce the reintroduction, after a temporary suspension owing to Libor-cessation, of the Putable Advance, Fixed-Rate with SOFR Cap Advance, and ARC with SOFR Cap/Floor Advance. The Callable Advance continues to be offered. This expansion of the product menu will provide members with more options and flexibility for the management of funding and/or hedging needs. Please call the Member Service Desk at (212) 441-6600 for more information.
Forward Start Advance (FSA): For members with upcoming borrowing or refunding plans, consider the FSA as a method to opportunistically “lock in” rates before advance settlement date. Please call the Member Service Desk at (212) 441-6600 for more information.
The Symmetrical Prepayment Advance Feature
With rates at or near multi-year lows, it is a compelling juncture to use the SPA feature on term advances. This feature allows member to capture, at prepayment, changes in the Fair Value of the advance which are favorable to the member. Contact us to discuss.
Looking for more information on the above topics? We’d love to speak with you!
Questions?
If you wish to receive the MSD Weekly Market Update in .pdf format (includes FHLBNY rate charts) or to discuss this content further, please email the MSD Team.