Member Services Desk
Weekly Market Update
This MSD Weekly Market Update reflects information for the week ending April 14, 2023.
Economist Views
Click to expand the below image.
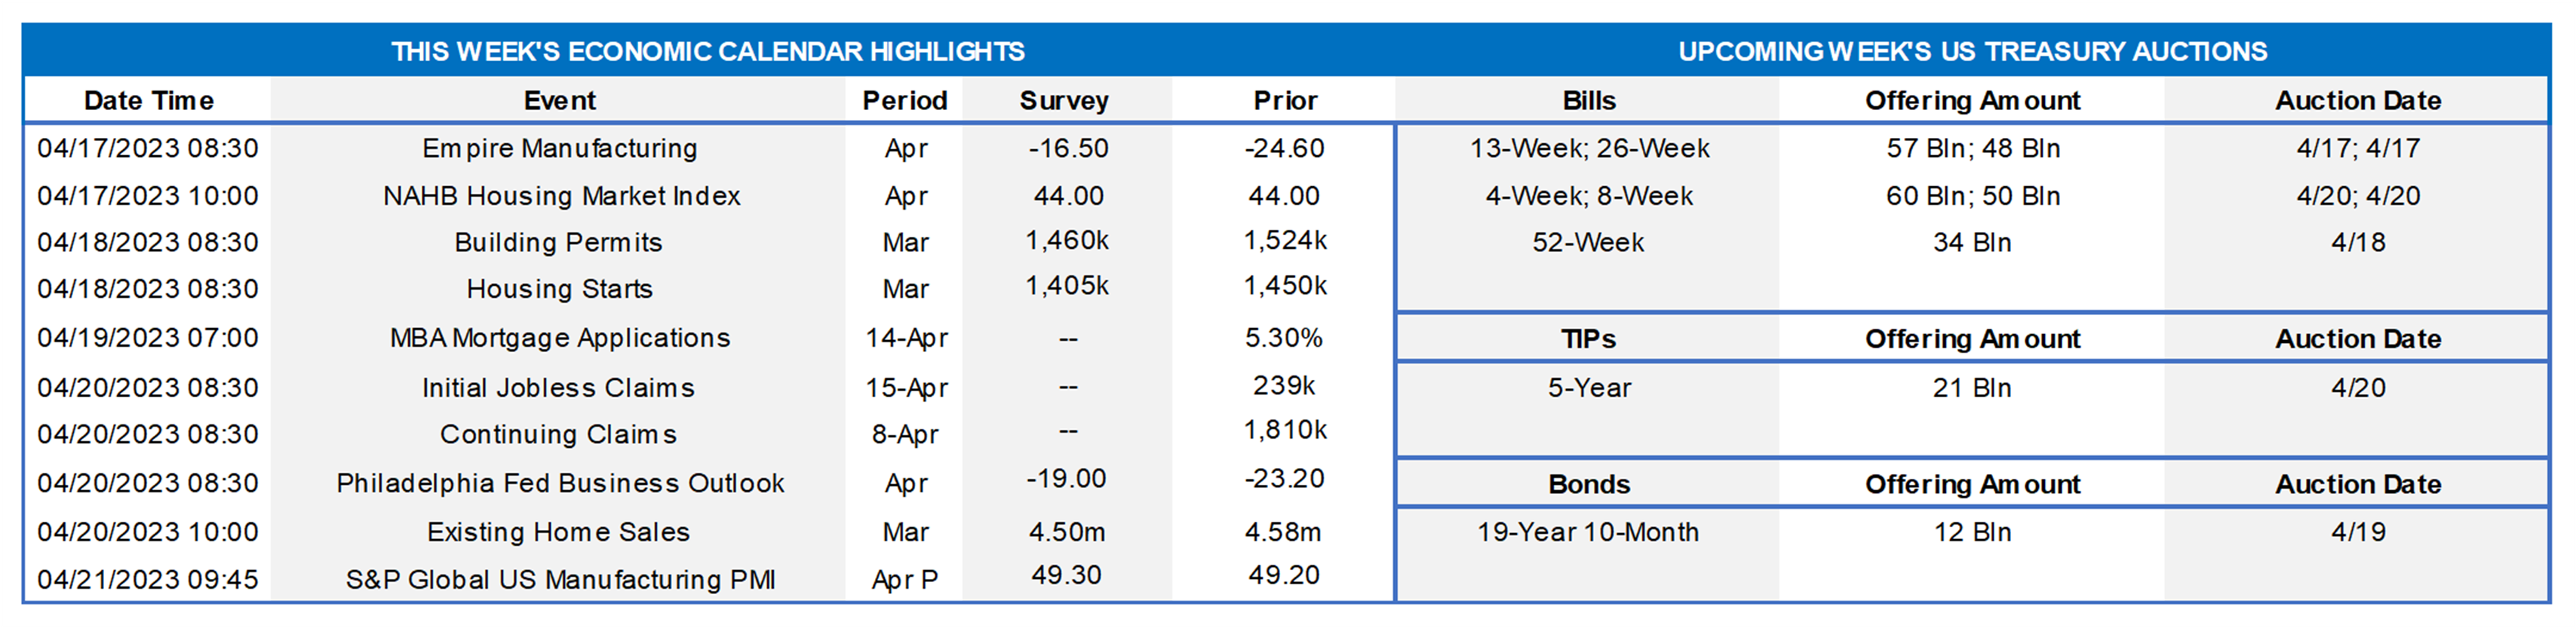
With the heart of the statistical order for April in the rear-view mirror, markets will turn their sights to updates on housing activity and local business conditions. While forthcoming soundings on builder sentiment and existing home sales likely improved on prior-month readings, inclement weather conditions probably limited new residential investment activity in March. Manufacturing and service-producing activity both likely contracted further in April, although the pace of deterioration is expected to ebb from March’s reported clip. The Beige Book will provide useful color on national and regional activity heading into the May 3 FOMC meeting, while a trio of Federal Reserve officials will give their views on economic and financial conditions.
Empire State Manufacturing Survey: Manufacturing activity in New York State probably contracted for a fifth straight month in April. The extent of the anticipated falloff is expected to narrow from March’s reported breadth, with the general business conditions diffusion index rising by six percentage points to -18.6%.
NAHB Housing Market Index: Home-builder sentiment probably improved in response to recent reductions in mortgage interest rates. Indeed, it would not be surprising to see the National Association of Home Builders’ confidence barometer return to a neutral 50-point reading in April from 44 in the preceding month.
Housing Starts & Building Permits: Unusually poor weather conditions in the West likely hampered new residential building activity in March. Indeed, given the vast divergences from seasonal norms, median Street projections for a 3.5% decline in housing starts to a seasonally adjusted annual rate of 1.4mn and a 5.5% drop in permit issuance to 1.47mn probably will prove too optimistic.
New York Fed Services Business Activity Survey: Service-producing activity across New York State, Northern New Jersey and Southwestern Connecticut probably ebbed for a seventh consecutive month in April, although the current business conditions diffusion index likely improved slightly from March’s -10.1% reading.
Jobless Claims: Initial claims for unemployment benefits probably remained within the recent 225-250K range during the filing period ended April 15. Keep an eye on continuing claims for additional signs that recently furloughed employees may be having a tougher time finding work.
Existing Home Sales: Home-purchase contract signings over the January-February span suggest that closings on existing dwellings rose by 2.2% to a six-month high SAAR of 4.68mn in March. With the number of homes on the market expected to jump by 9.2% to 1.07mn at the start of the traditional spring buying season, the months’ supply at the estimated sales pace probably edged one tick higher to 2.7 months.
Leading Index: Available data suggest that the Conference Board’s barometer of prospective economic activity slipped by .3% for a third straight month in March.
Federal Reserve Appearances:
- Apr. 19 Federal Reserve to release Beige Book commentary on national and regional economic conditions.
- Apr. 20 Fed Governor Christopher Waller to speak at Global Interdependence Center in Sarasota, FL.
- Apr. 20 Cleveland Fed President Mester to discuss the economic outlook at an event hosted at the University of Akron.
- Apr. 20 Atlanta Fed President Bostic to discuss regional and national economic conditions at Eastern Florida State College.
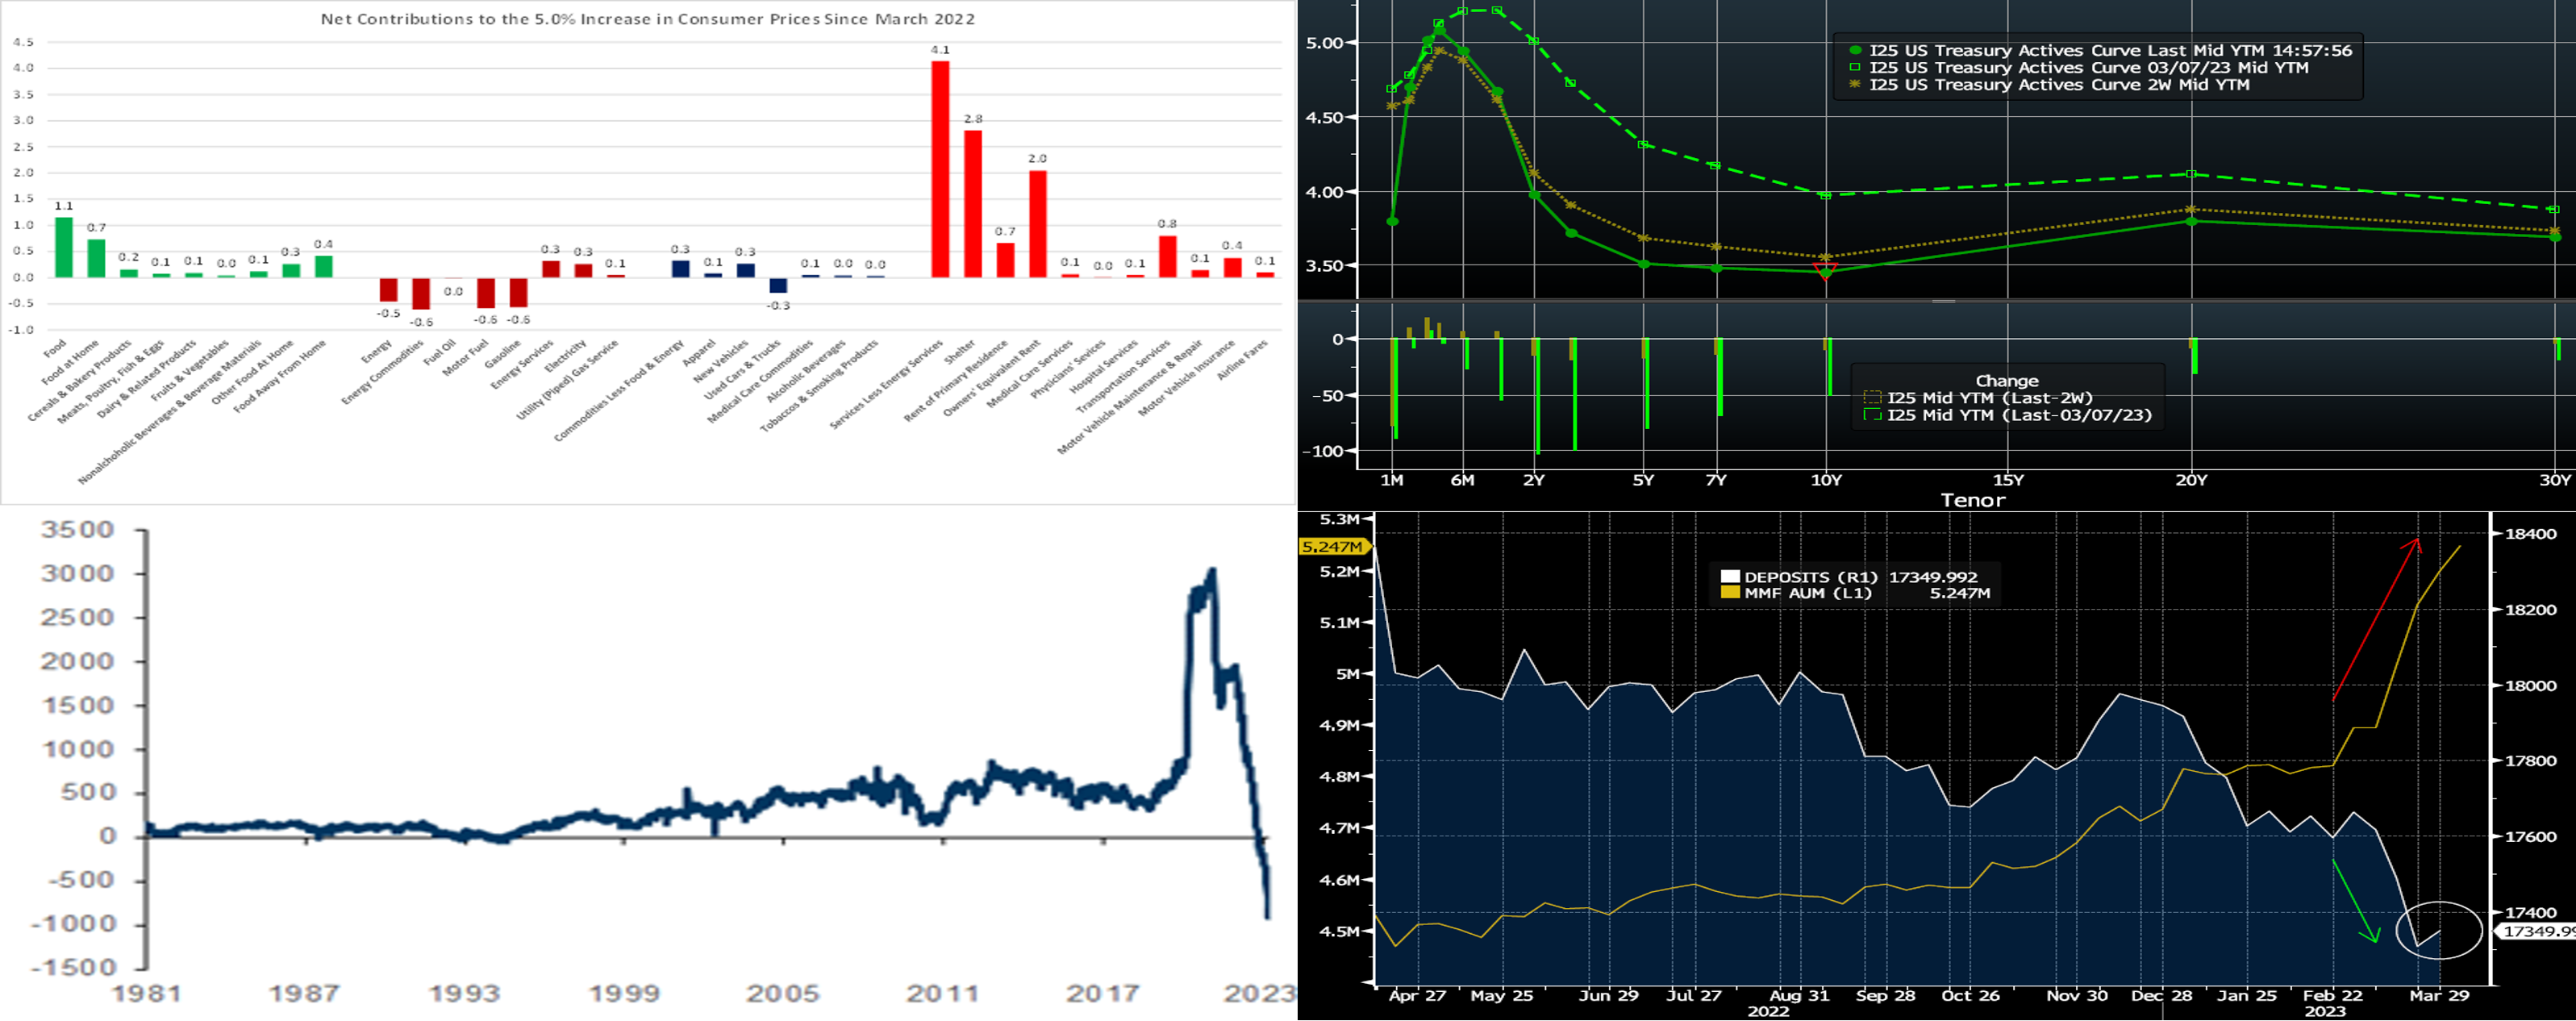
CHART 1 UPPER LEFT
Source: Bureau of Labor Statistics; FHLB-NY. Reported this past Wednesday, consumer prices edged .1% higher in March, while the core gauge, excluding food and energy components, climbed by .4%. While both increases were in line with median Street projections, the details of the Bureau of Labor Statistics’ (BLS) report were encouraging, with food and shelter costs – the major drivers of the 5% hike in the Consumer Price Index (CPI) over the latest 12 months – showing restraint. A tug of war between higher restaurant meal costs and lower grocery prices left the CPI food barometer unchanged in March, ending a run of uninterrupted increases going back to November 2020. Smaller hikes in rental rates and owners’ equivalent rent of residences capped the rise in shelter costs at .6%, down from the .8% jump posted in February and the smallest increase in five months. Further decelerations in this key component, which accounts for 34.5% of the overall CPI and 43.4% of the core subindex, likely are in store in the months ahead, as falloffs in home prices and apartment rental rates work their way through the BLS’ sample.
CHART 2 UPPER RIGHT
Source: Bloomberg. Top pane is yield (LHS, %), bottom pane is change (bps). From our last edition two Thursday afternoons ago to this, UST yields were lower in the 2-year-and-out sector, with the 2 to 5-year zone down ~15 to 18bps to lead the move. Economic data has generally reflected some moderation in inflationary forces and a bit of loosening in the job market, albeit perhaps not enough to dissuade the Fed from another hike. The latest FOMC Minutes revealed concern about recent banking industry events and a potential “credit crunch” and a higher chance of a mild recession beginning late this year. In this regard, the Fed’s hike path could be close to an end and hence the decline in term yields. As of this Thursday afternoon’s writing, the market prices the odds of a 25 bps hike at the May 3rd FOMC at ~73%, and June, at ~5.015%, is the peak rate on the short-end forward curve. The year-end forward is ~4.33%, and so Fed easing is certainly priced in but to a less extreme extent than during the turmoil a few weeks ago. Please call the desk for further information on market dynamics and/or products.
CHART 3 LOWER LEFT
Source: Goldman Sachs Research; Federal Reserve. Here is longer-term historical perspective on US bank deposits; charted is the rolling 1-year change (LHS, $bn) in deposits. Annual deposit growth has rarely been negative, and the recent decline is easily the largest drop on record. It should be noted that this decline followed the huge upsurge following the pandemic and subsequent fiscal and legislative relief programs; these measures essentially added funds to the financial system and thereby bolstered deposits, but they have faded since then. For instance, the Fed’s “Quantitative tightening” (basically reversing/shrinking its holdings of securities) has reduced funds in the system. Another contributor to deposit loss was also likely the result of outflows from the banking system to Money Market Funds (MMFs). Although much of the MMF inflows occurred in the past month, retail investor flows into MMFs have trended steadily higher as the Fed has hiked rates and pre-dated the recent banking system concerns. The system-wide deposit erosion seen since last year appears likely to continue unless banks begin to more aggressively compete for these funds.
CHART 4 LOWER RIGHT
Source: Bloomberg. Here can clearly be seen the recent decline in bank deposits (White, RHS, $bn) and an upsurge in MMF AUM (Gold, LHS, $trn). In addition to ongoing retail flows into MMFs, institutional investors heavily moved funds into this “safe-harbor” sector since mid-March. This surge of flows into MMFs has helped tighten spreads on FHLB paper in recent weeks and, in turn, benefited our advance levels. On a positive note regarding deposits, circled in the chart, they up-ticked at month’s end. Last month’s turmoil has moderated greatly since then.
FHLBNY Advance Rates Observations
Front-End Rates
- Short-end rates were unchanged to a bit lower from our last publication on 3/30. While the very shortest tenors 3-week-and-in were 5 to 7 bps lower, 2-month-and-out were unchanged or up/down by a bp. The severe market turbulence of last month has abated and thereby allowed for much better FHLB issuance levels and, in turn, more favorable advance levels in the shorter tenors. As covered in the previous section, MMF AUM levels continue to rise, and these vehicles invest in the Fed’s RRP as well as T-bills and agency paper.
- Economic data and Fed-speak should dictate direction this week. See the previous slide for specific color on the market’s pricing of the Fed.
Term Rates
- The longer-term curve, generally mirroring moves in USTs and swaps, was lower in the 2 to 10-year sector by 17 to 21 bps. The 3-year led the move, down by ~21 bps. Kindly refer to the previous section for relevant market color. The advance curve remains inverted out to 5-year, thereby offering opportunities to extend in advance duration at lower coupon cost.
- On the UST term supply front, this upcoming week serves a 20-year nominal and a 5-year TIPS auction. Please contact the desk for further information on market dynamics, rate levels, or products.
Product Alert: FHLBNY is pleased to announce the reintroduction, after a temporary suspension owing to Libor-cessation, of the Putable Advance, Fixed-Rate with SOFR Cap Advance, and ARC with SOFR Cap/Floor Advance. The Callable Advance continues to be offered. This expansion of the product menu will provide members with more options and flexibility for the management of funding and/or hedging needs.
Forward Start Advance (FSA): For members with upcoming borrowing or refunding plans, consider the FSA as a method to opportunistically “lock in” rates before advance settlement date. Please contact the Member Services Desk at (212) 441-6600 for more information.
The Symmetrical Prepayment Advance Feature
For those anticipating term funding needs, and with rates on an uptrend, it can be an appropriate juncture to consider our SPA feature. This feature allows the member to capture, at prepayment, changes in the fair value of the advance which are favorable to the member. Contact Member Services Desk to discuss.
Looking for more information on the above topics? We’d love to speak with you!
Questions?
If you wish to receive the MSD Weekly Market Update in .pdf format (includes FHLBNY rate charts) or to discuss this content further, please email the MSD Team.