Member Services Desk
Weekly Market Update
This MSD Weekly Market Update reflects information for the week ending May 19, 2023.
Economist Views
Click to expand the below image.
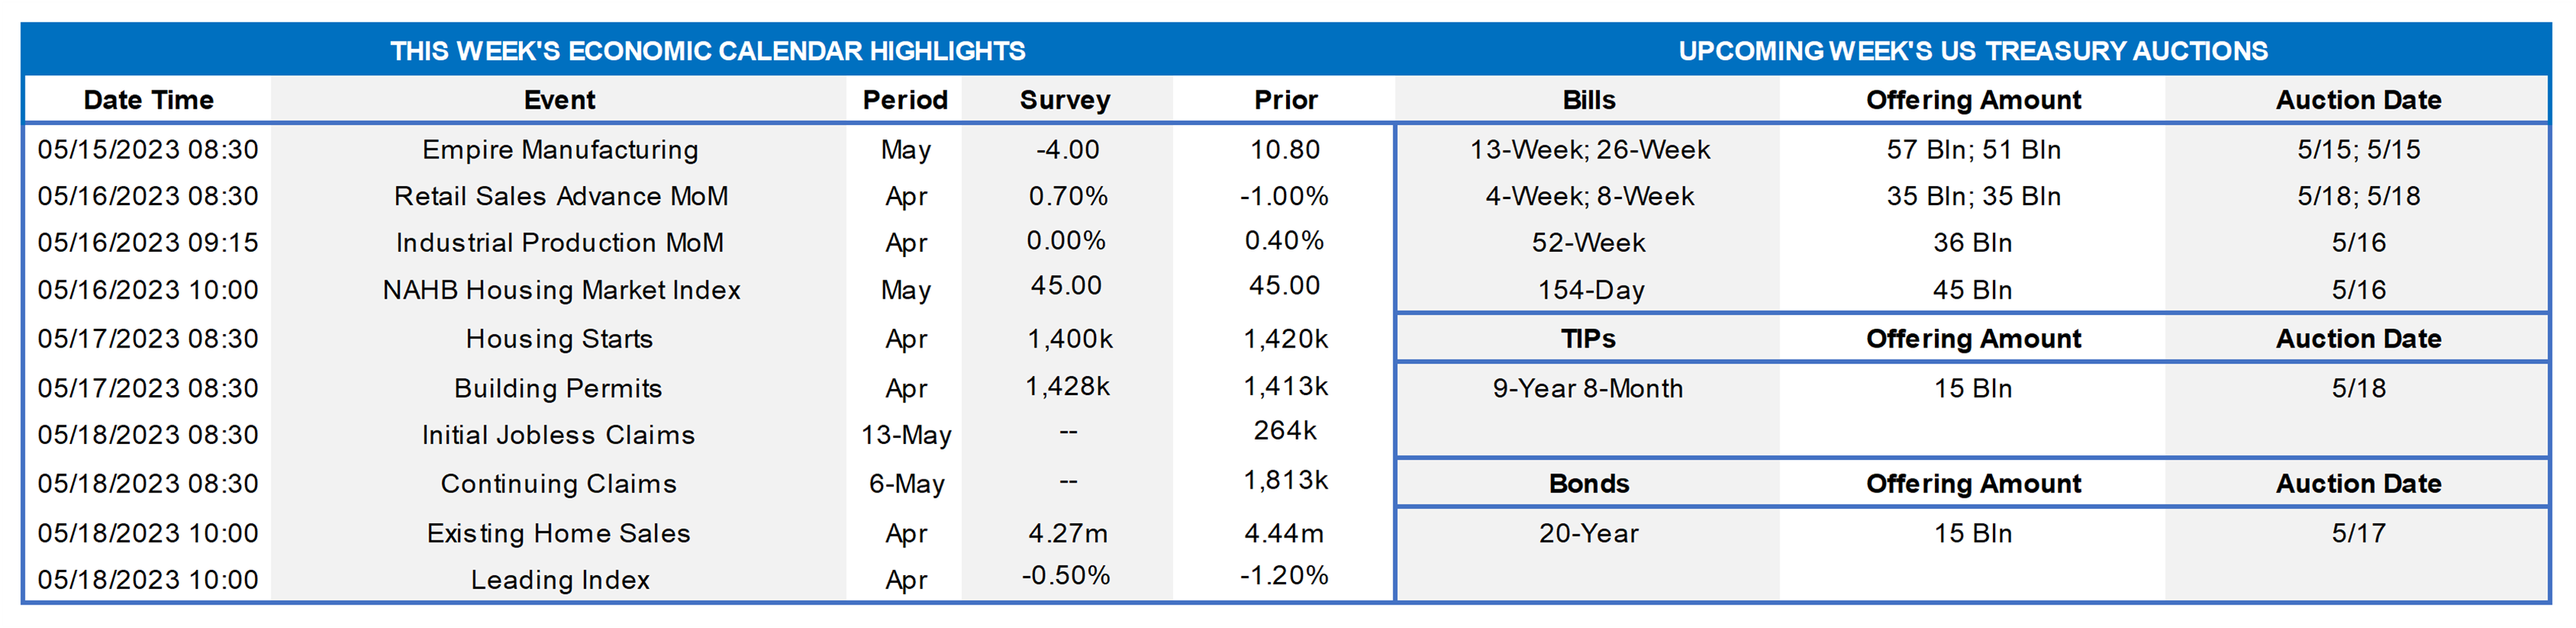
Market participants will weather a crowded economic calendar this upcoming week. Reports on retail sales, industrial production, and housing activity in April will allow economists to update their tracking estimates for spring-quarter real GDP growth. The Street currently anticipates little change in inflation-adjusted activity over the April-June span, but the range of projections is extremely wide, as is often the case early in a quarter. Public speaking engagements by a half dozen Federal Reserve officials will be closely watched for their thoughts on monetary policy prospects.
Empire State Manufacturing Survey: Factory activity in New York State is expected to have contracted in early May after a surprising prior-month expansion. The headline general business conditions index – the percentage of respondents experiencing a pickup in activity less those witnessing a decline – is expected to clock in at -5% from 10.8% in April.
Retail & Food Services Sales: Powered by an anticipated jump in auto dealer revenues, retail, and food services sales probably climbed by 1.2% in April, erasing all but a fraction of the 1.4% decline witnessed over the February-March span. Excluding the projected pop in auto sales, retail purchases are expected to have climbed by .6%, recouping all the prior-month .4% decline. Market participants will pay attention to so-called “control” sales, excluding auto, building materials, and gas purchases, for clues to consumer spending as the spring quarter began. Barring any prior-month revisions, the .4% rise anticipated by the Street would place core purchases in April 1% annualized above their January-March average, after a 5.6% annualized winter-quarter gain.
New York Fed Business Leaders Survey: Service-producing activity across New York State, Northern New Jersey, and Southwestern Connecticut probably ebbed for an eighth straight month in May, although the current business conditions diffusion index likely improved slightly from April’s -9.8% reading.
Industrial Production & Capacity Utilization: Output at the Nation’s factories, mines, and utilities probably stalled in April, ending a string of three consecutive monthly increases. With production expected to outpace additions to capacity during the reference period, the overall operating rate likely moved a tick lower to 79.7%.
NAHB Housing Market Index: Home-builder sentiment probably was little changed in early May, leaving this confidence barometer below the neutral 50-point mark for a tenth consecutive month.
Housing Starts & Building Permits: Buoyed by drier weather conditions, the number of issued building permits and housing units begun likely rose from their respective seasonally adjusted annual rates (SAAR) of 1.43mn and 1.42mn in March.
Existing Home Sales: Home-purchase contract signings over February-March suggest that closings slipped by 2.5% to a three-month low SAAR of 4.33mn in April. With the number of homes on the market expected to jump by 8.5% to 1.09mn at the start of the traditional spring buying season, the months’ supply at the estimated sales pace probably edged four ticks higher to 3 months.
Leading Indicators: Available data suggest that the Conference Board’s augur of prospective economic activity slipped by .5% in April, after a larger-than-expected 1.2% drop in March. The anticipated decline, if realized, would continue a string of negative results going back to March of last year.
Federal Reserve Appearances:
- May 16 Cleveland Fed President Mester to discuss the outlook at an event hosted by the Central Bank of Ireland in Dublin.
- May 16 New York Fed President Williams to take part in a discussion on the outlook at the University of the Virgin Islands.
- May 19 Fed Chair Powell and former chair Bernanke to take part in a discussion at above Federal Reserve conference.
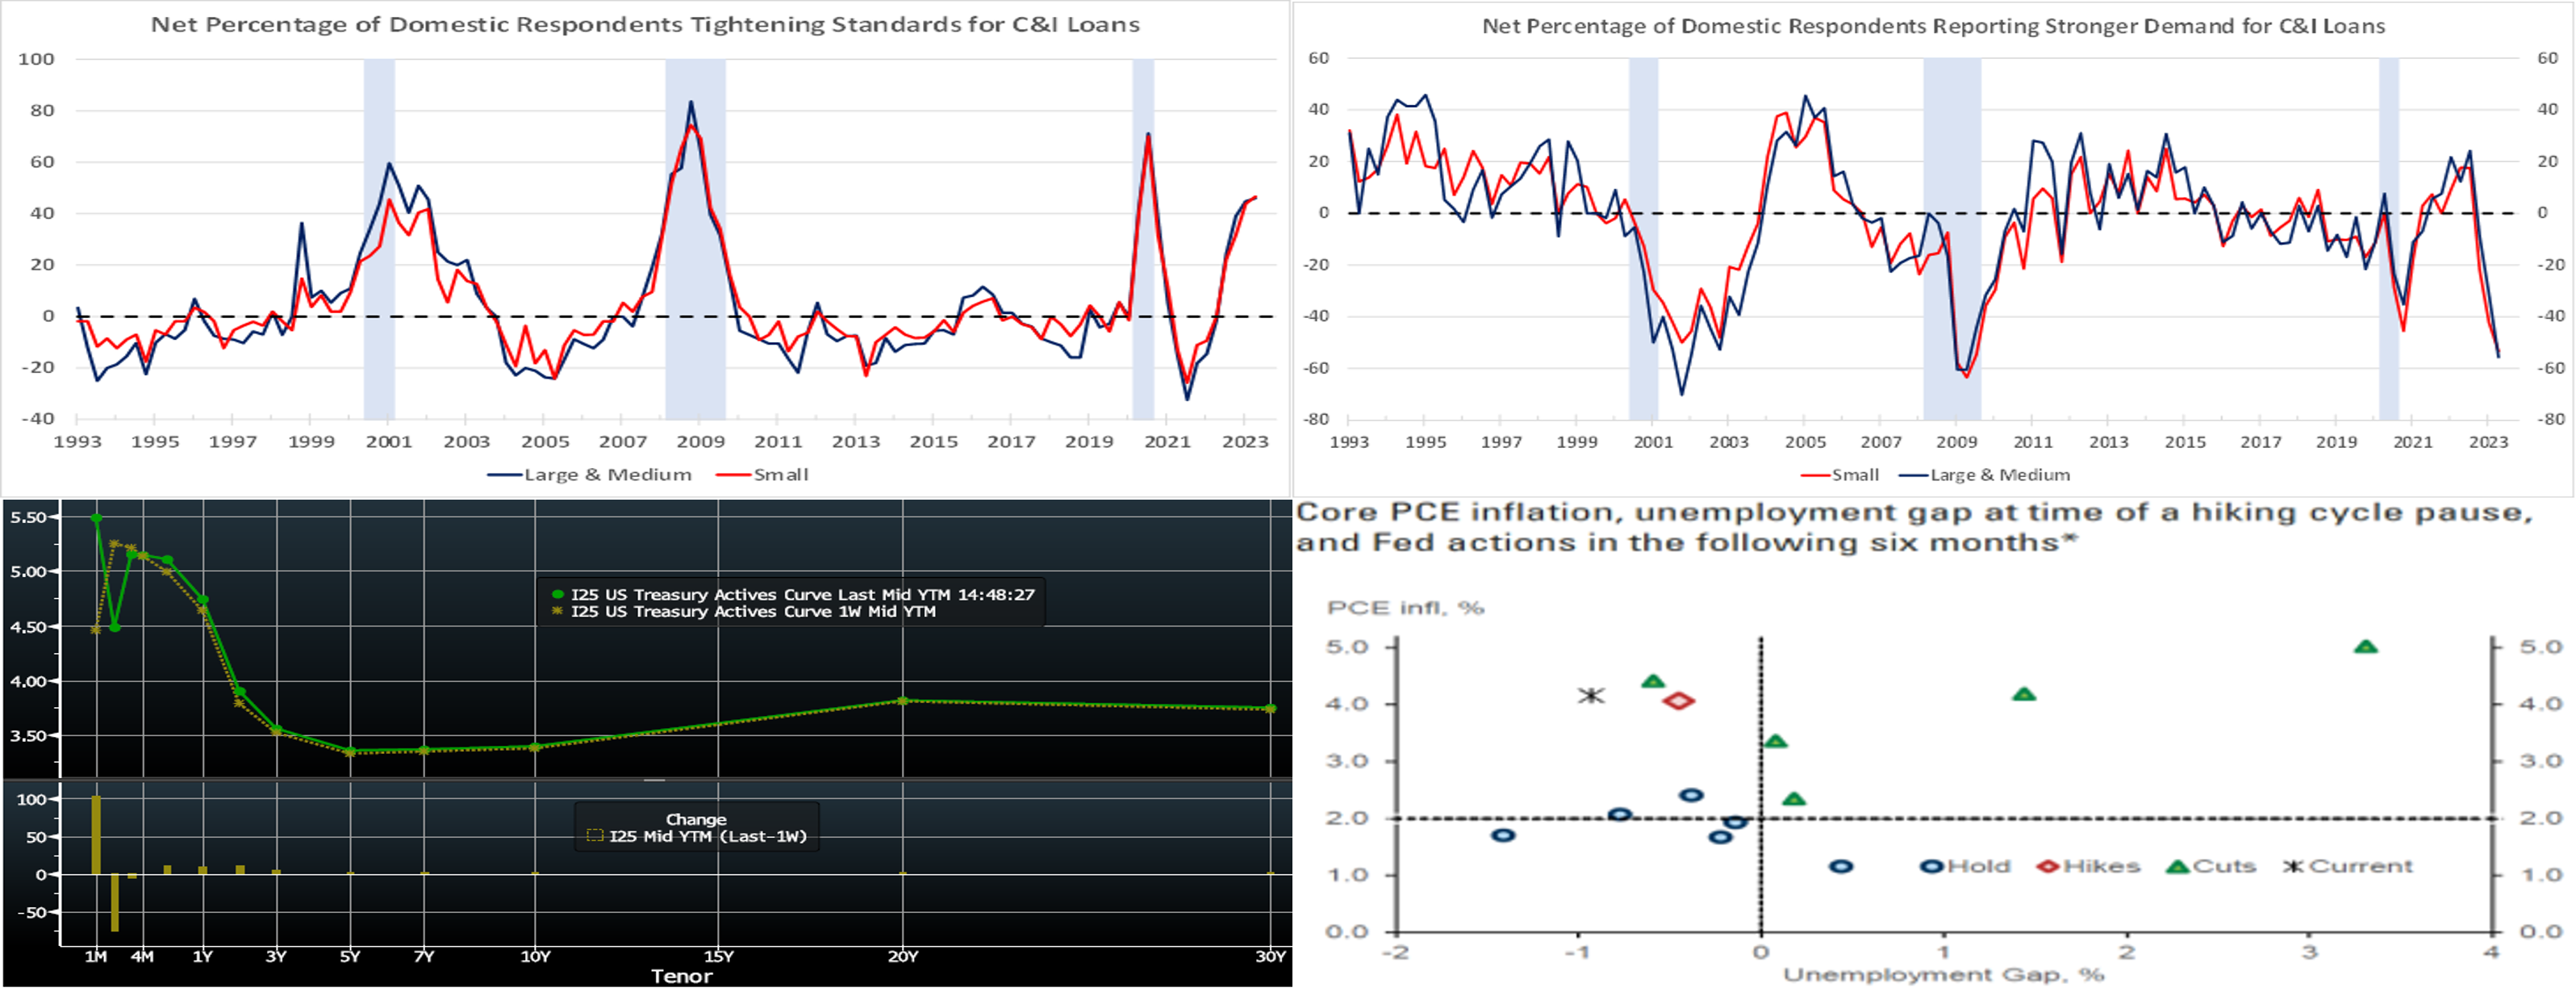
CHART 1 UPPER LEFT
Source: Federal Reserve Board; National Bureau of Economic Research; FHLB-NY. Note: Shaded areas denote recessions. The Federal Reserve Board’s April 2023 Senior Loan Officer Opinion Survey on Bank Lending Practices, or SLOOS, revealed a further tightening of standards across all loan categories during the winter quarter. The net percentages of commercial bank loan officers reporting tighter lending standards for Commercial & Industrial loans to large & medium and small firms clocked in at 46.0% and 46.7%, respectively, during the reference period, marking the broadest firming in practices since the spring of 2020.
CHART 2 UPPER RIGHT
Source: Same as above. Further from the above-cited report, the diffusion of demand for loans from large and medium companies contracted further in the latest canvass, dipping to -55.6% from 31.3% in January – the weakest reading since the winter of 2009. Demand for loans from smaller firms also deteriorated during the first quarter of 2023, with the relevant diffusion measure falling from -42.2% to -53.3%, also marking the softest result in 14 years. In sum, the SLOOS report portrayed a backdrop of tightening credit and weakening demand, and surely the Fed will monitor and incorporate these developments in its policy formulations.
CHART 3 LOWER LEFT
Source: Bloomberg. Bloomberg. Top pane is yield (LHS, %), bottom pane is change (bps). From last Thursday afternoon to this one, with some up and down travels along the way, UST term yields finished modestly higher and the curve flatter. The 2-year was ~11 bps higher, 3-year ~10 bps higher, and the rest of the curve up by a few bps. As can be seen here, T-bill yields at the very front-end of the curve have experienced some wild moves owing to the debt ceiling topic. Economic data this week reflected some potential cooling of inflationary forces and job market trends, thereby allowing yields to dip on Wednesday/Thursday. As of this Thursday afternoon’s writing, the market prices the odds of a 25 bps hike at the June 14th FOMC at ~5%, after earlier in the week pricing in a mild chance of a cut. A cumulative 100% probability of a 25 bps cut is priced for the September 20th FOMC. The year-end Fed Funds forward is ~4.30%, ~15 bps higher than last week. All is subject to change, given the fluid market conditions. Please call the Member Services Desk for further information on market dynamics and/or products.
CHART 4 LOWER RIGHT
Source: Goldman Sachs Research; Haver Analytics. As cited above, the market currently prices for Fed cuts this year. But many economists/strategists offer counter-arguments to this view based on history and inflation/employment metrics. This chart reflects the results of a Goldman Sachs analysis, over the past four decades, of the Fed’s behavior in the six-month periods after halts in hiking cycles. It found that the Fed rarely eased when labor markets were tight. Surprisingly, this mattered more than any shifts in inflation. Indeed, the most common outcome has been an “on-hold” Fed. In contrast, periods with material deterioration in labor markets have more reliably resulted in Fed rate cuts. Overall, the findings reveal that when job markets are “tight” (meaning a low unemployment gap, i.e., towards the left side of the x-axis), as it is at the current juncture, pauses tend to become extended. It’s only when employment is seriously deteriorating (on the right side of the chart) that the Fed pivots swiftly to cuts. Given this context, some of the Fed cuts currently priced into the curve may be the result of the market pricing a small probability of larger (50 bps+) cuts, potentially in reaction to “emergency” conditions spurred by banking industry and/or debt ceiling concerns. (For inquisitive types, the unemployment gap is generally defined as the difference between the actual unemployment rate and the efficient unemployment rate.)
FHLBNY Advance Rates Observations
Front-End Rates
- Short-end rates were mixed from a week ago, with 1-month-and-in a few bps lower but 3-month-and-out a few higher. The dynamic of strong investor demand in the very short-end sector, much of it driven by increasing money market fund (MMF) AUM inflows, has helped our levels in that area. Please see the previous section for color on Fed pricing.
- Fed-speak and economic data should dictate rates direction; in particular, the latter should assume a top role now that the Fed appears to be in data-dependent mode.
Term Rates
- The longer-term curve week-on-week, generally mirroring moves in USTs and swaps, was higher and flatter, with 2 and 3-year up ~12 bps and 5-year up ~5 bps. Advance demand in these sectors perked up post the mid-week’s gentler-than-expected inflation data. Kindly refer to the previous section for relevant market color. The advance curve remains inverted out to 5-year, thereby offering opportunities to extend in advance duration at lower coupon cost.
- On the UST term supply front, this upcoming week serves a 20-year nominal and a 10-year TIPS auction. Please contact the Member Services Desk for further information on market dynamics, rate levels, or products.
Product Alert: FHLBNY is pleased to announce the reintroduction, after a temporary suspension owing to Libor-cessation, of the Putable Advance, Fixed-Rate with SOFR Cap Advance, and ARC with SOFR Cap/Floor Advance. The Callable Advance continues to be offered. This expansion of the product menu will provide members with more options and flexibility for the management of funding and/or hedging needs.
Forward Start Advance (FSA): For members with upcoming borrowing or refunding plans, consider the FSA as a method to opportunistically “lock in” rates before advance settlement date. Please contact the Member Services Desk at (212) 441-6600 for more information.
The Symmetrical Prepayment Advance Feature
For those anticipating term funding needs, and with rates on an uptrend, it can be an appropriate juncture to consider our SPA feature. This feature allows the member to capture, at prepayment, changes in the fair value of the advance which are favorable to the member. Contact Member Services Desk to discuss.
Looking for more information on the above topics? We’d love to speak with you!
Questions?
If you wish to receive the MSD Weekly Market Update in .pdf format (includes FHLBNY rate charts) or to discuss this content further, please email the MSD Team.