Member Services Desk
Weekly Market Update
This MSD Weekly Market Update reflects information for the week of September 26, 2022.
Economist Views
Click to expand the below image.
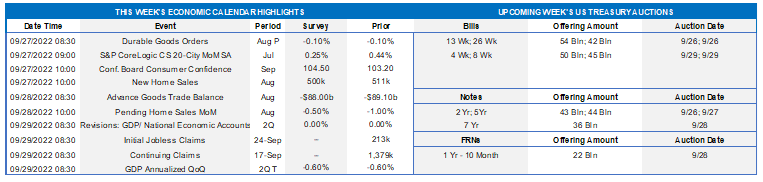
Having weathered the outcome of the latest FOMC meeting and digested policymakers’ refreshed projections for the prospective path of the federal funds rate and key economic variables, market participants will contend with busy economic data and central-banker speaking calendars. The former likely will be decidedly mixed. Home prices probably dipped in July for the first time in over a decade. New home sales are expected to have rebounded last month, while pending sales of existing dwellings retreated. Consumer sentiment likely improved, while new jobless claims remained in their recent range. Annual revisions to real GDP data, which may reveal that the economy did not contract in Q1 and Q2, will undoubtedly be the most closely watched figures. No longer constrained by the pre-FOMC meeting blackout period, Federal Reserve officials will make over a dozen public appearances on a variety of topics.
Durable Goods Orders: Trimmed by an anticipated pullback in transportation equipment bookings, a dip of .1% is expected in August, after a similar modest dip in July. Excluding the projected decline in transport requisitions, “hard goods” bookings likely edged .3% higher during the reference period, after a .2% prior-month gain.
S&P CoreLogic Case-Shiller (SPCLCS) 20-City Home Price Index: Home prices probably dipped by .5% across the twenty major metropolitan areas canvassed by SPCLCS in July, marking the first month-to-month decline since March 2012. Despite the anticipated reduction, home selling prices would remain a sizable 16.5% above those recorded 12 months earlier.
Conference Board Consumer Confidence: Healthy labor market conditions likely buoyed consumers’ appraisals of current and prospective economic conditions in September, propelling the Conference Board’s sentiment gauge to a five-month high of 108.5.
New Home Sales: A reported increase in the number of single-family housing units started suggests that new home sales likely climbed by 4.7% to a SAAR of 535K in August, following an 18.9% plunge over the June-July span.
Merchandise Trade Deficit: The gap on international trade in goods is expected to narrow to $88bn in August from the $90.2bn shortfall recorded in July.
Pending Home Sales: Affordability challenges probably continued to weigh on home-purchase contract signings in August, after a 9.8% dive over the June-July span.
Jobless Claims: Initial claims for unemployment insurance benefits likely remained in a historically low 205-230K range during the period ended September 23. Continuing claims are expected to dip below the 1.4mn mark during the week ended September 9, supporting the view that recently laid-off employees are having little trouble finding work.
Real GDP Growth: The BEA’s final pass at Q2 real GDP growth is expected to be unchanged from the .6% annualized contraction reported in August. The upcoming report will include annual revisions to the National Income and Product Accounts from 2017 forward. With real gross domestic income (GDI) eclipsing real GDP by a record amount in Q2, upward adjustments to the latter may be in store and would erase the previously estimated contractions in Q1 and Q2. Since total income is derived from production, real GDI should be exactly equal to real GDP.
Federal Reserve Appearances:
- Sept. 26 Boston Fed President Collins to speak to the Boston Chamber of Commerce.
- Sept. 26 Cleveland Fed President Mester to discuss the economic outlook at an event hosted by MIT.
- Sept. 27 St. Louis Fed President Bullard to discuss the economic outlook at a policy forum in London.
- Sept. 28 St. Louis Fed President Bullard to give welcoming remarks at a community banking event hosted by the bank.
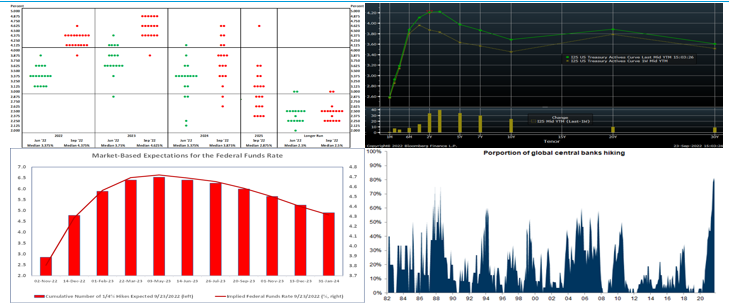
CHART 1 UPPER LEFT
Source: Federal Reserve Board; FHLBNY. The premier event of the past week was the FOMC outcome. Fed officials expect the target range for the federal funds rate to move significantly higher over the balance of this year and remain elevated for an extended period. Indeed, the median forecast of FOMC participants reveals an expected increase in the fed funds target range by an additional 125 bps over the remainder of this year to 4.25% to 4.5%. The median projection for 2023 calls for an additional 25 bps of tightening to 4.625% by the end of next year. The median call for year-end 2024 entertains the possibility for a 75 bps reduction back to 3.875%. The first-time-released median projection for year-end 2025 anticipates a further slide lower to 2.875%. The median longer-run rate projection was left unchanged at 2.5%. Of note in the dot plot is the wide dispersion in expectations for end-2024 and 2025, thereby indicating a wide range of possible economic/rates outcomes and likely ongoing volatility in this portion of the yield curve.
CHART 2 UPPER RIGHT
Source: Bloomberg. Note: Top pane is yield (%), bottom pane is change (bps). The UST curve, as of Friday afternoon, finished yet again markedly higher and flatter from the week prior; many points now trade at the highest levels in years, and some curve slopes are at or near the most inverted levels in decades. The past week’s move was led by a rise of ~39 bps in 3-year and ~34 bps in 2-year. The primary catalyst to the move was the FOMC outcome in which Fed Chair Powell stated that the Fed will “do what it takes” to get inflation under control and indicated a “no pain, no gain” approach. Clearly, the Fed aims to control inflation expectations. The market, in turn, further adjusted its rate expectations; see further color below.
CHART 3 LOWER LEFT
Source: Bloomberg; FHLBNY. Since Fed policy remains the driving force of the curve at present, we update this chart of the market’s pricing of the prospective path of the Fed Funds Effective rate. The dynamics cited above led the market to again this week price larger forthcoming hikes and to pare back pricing of a prospective Fed easing cycle in late-2023. As of this past Friday afternoon and up from last week, the market priced for a 100% chance of a 50 bps hike for the November 1 FOMC, with ~70% chance of a 75 bps hike. For 2022 cumulatively from now, the market prices ~120 bps of hikes. The market anticipates further increases to ~4.72% by next May but, in contrast to Fed officials, still expects the Fed to shift gears beyond that point. The current 4.4% rate anticipated by the market at end-2023 is below the 4.625% median projection in the latest “dot plot.” In this regard, this section of the curve could be the most vulnerable to moves in either direction in response to fresh economic data.
CHART 4 LOWER RIGHT
Source: Haver Analytics; Goldman Sachs Research. The Fed has plenty of company in hiking official rates, as the inflation fight is a global one. A record share of global central banks (up to 32 Central Banks included here) are in a hiking cycle, as seen here. Following hikes in recent weeks from the ECB and Bank of Canada, this past week the Bank of England, Bank of Norway, and Swiss National Bank, among others, increased their rates. In recent past years, extremely low (and often negative) rates in other countries served to boost demand for US securities, but this dynamic is likely changing; meanwhile, the landscape for all bonds has been treacherous, as witnessed in the historic single-day 50 bps rise in UK government bond yields this past Friday.
FHLBNY Advance Rates Observations
Front-End Rates
- Short-end Advance rates finished notably higher week-over-week, especially in the very short tenors which adjusted in accordance with the Fed rate hike. The market again boosted the odds of more aggressive forthcoming hikes; hence the move higher across the full sector. For instance, 3-month rose 13 bps. Volatility in short-end markets has increased, with a greater chance of dynamic moves day-to-day and intraday, a situation likely to persist while the Fed continues its hawkish and data-dependent posture regarding rate hikes. As of this past Friday afternoon and up considerably from the week prior, the market priced for a 100% chance of a 50 bps hike at the November 1st FOMC, with ~70% chance of 75 bps hike. For 2022 cumulatively from now, the market prices for ~120 bps of hikes.
- Given the Fed’s tightening and data-dependent posture, rates will remain highly responsive to economic data and Fed-speak.
Term Rates
- The longer-term curve finished higher and flatter from the week prior, generally mirroring the move in UST and swaps markets. Whereas 2 and 3-year were ~35 and 40 bps higher, respectively, 10-year was ~25 bps higher. Kindly refer to the previous section for relevant market color. The advance curve is extremely flat overall and inverted at various points, thereby offering opportunities to extend in advance duration for minimal or lower coupon cost.
- On the UST term supply front, this upcoming week serves 2/5/7-year auctions. Market focus will be keenly trained on a heavy slate of Fed-speak and economic data. Please call the desk for information on market dynamics, rate levels, or products.
Product Alert: FHLBNY is pleased to announce the reintroduction, after a temporary suspension owing to Libor-cessation, of the Putable Advance, Fixed-Rate with SOFR Cap Advance, and ARC with SOFR Cap/Floor Advance. The Callable Advance continues to be offered. This expansion of the product menu will provide members with more options and flexibility for the management of funding and/or hedging needs. Please call the Member Service Desk at (212) 441-6600 for more information.
Forward Start Advance (FSA): For members with upcoming borrowing or refunding plans, consider the FSA as a method to opportunistically “lock in” rates before advance settlement date. Please call the Member Service Desk at (212) 441-6600 for more information.
The Symmetrical Prepayment Advance Feature
With rates at or near multi-year lows, it is a compelling juncture to use the SPA feature on term advances. This feature allows member to capture, at prepayment, changes in the Fair Value of the advance which are favorable to the member. Contact us to discuss.
Looking for more information on the above topics? We’d love to speak with you!
Questions?
If you wish to receive the MSD Weekly Market Update in .pdf format (includes FHLBNY rate charts) or to discuss this content further, please email the MSD Team.