Member Services Desk
Weekly Market Update
This MSD Weekly Market Update reflects information for the week of January 17, 2022.
Economist Views
Click to expand the below image.
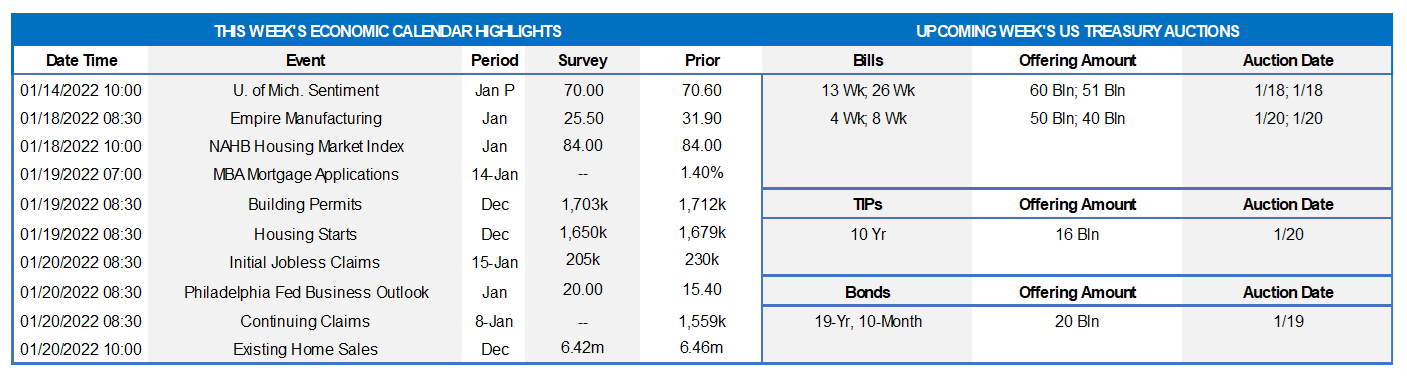
Housing statistics will be front and center over the course of this holiday-shortened week. Home-builder optimism probably remained near an all-time high at the beginning of the New Year. A variety of factors hint that there may be some positive surprises in the Census Bureau’s update on new residential construction in December. Existing home sales likely remained on an uptrend in the final month of 2021. Federal Reserve officials will observe the traditional blackout period on public appearances before the January 25-26 FOMC meeting.
Empire State Manufacturing Survey: Manufacturing activity in New York State likely expanded for a 19th straight month in January, albeit at a slower pace than in December. The net percentage of survey respondents experiencing a pickup in general business conditions is expected to have retreated to 25.5% from 31.9% in the previous month.
NAHB Housing Market Index: Home-builders’ appraisals of market conditions probably began in 2022 on a high note. Expected to hold steady at 84, the NAHB Housing Market Index would begin the year well above the neutral 50-point mark.
Housing Starts & Building Permits: The Street expects new housing starts to decline by 1.7% to a seasonally adjusted annual rate of 1.65mn in January, reversing a modest portion of November’s 11.8% jump. The number of new building permits issued – a closely followed leading indicator of prospective residential construction activity – probably edged .7% lower to 1.705mn during the reference period, following an upwardly revised 3.9% rise in November. Reported increases in building materials sales and construction hours worked, combined with record high temperatures and normal precipitation levels, hint that upside surprises may be in the offing in the Census Bureau’s report.
Jobless Claims: Exceptionally tight labor-market conditions point to declines in both initial and continuing claims under regular state unemployment insurance programs over their latest respective reporting periods.
Existing Home Sales: The pickup in purchase-contract signings witnessed over the October-November span would be consistent with a .9% rise in existing home sales to an 11-month high seasonally adjusted annual rate of 6.52mn in December. If that projection is on the mark, existing home sales clocked in at 6.17mn last year, up 9.1% from the 5.66mn posted in 2020. With normal seasonal patterns pointing to a 190K contraction in the number of homes on the market to a record low 920K, the stock of unsold homes likely moved four ticks lower to just 1.7 months’ supply.
Index of Leading Economic Indicators: Available data suggest that the Conference Board’s gauge of prospective economic activity climbed by .8% in December, following a 1.1% increase in the preceding month.
Federal Reserve Appearances: None
Click to expand the below image.
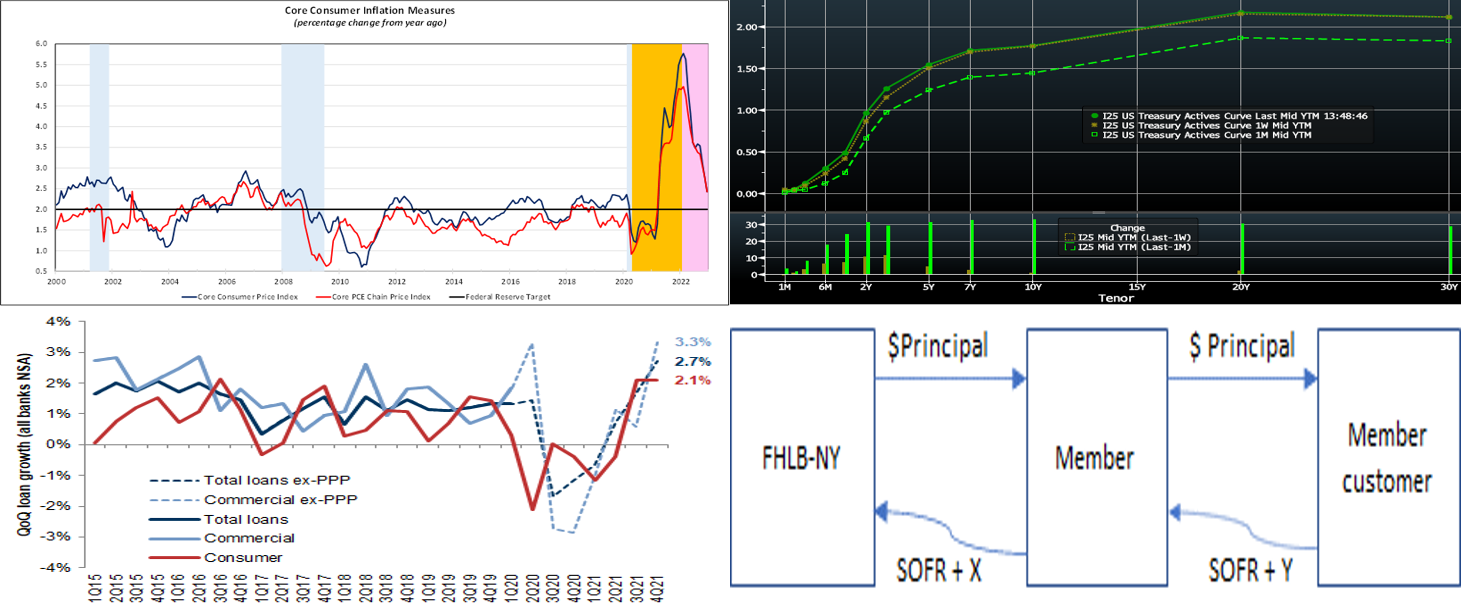
CHART 1 UPPER LEFT
Source: Bureau of Labor Statistics; National Bureau of Economic Research; FHLBNY. Notes: Blue shaded areas denote recessions, Orange highlights current economic expansion, Pink contains forecasts. The BLS reported that the Consumer Price Index (CPI) climbed by 7% last year, marking the largest 12-month advance since 1982. Excluding volatile food and energy items, the so-called core CPI quickened in December, propelling the year-to-year growth of the closely followed inflation gauge to 5.5% – the fastest pace since early 1991. With demand, particularly for services, expected to improve as the Omicron outbreak subsides, hiring reaccelerates and fiscal stimulus comes on stream, key consumer inflation metrics likely will remain well above the Federal Reserve’s target for an extended time. In the communiqué following the December FOMC meeting, policymakers dropped the view that last year’s inflation flareup was due to transitory factors and acknowledged that supply and demand imbalances related to the pandemic and the reopening of the economy were contributing to the elevated price increases. Growing concerns that acceleration in consumer prices could prove more intractable have altered market participants’ expectations of increases in the Fed Funds rate target range, with many now calling for four 25 bps increases over the course of 2022.
CHART 2 UPPER RIGHT
Source: Bloomberg. Note: Top pane is yield (%), bottom pane is change (bps). As of midday Friday, UST yields again moved higher week-over-week. The 2 and 3-year points led the rise and finished ~10 and 8 bps (auction-roll adjusted) higher, respectively, as the market has priced more aggressive Fed rate hikes into the curve. Indeed, Fed Funds futures currently price a full 25 bp hike in March and 3.75 hikes of 25 bps for calendar year 2022. As mentioned last week, the pandemic persists, but the Omicron variant has thus far proved less lethal than prior variants, thereby leading the market to perceive it as less of an economic threat. Meanwhile, various Fed members have vocalized support for both earlier rate hikes and balance sheet runoff (not reinvesting principal payments). Given this past week’s release of the highest CPI reading since 1982, this hawkish rhetoric appears apropos; Fed Governor Waller even indicated that 5 hikes might be appropriate, and more members expressed support for balance sheet runoff beginning as soon as this spring. Topping off the instigators of higher yields was the past week’s continued surge in corporate bond supply.
CHART 3 LOWER LEFT
Source: Federal Reserve; Goldman Sachs Research. Depicted here and based on a recent data report from the Federal Reserve, banking industry loan growth accelerated in Q4 of 2021, with commercial loans ex-PPP growing at ~3% quarter-on-quarter. This clearly positive trend, if sustained, should be beneficial to NII/NIM figures and provide more compelling opportunities to deploy funds.
CHART 4 LOWER RIGHT
Source: FHLBNY. As a reminder, per the Libor cessation timeline and guidelines for beginning 2022, new financial instruments must not utilize Libor as a reference rate. Accordingly, our product suite no longer includes new Libor-indexed advances. However, we offer a full complement of SOFR-indexed floating rate advances (aka “ARC”, for Adjustable Rate Credit), including both simple daily average and compounding versions, and a callable product as well. Per this diagram, the SOFR ARC can be an efficient, flexible, and readily available option to fund floating rate investments and/or assist members in providing floating rate loans to their customer base. For more information, please call the Member Service Desk or check our SORF-ARC page.
FHLBNY Advance Rates Observations
Front-End Rates
- Short-end advance rates 6-month and shorter are higher and steeper from the prior week. Net T-bill issuance has turned positive, as Treasury aims to rebuild their TGA cash balances. While this trend somewhat changes the short-end’s supply/demand dynamic, there is still ample demand for the shortest paper. Demand for the Fed’s RRP, which stands last at ~$1.64trn, remains strong. Money market funds’ AUM fell ~25bn from a week ago, however, thereby sapping some demand, as investors likely pulled some cash back out of safe year-end “holding spots”. These dynamics have served to limit changes in the very short maturities. However, with a high probability of a Fed hike now priced into the curve for the mid-March FOMC meeting, maturities crossing this timeframe have adjusted upwards. While rates through 1-month were only 1 bp higher from a week prior, the 3-month is 3 bps higher and 6-month 6 bps higher.
- T-bills are experiencing an issuance increase, but this uptick should not alter the overall money markets paradigm of strong demand amidst limited supply, at least in the extreme front-end. To reiterate, however, as time ensues and maturities cross into or further past March, a timeframe the market prices a strong probability of rate hikes, these maturities’ rates are likely to experience further upward drift.
Term Rates
- The advance rates curve generally mimicked the UST curve week-over-week, with the 1 to 3-year leading the move higher by ~10, 13, and 9 bps, respectively. The 5-year finished ~5 bps higher and longer maturities were a few bps higher. Kindly refer to the previous section for further color on relevant market dynamics.
- On the UST supply front, this week brings a 20-year nominal and a 10-year TIPS auction. Corporate issuance should experience heavy activity, particularly and in traditional fashion from large banks post their earnings reports. With the Fed in blackout mode, the market may possibly “tread water” until the FOMC result the following week.
For your early-year calendars, please note that FHLBNY will conduct a webinar and virtual training sessions on our community and housing programs. The kickoff webinar on January 19th is designed to provide our member institutions and valued housing partners with pertinent updates on the FHLBNY’s community investment products (Affordable Housing Program (AHP), Homebuyer Dream Program® (“HDP®”), and Community Lending Plan (“CLP”)), events and deadlines for 2022. Subsequently, in February, FHLBNY will conduct a series of virtual trainings. Please visit our event’s page for pertinent details and dates.
The Symmetrical Prepayment Advance Feature
For those anticipating term funding needs, and with rates on an uptrend, it can be an appropriate juncture to consider our Symmetrical-feature advance. This feature allows the member to capture, at prepayment, changes in the fair value of the advance which are favorable to the member. Please contact our Member Service Desk to discuss.
Looking for more information on the above topics? We’d love to speak with you!
Questions?
If you wish to receive the MSD Weekly Market Update in .pdf format (includes FHLBNY rate charts) or to discuss this content further, please email the MSD Team.