Member Services Desk
Weekly Market Update
This MSD Weekly Market Update reflects information for the week of September 12, 2022.
Economist Views
Click to expand the below image.
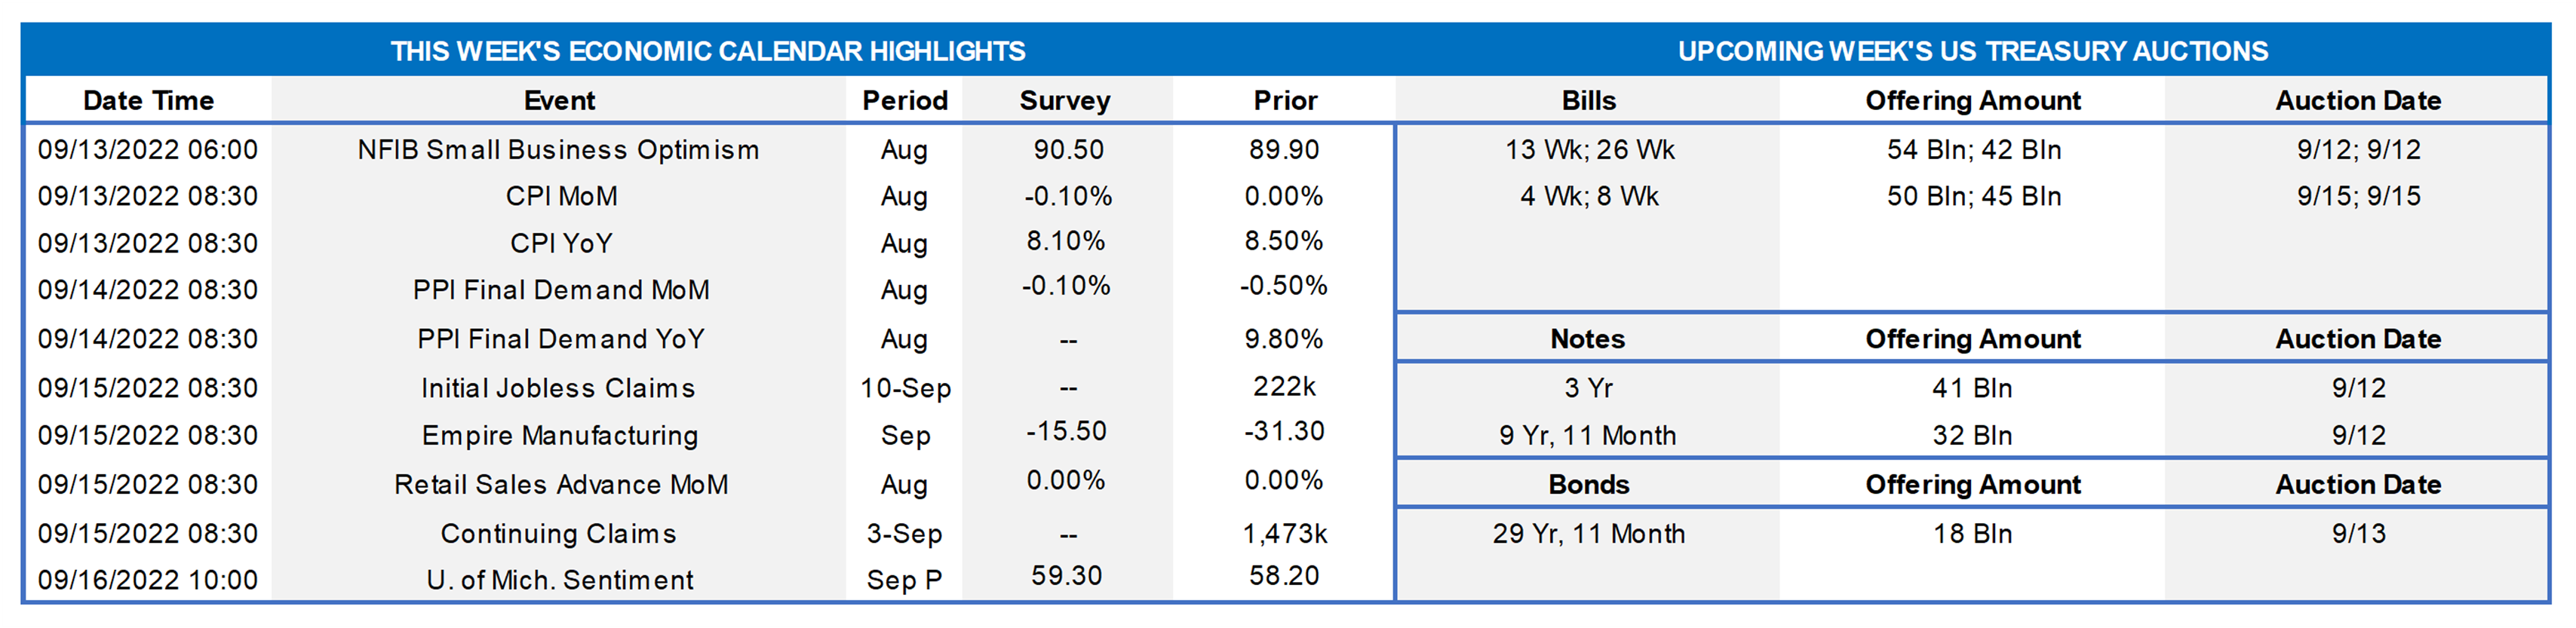
With policymakers observing the traditional blackout period ahead of the September 20-21 Federal Open Market Committee meeting, the attentions of traders and investors will be on the economic data calendar this week. Consumer prices are expected to decline for the first time in two years. Benign inflation reports for July and August will do little to deter central bankers from lifting administered interest rates at the upcoming gathering, however. Reports on retail sales and industrial output last month will allow economists to mark-to-market their current-quarter real GDP projections. The Street is currently anticipating a 1.5% annualized increase, after two consecutive modest declines during the winter and spring quarters.
NFIB Small Business Optimism Index: Small business sentiment likely improved in August, lifting the NFIB’s confidence gauge to a three-month high of 92.5.
Consumer Prices: The Bureau of Labor Statistics is expected to report that a tug of war between lower retail energy quotes and modest increases in other goods and services costs left the Consumer Price Index (CPI) .1% lower in August – the first decline since May 2020. Excluding volatile food and energy items, the so-called core CPI is expected to climb by .3% for a second straight month. Those projections, if realized, would place the overall and core CPIs 8.0% and 6.0% above their respective year-ago levels – both well above Federal Reserve’s desired 2% target.
Producer Prices: Echoing the CPI report, the Producer Price Index (PPI) probably also dipped by .1% last month, after a .5% drop in July. If realized, the anticipated August decline would pare the PPI’s 12-month growth rate to 8.6% from 9.8% in the previous month.
Jobless Claims: Initial claims for unemployment insurance benefits likely remained in the recent 220-245K range during the period ended September 9. Pay particular attention to continuing claims under regular state programs for signs that laid-off employees may be having a more difficult time finding work.
Empire State Manufacturing Index: Factory activity is expected to have contracted in September, with the pace of decline slowing from August’s reported clip. The Street expects the general business conditions diffusion index to clock in at -15.5%, after the -31.3% posted in August.
Retail & Food Services Sales: Capped by a price-induced falloff in gasoline service station revenues, retail and food services sales probably were unchanged once again in August. As always, market participants will pay particular attention to so-called control sales excluding auto, building materials and gasoline purchases in the upcoming report. Barring any prior-month revisions, the .6% increase anticipated by the Street would place core purchases over the July-August span 8% annualized above their April-June average, after a 6.9% annualized spring-quarter advance.
Industrial Production & Capacity Utilization: Powered by anticipated increases in mining and utilities output, industrial production probably climbed by .2% last month, following a .6% gain in July. With output expected to marginally eclipse additions to productive capacity during the reference period, the overall operating rate likely rose to a 14-year high of 80.4%.
Michigan Consumer Sentiment Index: Solid labor market conditions, combined with signs that inflation may be ebbing, probably propelled the University of Michigan’s consumer confidence gauge to a five-month high of 61.5 in early September.
Federal Reserve Appearances: None. Federal Reserve officials will observe the traditional blackout period ahead of the September 20-21 FOMC meeting.
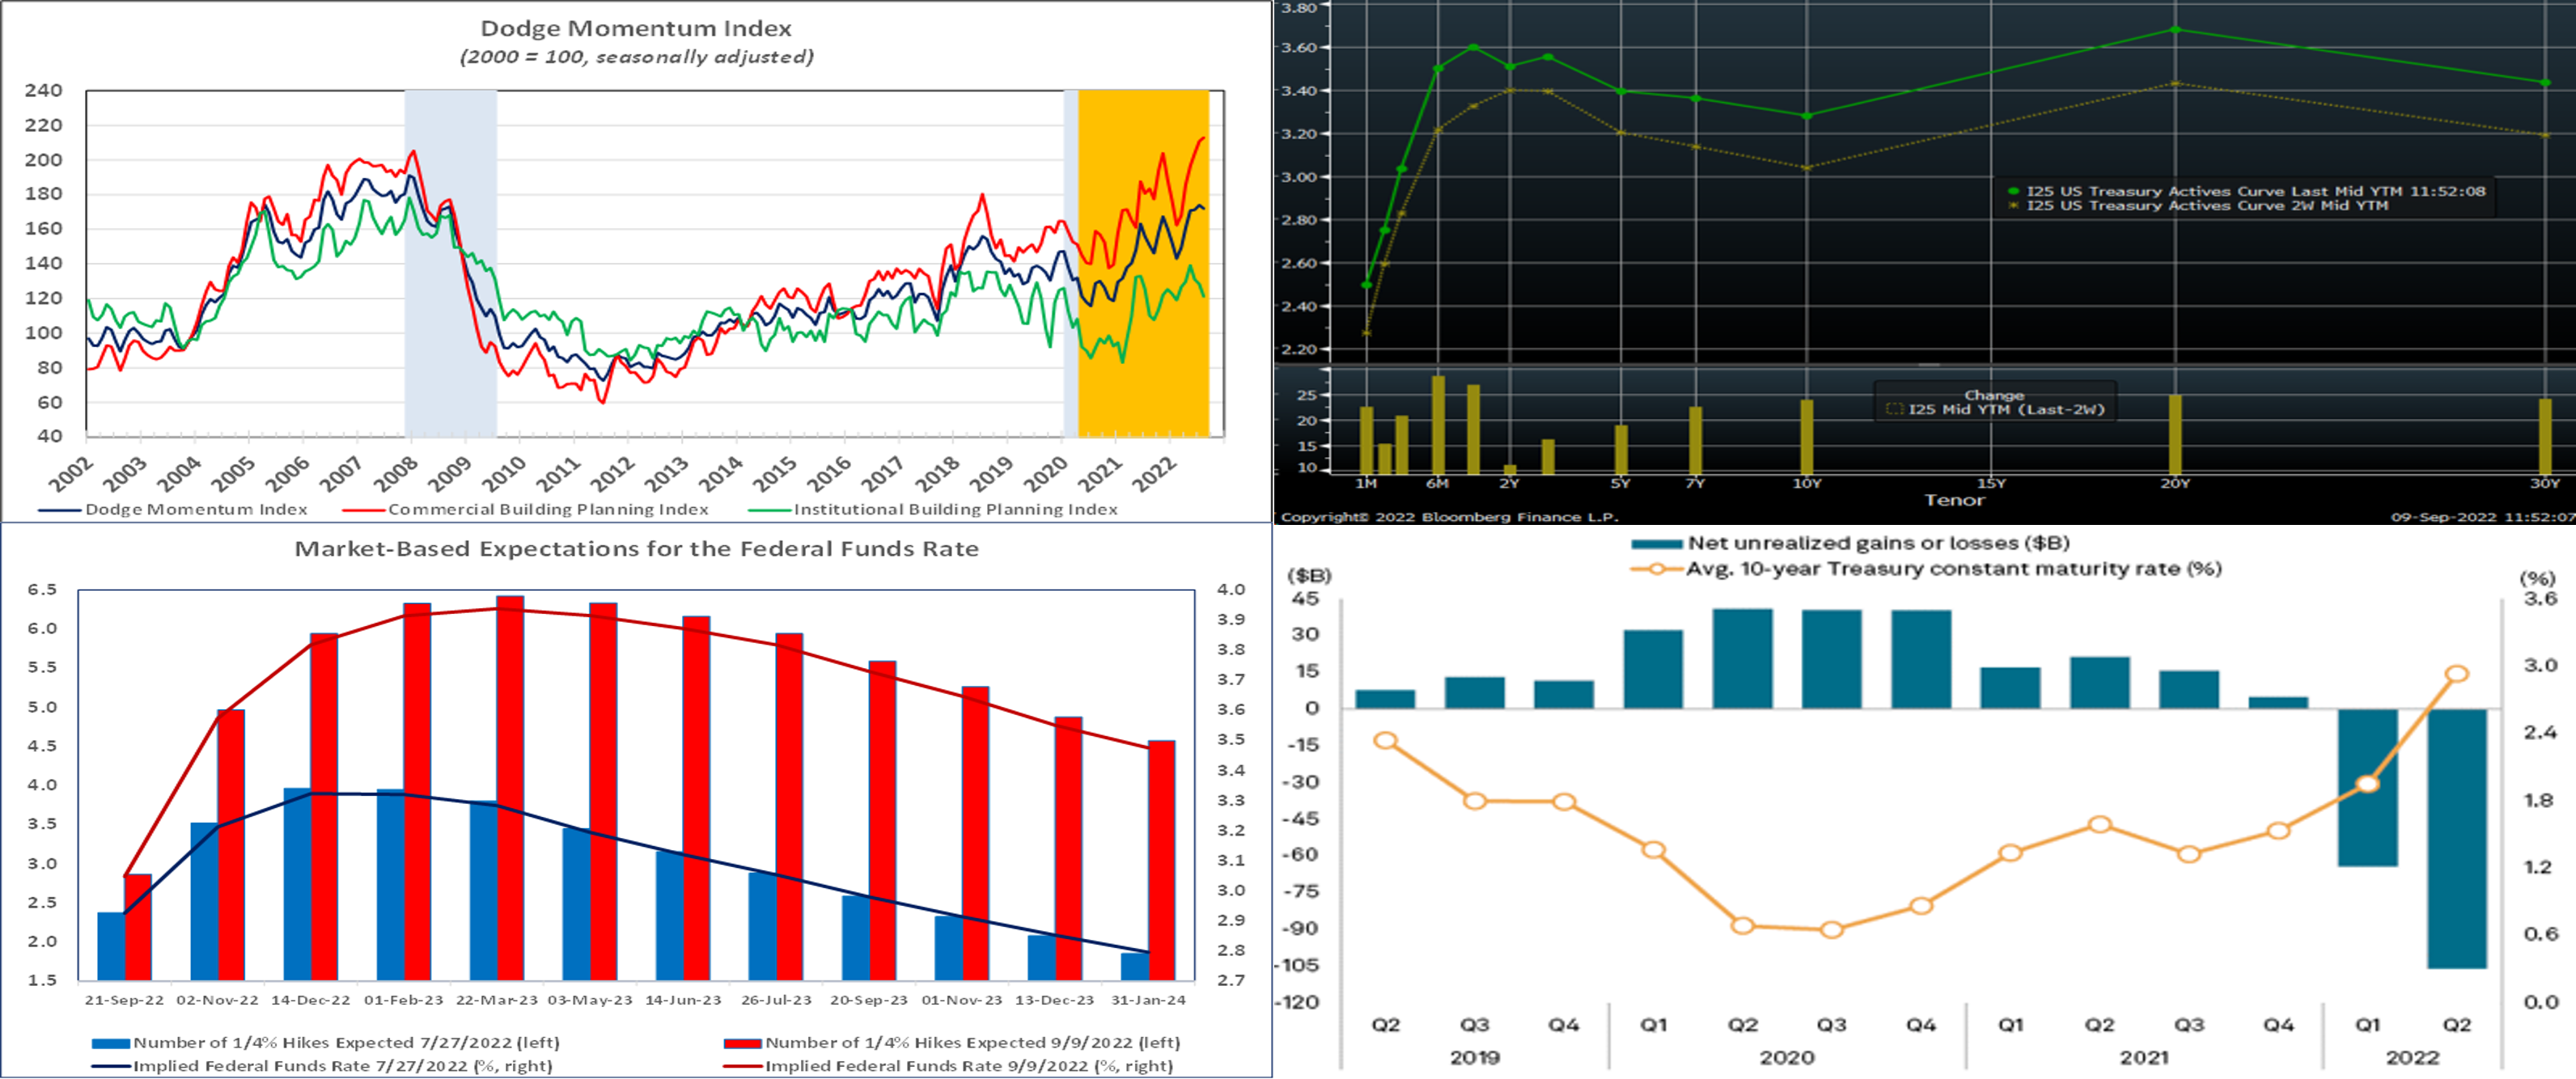
CHART 1 UPPER LEFT
Source: Dodge Construction Network; NBER; FRB St. Louis; FHLB-NY. Notes: Blue shaded areas denote recession; orange the current economic expansion. Non-residential building projects entering the planning stage dipped slightly in August. The Dodge Momentum Index (DMI) retreated by 1.2% from the 14-year high recorded in July. The DMI measures initial reports of non-residential building projects entering the planning stage and has been shown to lead actual construction outlays by a full year. While owners and developers remain confident, weaker economic conditions and rising interest rates may erode consumer and business confidence heading into 2023, thereby translating into fewer nonresidential building projects breaking ground. Segment results were mixed in August. The commercial component rose by 1% to an all-time high, led by an increase in hotel projects, while the institutional component declined by 5.6% to a 6-month low, owing to fewer healthcare projects.
CHART 2 UPPER RIGHT
Source: Bloomberg. Note: Top pane is yield (%), bottom pane is change (bps). The UST curve, as of mid-Friday, continued its march higher from our last edition two weeks ago, with many points reaching the highest levels in years. In turn, 30-year mortgage rates, now ~6%, are at the highest point in roughly 14 years. Fed-speak continued to reinforce that it will act with resolve to quell inflationary forces which remain decidedly too strong. Fed Chair Powell declared this week that it will act “forthrightly”, while Vice-Chair Brainard stated “we are in this for as long as it takes to get inflation down”. Meanwhile this week, the Bank of Canada and the ECB each hiked rates by 75 bps. Also adding impetus to higher longer-term yields was the typical early-September surge in corporate bond issuance.
CHART 3 LOWER LEFT
Source: Bloomberg; FHLB-NY. The dynamics cited above have led the market to price larger forthcoming hikes and to pare back pricing of a prospective Fed easing cycle in late-2023, clearly seen in this view of current market pricing vs. that from the July 27th FOMC meeting. Multiple market strategists this past week amended their call for the Sept. 21st FOMC from 50 to a 75 bps hike. As of this past Friday midday, the market priced for a 100% chance of a 50 bps hike at the Sept.21st FOMC, with ~88% chance of a 75 bps hike. For 2022 cumulatively from now, the market prices just shy of 150 bps of hikes.
CHART 4 LOWER RIGHT
Source: S&P Global Market Intelligence; FRB. Depicted here is a multi-year view of the 10-year Constant Maturity UST Rate (RHS, %) and net unrealized gains/losses (LHS, $bn) in US bank securities portfolios. Clearly, the dramatic rise in yields over the past year has led to corresponding declines in bond valuations. Banks must mark bonds in available-for-sale (AFS) portfolios on a quarterly basis, and those portfolios, as opposed to held-to-maturity or trading account designated portfolios, continue to hold the bonds owned by most banks. Unrealized losses can negatively impact tangible book values, as changes in the value of those portfolios flow through accumulated other comprehensive income (AOCI) and impact tangible common equity. These losses may also prove burdensome to net economic value measurements. This dynamic helps to highlight a major benefit of our Symmetrical Prepayment Advance (SPA), as the SPA can serve as an offset to unrealized losses in bond portfolios. The market values of advances with symmetry will have an inverse relationship to fixed-rate securities portfolio valuations. In a rising rate environment, advances with symmetry can create unrealized gains on the liability side of the balance sheet which can be monetized, and these unrealized gains can serve as a perceived offset to unrealized losses in bond portfolios. Moreover, the gains on a SPA can be monetized, thereby allowing for more flexibility/opportunity for deleveraging and/or re-aligning a securities portfolio.
FHLBNY Advance Rates Observations
Front-End Rates
- Short-end Advance rates, except for 2-week-and-in tenors, finished notably higher from levels of two weeks ago. Maturities now cross further into expected upcoming Fed hikes, and the market has boosted the odds of more aggressive near-term hikes. Volatility in short-end markets has tempered in recent weeks, but the chance remains of dynamic moves both day-to-day and intraday, a situation likely to persist while the Fed embraces a “data-dependent” posture regarding rate hikes. As of this past Friday midday, the market priced for a 100% chance of a 50 bps hike at the Sept.21st FOMC, with ~88% chance (up from ~62% two weeks ago) of a 75 bps hike. For 2022 cumulatively from now and notably higher from two weeks ago, the market prices just shy of 150 bps of hikes.
- Given the Fed’s tightening and data-dependent posture, rates will remain highly responsive to economic data and Fed-speak.
Term Rates
- The longer-term curve finished higher yet again from levels of two weeks ago, generally mirroring the move in UST and swaps markets. Whereas 2-year was ~16 bps higher, 5-year was ~19 bps and 10-year ~26 bps higher. Kindly refer to the previous section for relevant market color. The advance curve is extremely flat overall and inverted at various points, thereby offering opportunities to extend in advance duration for minimal or lower coupon cost.
- On the UST term supply front, this upcoming week serves 3/10/30-year auctions. Market focus will remain on economic data, particularly Tuesday and Wednesday’s inflation reports. Fed-speak will be absent, owing to the pre-FOMC blackout period. Please call the desk for information on market dynamics, rate levels, or products.
Product Alert: FHLBNY is pleased to announce enhancements to our Advance Rebate Program, which provides members an opportunity to receive a cash rebate when prepaying an eligible advance and rebooking a new advance within a 30-day period. Rebate-eligible advances now must have a minimum of 6-months (reduced from 1-year) remaining. Moreover, the potential cash rebate has been increased. This program can be suitable for those wishing to extend their liability duration and/or potentially improve net interest margin. Please call the Member Service Desk at (212) 441-6600 for more information.
Forward Start Advance (FSA): For members with upcoming borrowing or refunding plans, consider the FSA as a method to opportunistically “lock in” rates before advance settlement date. Please call the Member Service Desk at (212) 441-6600 for more information.
The Symmetrical Prepayment Advance Feature
With rates at or near multi-year lows, it is a compelling juncture to use the SPA feature on term advances. This feature allows member to capture, at prepayment, changes in the Fair Value of the advance which are favorable to the member. Contact us to discuss.
Looking for more information on the above topics? We’d love to speak with you!
Questions?
If you wish to receive the MSD Weekly Market Update in .pdf format (includes FHLBNY rate charts) or to discuss this content further, please email the MSD Team.