Member Services Desk
Weekly Market Update
This MSD Weekly Market Update reflects information for the week ending September 29, 2023.
Economist Views
Click to expand the below image.
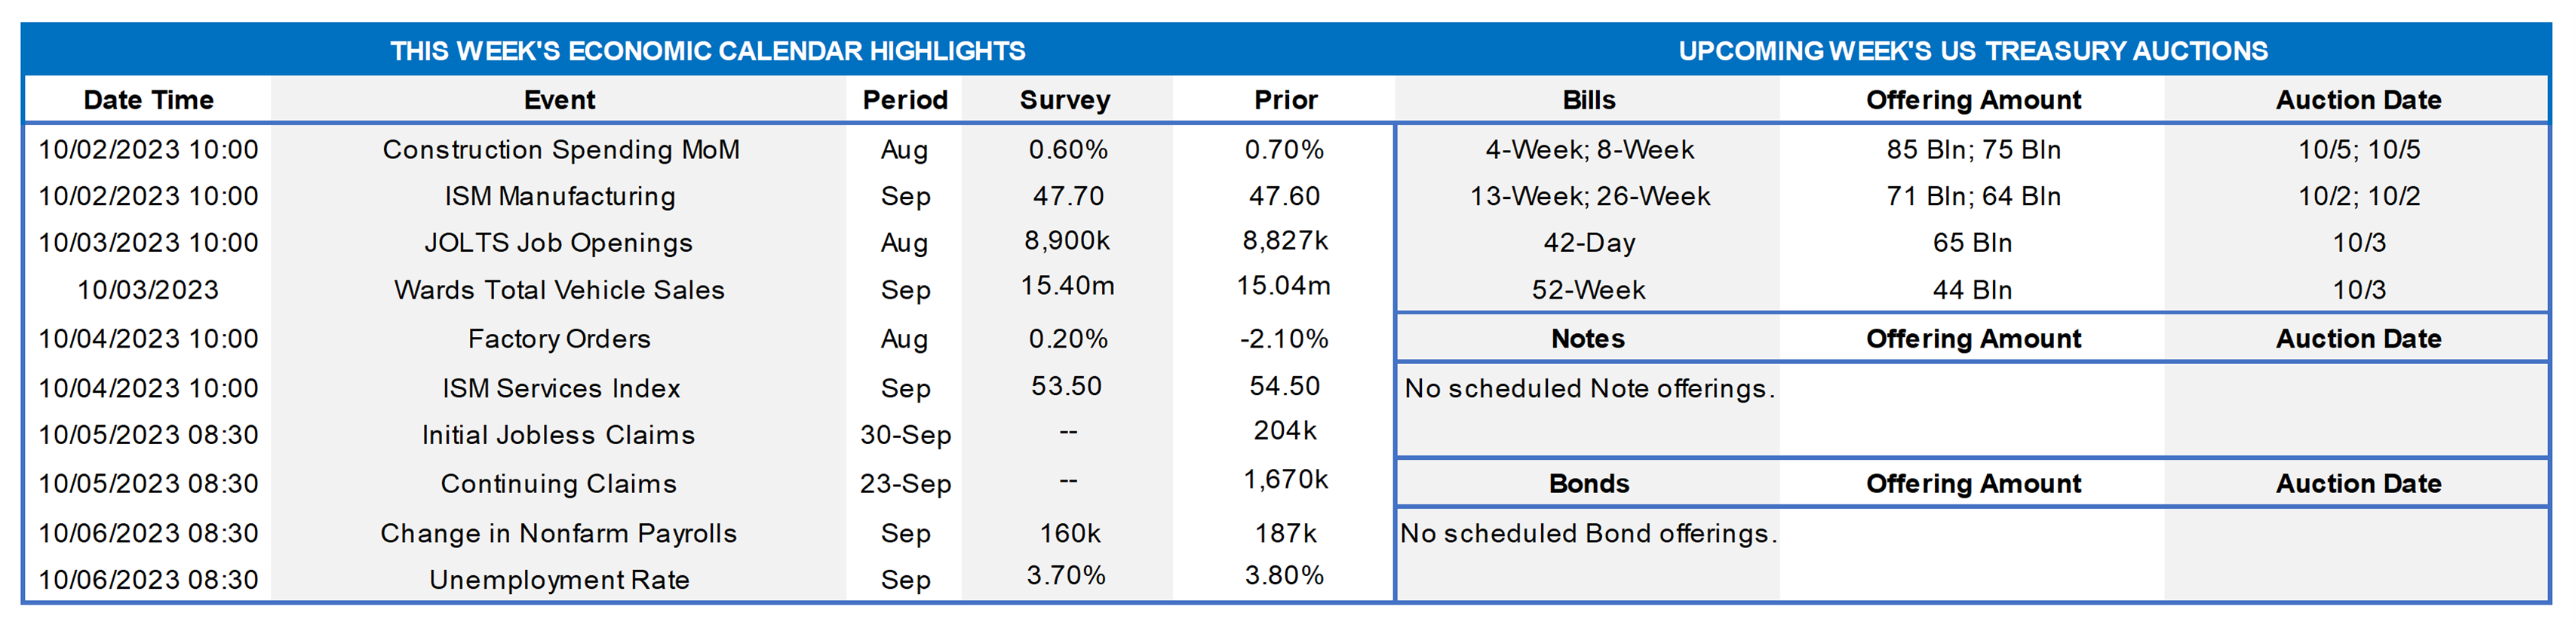
Market participants will contend with a crowded economic release calendar as the fourth quarter begins. The marquee report of the week will be the Bureau of Labor Statistics’ update on the employment situation in September. The pace of job creation likely picked up last month and if history is a reliable guide, the preliminary August payroll estimate probably will be marked higher. Turning to the household survey, the unemployment rate likely retreated during the reference period. Owing to the timing of the September canvass, an upside surprise on average hourly earnings may be in the offing in this week’s report. Also, on the positive side of the ledger, the ISM manufacturing gauge may have moved back above the critical 50% mark in September while motor vehicle sales rebounded. A sextet of Federal Reserve officials, including three FOMC voters, are slated to present their current views on the economic outlook and other timely topics to a variety of audiences.
Construction Spending: The nominal value of new construction put-in-place is expected to have risen by .6% in August boosting the cumulative increase since the end of last year to 7.8%.
ISM Manufacturing Activity Index: The 11-month contraction in nationwide manufacturing activity may have ended in September. Indeed, district Federal Reserve Bank canvasses suggest that the Institute for Supply Management’s (ISM) Purchasing Managers Index climbed to 50.5% from 47.6% in August.
JOLTS Job Openings: A reported decline in online help-wanted postings suggests that nationwide job openings contracted by 190K to 8.64mn in August, boosting the cumulative falloff since April to 1.68mn. At an estimated 2.28mn, the excess of vacant positions nationwide would represent 1.4 jobs per unemployed person.
Motor Vehicle Sales: Industry watchers expect sales to have climbed by 2.4% to a seasonally adjusted annual rate of 15.4mn in September, reversing roughly half of the pullback witnessed in August.
Factory Orders: Modest increases in durable and nondurable goods bookings likely pushed manufacturing orders .2% higher in August, following an aircraft-led 2.3% decline in July.
ISM Services Activity Index: The index probably expanded for a ninth straight month in September, albeit at a bit slower clip than in August, with the ISM’s gauge likely shedding one point to 53.5%.
Employment Situation Report: Labor market conditions probably remained extremely tight as Q3 ended. Nonagricultural businesses likely added 210K net new workers in September, eclipsing the 187K gain recorded in August. Weekly jobless claims reports and consumer-sentiment soundings suggest that the civilian unemployment rate retreated to 3.7% during the reference period – just three ticks above the half-century low posted in January. Buoyed by an extended five-week interval between establishment canvassing periods, average hourly earnings probably climbed by .5% during the reference period – the largest gain in three months. If realized, that result would place nominal compensation 4.5% above the $32.53 per hour received a year earlier.
Consumer Credit: Fueled by an anticipated pickup in auto lending, consumer installment credit likely expanded by $11.3bn in August, after the surprisingly low $10.4bn takedown posted in July.
Federal Reserve Appearances:
- Oct. 2: Fed Chair Powell and Philadelphia Fed President Harker to participate in a roundtable discussion in York, PA.
- Oct. 2: NY Fed President Williams to participate at the 2023 Columbia Environmental Economics and Policy Conference.
- Oct. 2: Cleveland Fed President Mester to speak on the economic outlook at the 50 Club of Cleveland monthly meeting.
- Oct. 3: Atlanta Fed President Bostic to discuss the 2024 outlook with Leadership Atlanta’s alumni roundtable.
- Oct. 5: San Francisco Fed President Daly to speak to the Economic Club of New York.
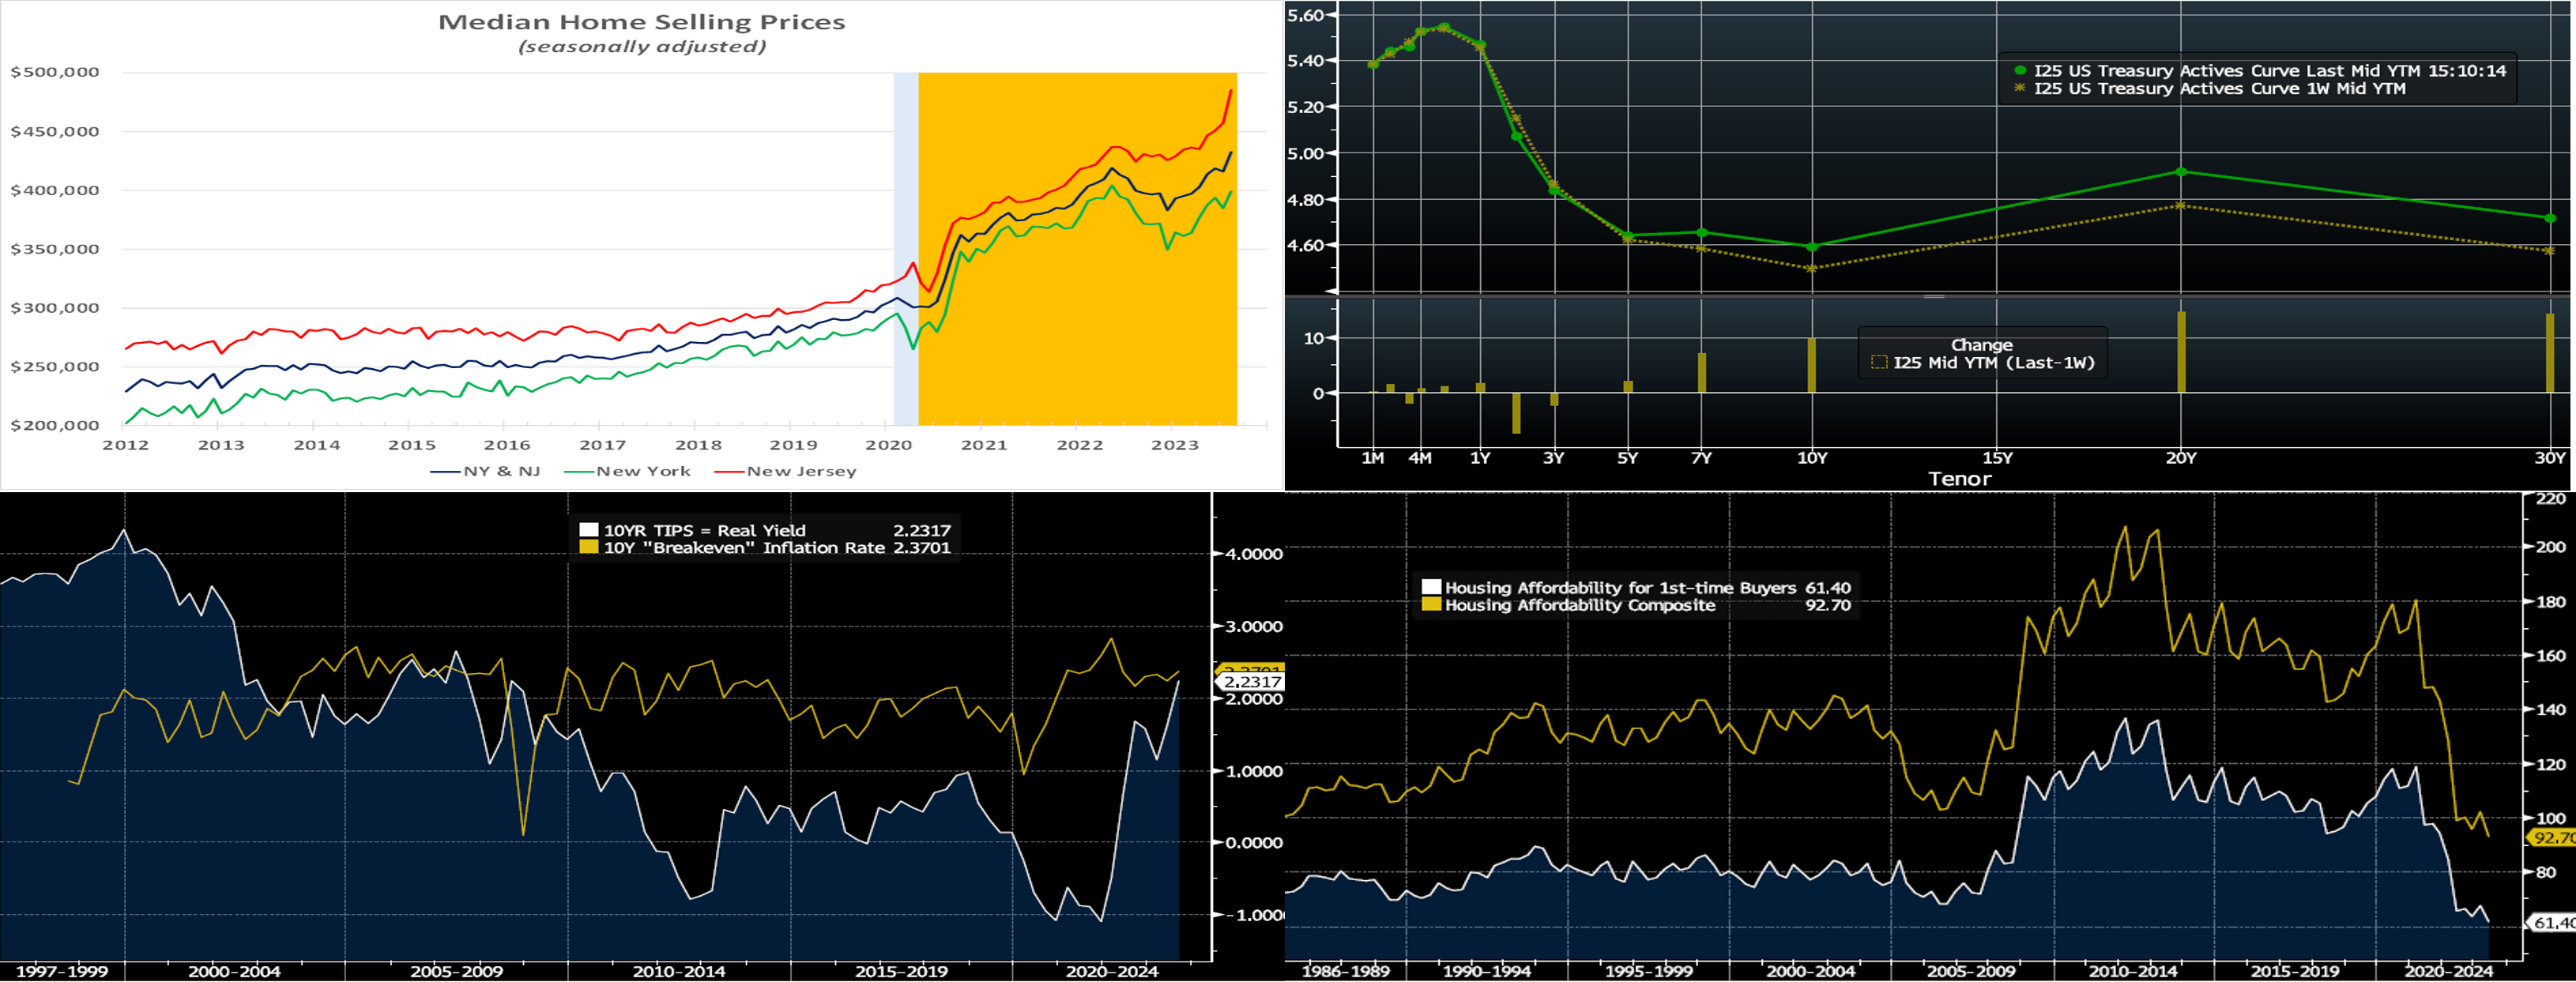
CHART 1 UPPER LEFT
Source: New York State Realtors Association; NJ Realtors; National Bureau of Economic Research; FHLB-NY. Realtor reports for NY and NJ revealed that closings across the two states slipped by 3.1% to a post-pandemic low of 15,413 after seasonal adjustment in August. Taken by themselves, those figures provide a misleading view of current market conditions, however. Indeed, while new listings rose for the first time since May, the total number of dwellings on the market dipped by .2% to an estimated nadir of just 43,330 – a staggering 27.5% below the 59,735 homes available in August 2022. The dearth of supply across the area continues to propel median selling prices sharply higher, despite decades-high levels of fixed mortgage rates. As we have covered in previous editions, high mortgage rates have served to dissuade large cohorts of homeowners with sub-current market rate mortgages from moving, thereby depressing supply. Other barometers also support the view that NY and NJ are sellers’ markets. Last month, sellers were receiving an estimated 2.1% above their asking prices on average, while homes were changing hands in 46 days, well below the 79-day average of the past 12 years.
CHART 2 UPPER RIGHT
Source: Bloomberg. Top pane is yield (LHS, %), bottom pane is change (LHS, bps). From last Thursday afternoon to this one, the UST curve bear steepened, with longer tenors rising notably relative to shorter tenors. While the 2-year was roughly unchanged (roll-adjusted for the new on-the-run note), the 10-year rose ~10 bps. The post-FOMC “hawkish pause/higher-for-longer” theme, in tandem with a slug of fresh issuance and tepid demand out the curve, persisted over the week. The market will watch economic data, particularly the looming jobs report, but the threat of a government shutdown could impact/delay certain data collection and/or releases. In terms of market-implied pricing of the Fed, the 2023 peak Funds rate in December now stands at ~5.44%; essentially, the market is pricing a bit below the Fed’s dot plot with only ~45% chance of another 25 bp hike this year. The years 2024 and 2025 retreated from a week ago, with the year-end 2024 forward ~7 bps lower, at 4.60%.
CHART 3 LOWER LEFT
Source: Bloomberg. Here is a long-term view of 10-year UST yields, in the form of its components, namely the yield on 10-year TIPS (RHS, White, %, Treasury Inflation Protected Securities, and so a measure of “real yield” that an investor can earn over inflation) and then the 10-year Breakeven inflation rate (RHS, gold, %, equal to the nominal 10-year UST yield less the real yield of TIPS). Substantially, all of this year’s move has come from higher real yields, while fears about inflation have actually abated and mostly trended sideways. Notably and significantly, after years post-Great Financial Crisis of trading below the Breakeven and even in negative territory, real yields have stormed higher this year and are close to fully closing the gap to the Breakeven. The current positive and much higher real yields reflect a true financial tightening that should cause further impact the longer they persist.
CHART 4 LOWER RIGHT
Source: Bloomberg. If there was ever a time that the FHLB-NY housing affordability programs (Affordable Housing Program, Homebuyer Dream Program, visit https://www.fhlbny.com/community/housing-programs) can help make a difference, it is the present. Higher rates, along with stubbornly high home prices underpinned by lack of supply, have negatively impacted home affordability. Shown here are two National Association of Realtors home affordability indices, namely the Housing Affordability Composite index (RHS, gold) and the Housing Affordability for 1st-time Buyers index (RHS, white); they are both at historical lows (i.e., less affordable) points. Direct from our September 5th FHLB-NY President’s Report: “On August 22, we made our favorite announcement of the year, reporting on our annual Affordable Housing Program grants. This year, we announced $42 million in grants in support of 42 housing initiatives to help create or preserve 2,693 affordable homes across our District and beyond.”
FHLBNY Advance Rates Observations
Front-End Rates
- Short-end rates ticked higher by 1 to 3 bps, generally on quarter-end pressures in the short-end markets, from a week ago. Net T-bill supply remains positive, given announcements from the Treasury regarding upsized auctions and issuance needs. But the supply continues to be absorbed well, as Money Market Funds (MMFs) switch from the Fed’s RRP to T-bills with competitive yields. Moreover, FHLB supply has subsided from peak levels of spring, further assisting T-bill interest from investors and thereby containing any severe upward pressure on rates from T-bill supply. MMFs currently stand at or near all-time high AUM levels.
- The upcoming week’s data, especially the Friday employment report, and Fedspeak should drive direction near-term.
Term Rates
- The longer-term curve, generally mirroring the moves in USTs and swaps, bear steepened on the week. While the 2-year traded ~1 bp higher, the 5 and 10-year were 7 and 15 bps higher, respectively. The advance curve remains inverted out to 5-year, thereby offering opportunities to extend in duration at lower coupon cost. Kindly refer to the previous section for relevant market color. We continue to experience keen demand for putable advances; call the Member Services Desk to learn more.
- On the UST term supply front, the upcoming week serves a reprieve from auctions. Note that UST auctions usually occur at 1pm and can cause volatility around that time. Please contact the Member Services Desk for further information on market dynamics, rate levels, or products.
Price Incentives for Advances Executed Before Noon – In effect as of Tuesday, September 5, 2023 – The FHLB-NY is pleased to now offer price incentives for advances executed before Noon each business day. These pricing incentives offer an opportunity to provide economic value to our Members, while improving cash and liquidity management for the FHLBNY. For further details, kindly refer to the bulletin.
Forward Start Advance (FSA): For members with upcoming borrowing or refunding plans, consider the FSA as a method to opportunistically “lock in” rates before advance settlement date. Please contact the Member Services Desk at (212) 441-6600 for more information.
The Symmetrical Prepayment Advance Feature
For those anticipating term funding needs, and with rates on an uptrend, it can be an appropriate juncture to consider our SPA feature. This feature allows the member to capture, at prepayment, changes in the fair value of the advance which are favorable to the member. Contact Member Services Desk to discuss.
Looking for more information on the above topics? We’d love to speak with you!
Questions?
If you wish to receive the MSD Weekly Market Update in .pdf format (includes FHLBNY rate charts) or to discuss this content further, please email the MSD Team.