Member Services Desk
Weekly Market Update
This MSD Weekly Market Update reflects information for the week ending February 23, 2024.
Economist Views
Click to expand the below image.
Market participants will contend with a very crowded economic release calendar this upcoming week. Updates on capital equipment deliveries, consumer spending, motor vehicle purchases, and new home sales in January likely will prompt economists to refresh their tracking estimates for current-quarter real GDP growth. While the median Street estimate calls for a slowdown in inflation-adjusted activity to an annualized pace of just 1.1% during the winter – down from 3.3% annualized in Q4 – projections from the Federal Reserve Banks of Atlanta and New York are tracking closer to 3%. Home-selling prices probably edged higher in December, with the extent of reported gain likely improving on November’s reported breadth. Buoyed by solid labor market conditions, consumer confidence probably rose in February. Half a dozen Federal Reserve officials, including a quartet of current FOMC voters, are scheduled to provide their thoughts on a variety of timely topics.
New Home Sales: A solid beginning-of-the-year rise in single-family building permits suggests that contract signings climbed by 5.3% to a six-month high seasonally adjusted rate of 700K in January.
Durable Goods Orders: Prompted by a dive in commercial jet requisitions, orders probably tumbled by 6% in January, following no change in the previous month. Sans the weakness in transport, orders likely eked out a .2% gain after December’s .5% rise. Pay focus to nondefense capital goods shipments, excluding aircraft, for clues to the strength in business equipment spending.
S&P CoreLogic Case-Shiller (SPCLCS) 20-City Home Price Index: Home prices probably edged .21% higher in December across the twenty major metropolitan areas canvassed by SPCLCS, marginally eclipsing November’s .15% gain. If that projection is on the mark, the SPCLCS barometer rose by 6.2% during 2023, after a 5.7% increase over the course of 2022.
Conference Board Consumer Confidence: Preliminary soundings from the University of Michigan suggest that this gauge climbed by 1.2 points to 116 – its rosiest reading since July 2021.
Real GDP Growth: The BEA likely will report that real GDP expanded at an annualized pace of 3.3% during Q4, unchanged from the estimate published in last month’s advance report.
Personal Income & Spending: Capped by a slowdown in private-sector wage and salary growth, personal income likely edged .2% higher in January, following a .3% gain in December. Real consumption expenditures probably were little changed, placing last month’s inflation-adjusted outlays 2.1% annualized above their fourth-quarter average.
Pending Home Sales: Hampered by wet weather, contracts to purchase an existing dwelling likely declined by 2% in January, reversing a portion of the surprising 8.3% leap witnessed in December.
Construction Spending: The nominal value of new construction put-in-place is expected to have risen by .2% in January, boosting the cumulative increase since December 2022 to 14.1%.
ISM Manufacturing Activity Index: Available canvasses suggest that the index may have moved above the critical 50-point mark into expansionary territory for the first time since September 2022.
Federal Reserve Appearances:
- Feb. 28 New York Fed President Williams to deliver keynote address at the Long Island Assn Regional Economic Briefing.
- Feb. 29 Atlanta Fed President Bostic to take part in a fireside chat at the 2024 Banking Outlook Conference.
- Feb. 29 Chicago Fed President Goolsbee to take part in a virtual event on “Monetary Policy at an Unusual Time.”
- Feb. 29 Cleveland Fed President Mester to speak at a Columbia University Bank Regulation Research Conference.
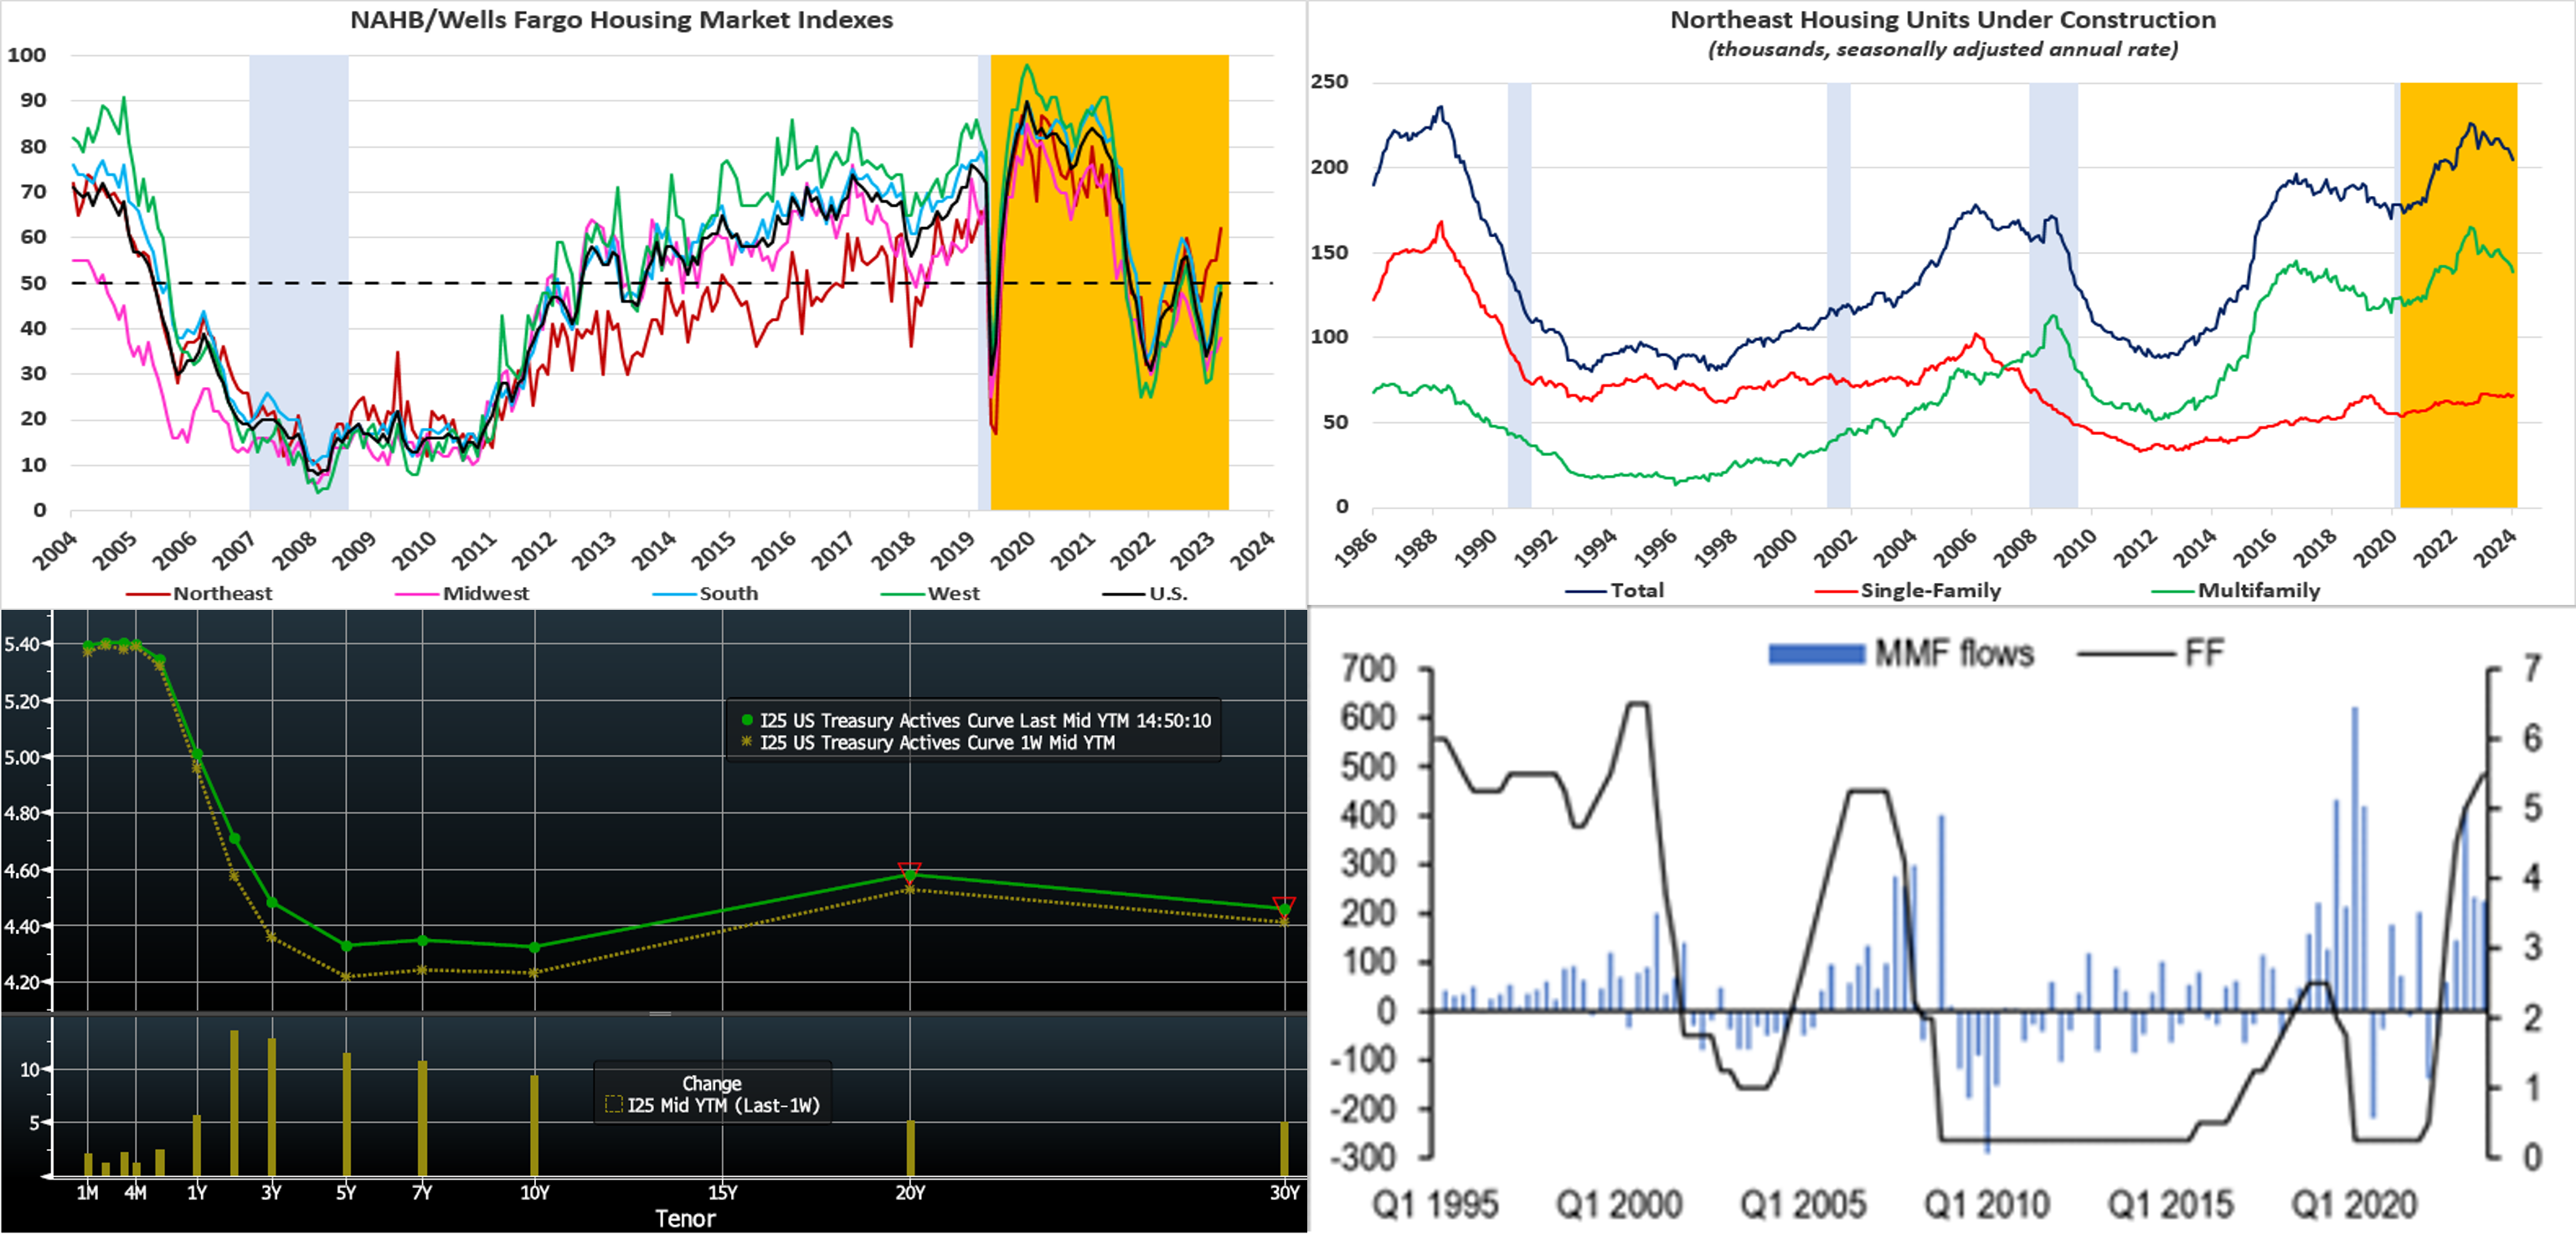
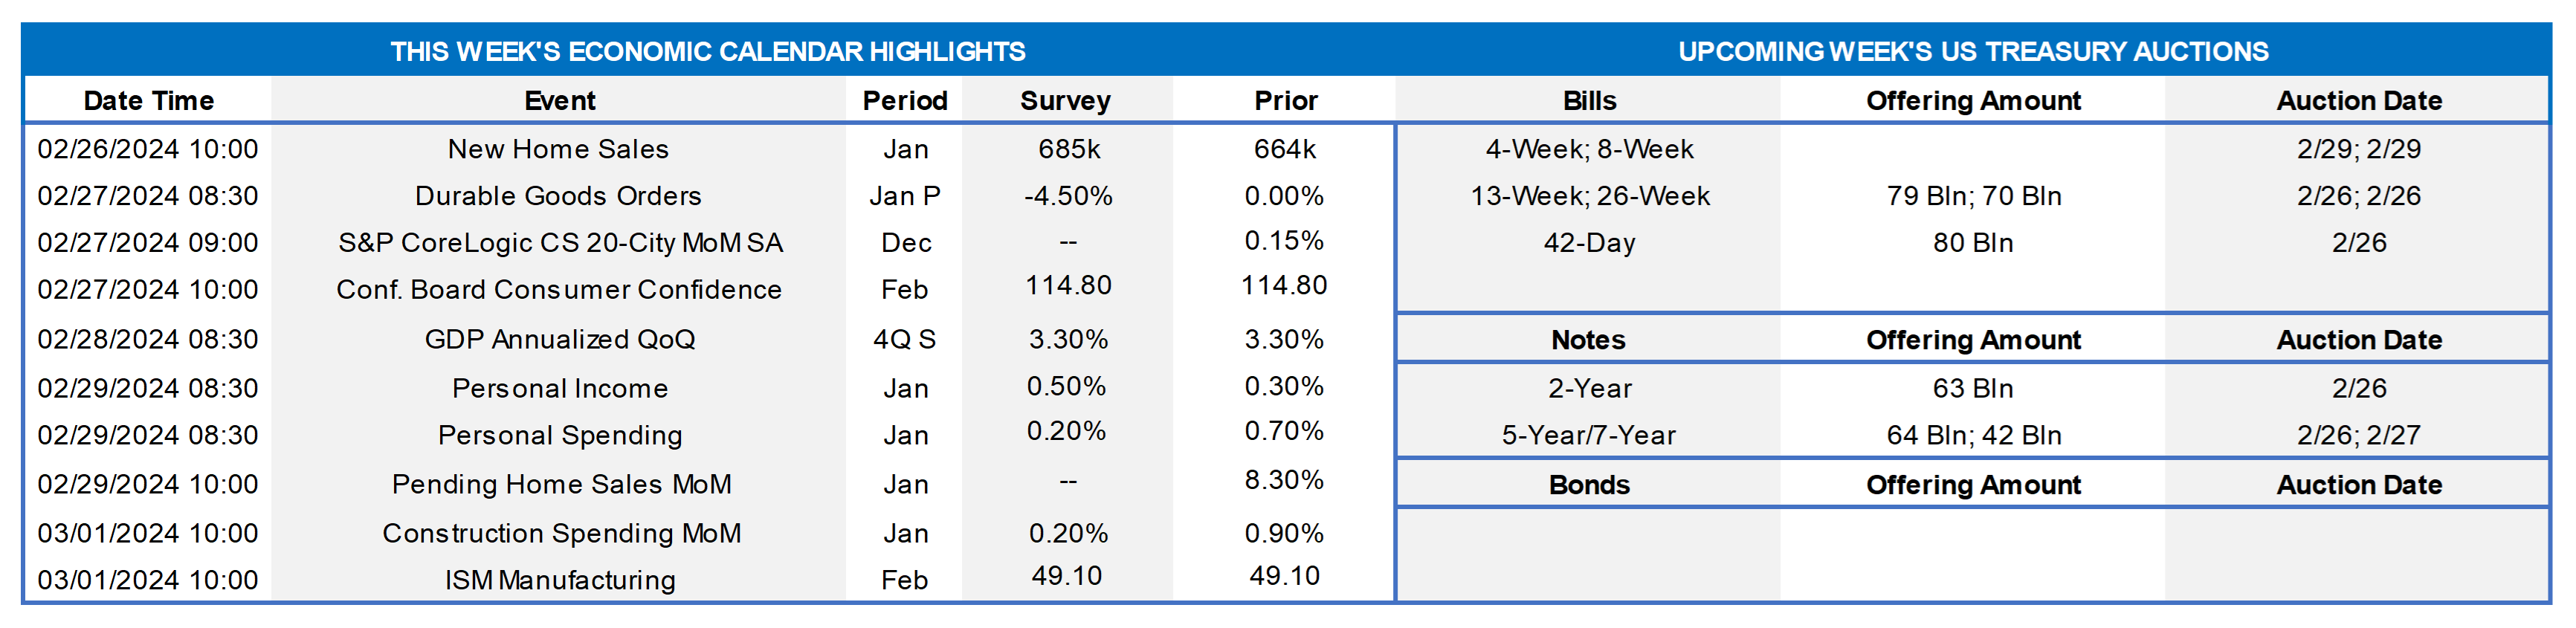
CHART 1 UPPER LEFT and CHART 2 UPPER RIGHT
Source: National Association of Realtors/Wells Fargo; Census Bureau; National Bureau of Economic Research; FHLB-NY. Notes: Blue-shaded areas denote recessions; orange-shaded highlights current economic expansion. Last week’s report from the National Association of Home Builders revealed that member sentiment in the Northeast soared to a 20-month high of 62 in early February, besting all other regions by a wide margin. January’s update on new residential construction activity cast significant light on what might be behind their optimism. In contrast to other areas of the country, where the number of housing units under construction has essentially moved sideways over the past two years, builders in our area have made significant progress in completing projects. Indeed, the number of housing units under construction in the Northeast has retreated by 9.3% to a seasonally adjusted annual rate of 205K from the recent peak of 226K witnessed in August 2022. All the decline has been attributable to multifamily structures. The number of single-family homes finished since that time, by contrast, has risen by 8.2% to 66K.
CHART 3 LOWER LEFT
Source: Bloomberg. Top pane is yield (LHS, %), bottom pane is change (LHS, bps). From last Thursday afternoon to this one, the UST curve bear flattened, with the 2- to 5-year sector leading the rise in yields. There was a lack of top-tier data in the holiday-shortened week, but the releases continued to reflect a generally sturdy economy. Meanwhile, this week’s FOMC Minutes release and overall comments from Fed members revealed that most officials remain more worried about the risk of cutting rates too quickly than keeping them high for too long. Moreover, the Minutes and officials continue to indicate that more evidence of disinflation is needed before any rate cuts materialize, with some policymakers raising concerns that progress might stall. In turn, the market has further pared back its pricing of prospective Fed cuts. In terms of market-implied pricing of the Fed, the chance of a 25 bps cut in March is ~1%, down from ~7% a week ago. The year-end 2024 forward is ~4.52%, roughly 16 bps higher than last Thursday. The market prices for a cumulative total of ~81 bps of cuts by the end of 2024, compared to ~98 bps a week ago. Perhaps best illuminating the change in markets over the past month is that market pricing for end-2024 is now only ~10.5 bps below the latest Fed’s “dot plot” projection of 4.625%!
CHART 4 LOWER RIGHT
Source: Crane Data; iMoneyNet; JP Morgan. Money Market Fund (MMF) AUM, despite having slipped somewhat in the past two weeks, reached record levels over $6trn this past month and, owing to the sector’s compelling current yields, continue to pose a competitive challenge to bank deposits. This dynamic is unlikely to change soon, based on rate levels and historical trends. Shown here are Quarterly MMF AUM flows (LHS, $bn) vs. the Fed Funds Target Upper Bound rate (RHS, %). Evident here is that MMFs tend to experience further inflows even as the Fed begins to cut policy rates. At this stage, even if inflows slow or decline, AUM levels appear poised to remain high in the months ahead.
FHLBNY Advance Rates Observations
Front-End Rates
- Short-end rates were mixed week-over-week, with the shortest tenors down a few bps, 3- to 4-month unchanged, and 5- to 6-month up a few bps. The market continued to price lower odds of a near-term Fed cut, and this dynamic prompted the move higher in the longer tenors. Solid demand for short paper has helped our shortest tenors, meanwhile. Net T-bill supply remains positive, given announcements from the Treasury regarding upsized auctions and issuance needs. However, the supply continues to be absorbed well, as Money Market Funds (MMFs) switch from the Fed’s RRP to T-bills with competitive yields. Moreover, MMFs currently stand at or near all-time high AUM levels.
- The market will monitor a heavier slate of both economic data and Fed speakers this upcoming week.
Term Rates
- The longer-term curve, generally mirroring moves in USTs and swaps, bear flattened week-on-week. The 2- to 5-year sector was 11 to 13 bps higher to lead the move. Please refer to the previous section for color.
- On the UST term supply front, the upcoming week serves 2/5/7-year auctions. Note that UST auctions usually occur at 1pm and can occasionally cause volatility around that time. Please contact the Member Services Desk for further information on market dynamics, rate levels, or products.
Grant funding under the FHLBNY 2023 Small Business Recovery Grant (SBRG) Program has begun and some funds are still available. The SBRG Program provides grant funds to benefit FHLB-NY members’ small business and non-profit customers. Please visit the SBRG webpage.
Price Incentives for Advances Executed Before Noon: In effect as of Tuesday, September 5, 2023, the FHLBNY is pleased to now offer price incentives for advances executed before Noon each business day. These pricing incentives offer an opportunity to provide economic value to our members, while improving cash and liquidity management for the FHLBNY. For further details, kindly refer to the Bulletin.
The Symmetrical Prepayment Advance Feature
For those anticipating term funding needs, and with rates on an uptrend, it can be an appropriate juncture to consider our SPA feature. This feature allows the member to capture, at prepayment, changes in the fair value of the advance which are favorable to the member. Contact Member Services Desk to discuss.
Looking for more information on the above topics? We’d love to speak with you!
Questions?
If you wish to receive the MSD Weekly Market Update in .pdf format (includes FHLBNY rate charts) or to discuss this content further, please email the MSD Team.