Member Services Desk
Weekly Market Update
This MSD Weekly Market Update reflects information for the week ending August 18, 2023.
Economist Views
Click to expand the below image.
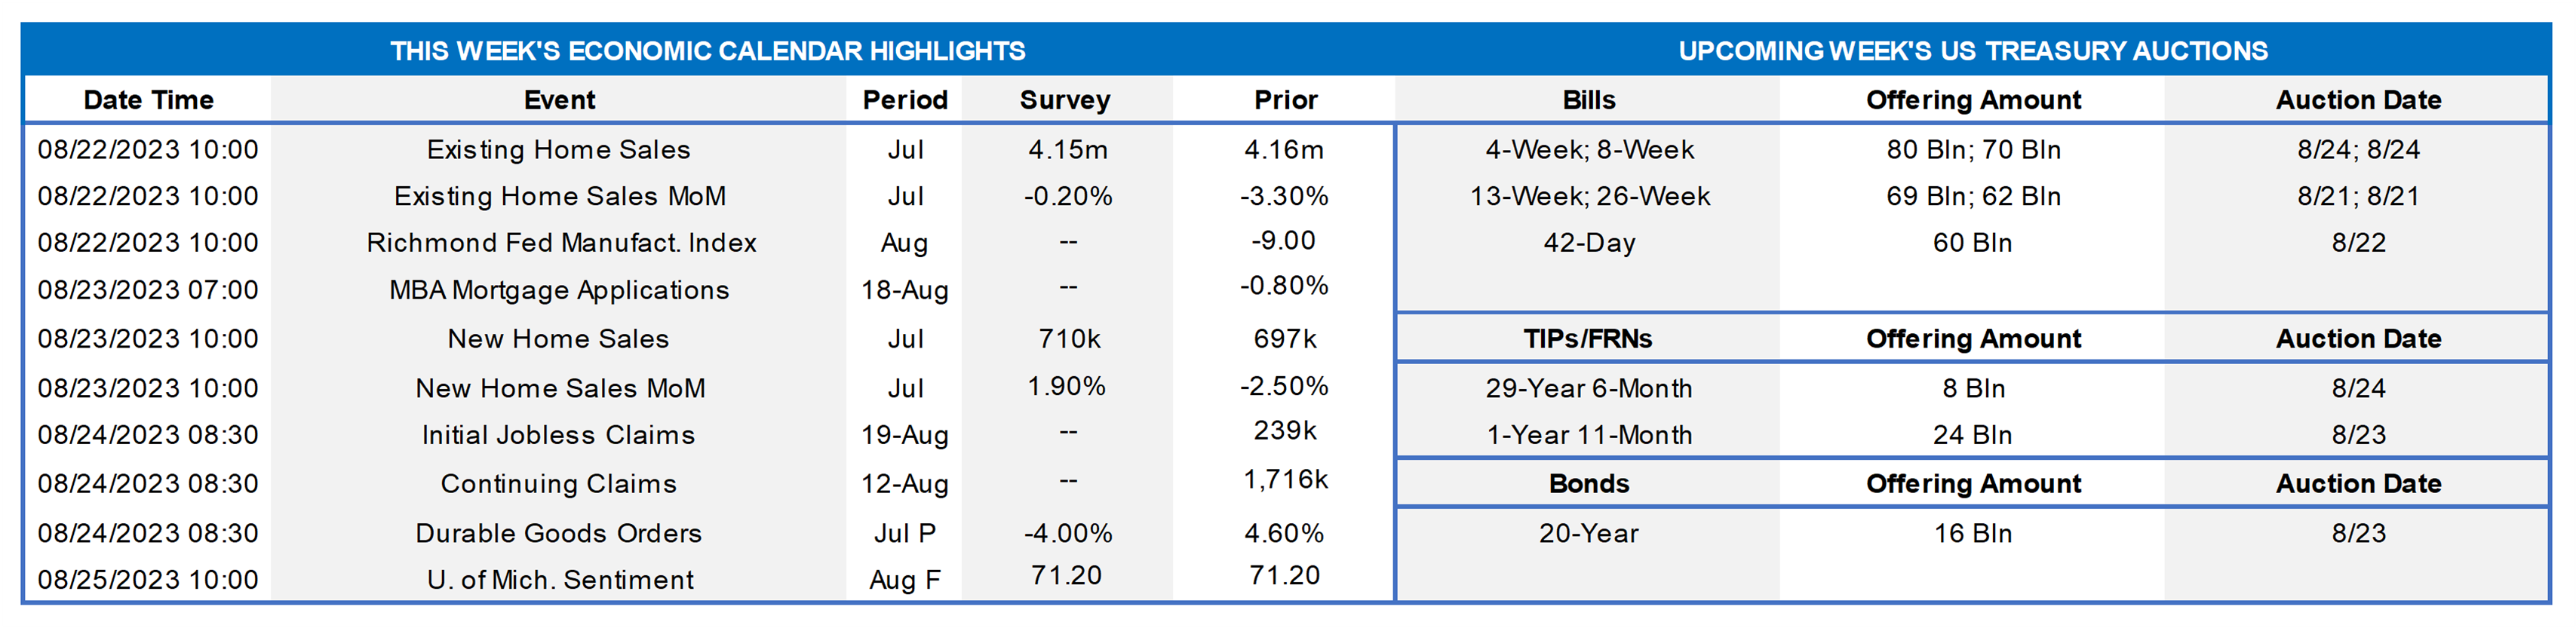
The economic data flow will slow to a trickle this coming week. Readings on existing and new home purchases in July are expected to be mixed. Soundings on both initial and continuing jobless claims probably will remain in recent ranges. Reflecting developments in the aeronautic industry, durable goods orders likely headed lower last month. With last week’s slate of key indicators eclipsing Street expectations by a wide margin, economists’ projections for real GDP growth during the summer quarter are poised for sizable markups. Indeed, the Federal Reserve Bank of Atlanta’s GDPNow tracking estimate currently calls for an eye-catching 5.8% annualized gain in real economic activity during Q3, up sharply from last week’s 4.1% annualized projection. On the lecture circuit, Federal Reserve Bank of Chicago President Austan Goolsbee – a current FOMC voter – is slated to speak. The Jackson Hole gathering may offer impactful news late in the week.
Existing Home Sales: Weaker home-purchase contract signings over the May-June span suggest that closings on existing dwellings slipped by .5% to a six-month low seasonally adjusted annual rate of 4.14mn in July. With the number of homes on the market expected to climb by 4% to 1.12mn on a not seasonally adjusted basis during the reference period, the months’ supply at the estimated sales pace would edge two ticks higher to 3.3 months.
New Home Sales: Reported increases in single-family building permits and housing starts in July suggest that contracts to purchase newly constructed dwellings rose by 4.7% to a seasonally adjusted annual rate of 730K – the highest tally since the 773K homes sold in February 2022.
Jobless Claims: Initial claims for unemployment benefits likely remained in a 225K to 240K range over the filing period ended August 19. Keep an eye on continuing claims, which have been clocking in below the 1.7mn mark, for an early sign that laid-off employees may be having a more difficult time finding work.
Durable Goods Orders: An anticipated drop in commercial jetliner bookings probably triggered a 4.1% decline in durable goods orders last month, erasing all but a fraction of June’s surprising 4.6% gain. Net of the expected weakness in transportation equipment requisitions, hard goods booking likely edged .2% higher in July, after a .5% prior-month gain. As always, pay particular attention to core nondefense capital goods shipments excluding jetliner deliveries, for clues to the strength of business equipment spending at the beginning of the summer quarter.
University of Michigan Sentiment Index: Consumers’ appraisals of current and prospective economic conditions probably were little changed in the latter half of August, leaving the final confidence reading near the preliminary reading of 71.2.
Federal Reserve Appearances:
- Aug. 22: Chicago Fed President Austan Goolsbee gives welcome remarks at a Fed Listens event on youth employment.
- Aug. 22-24: Jackson Hole Economic Policy Symposium – Fed Chair Powell to make opening remarks.
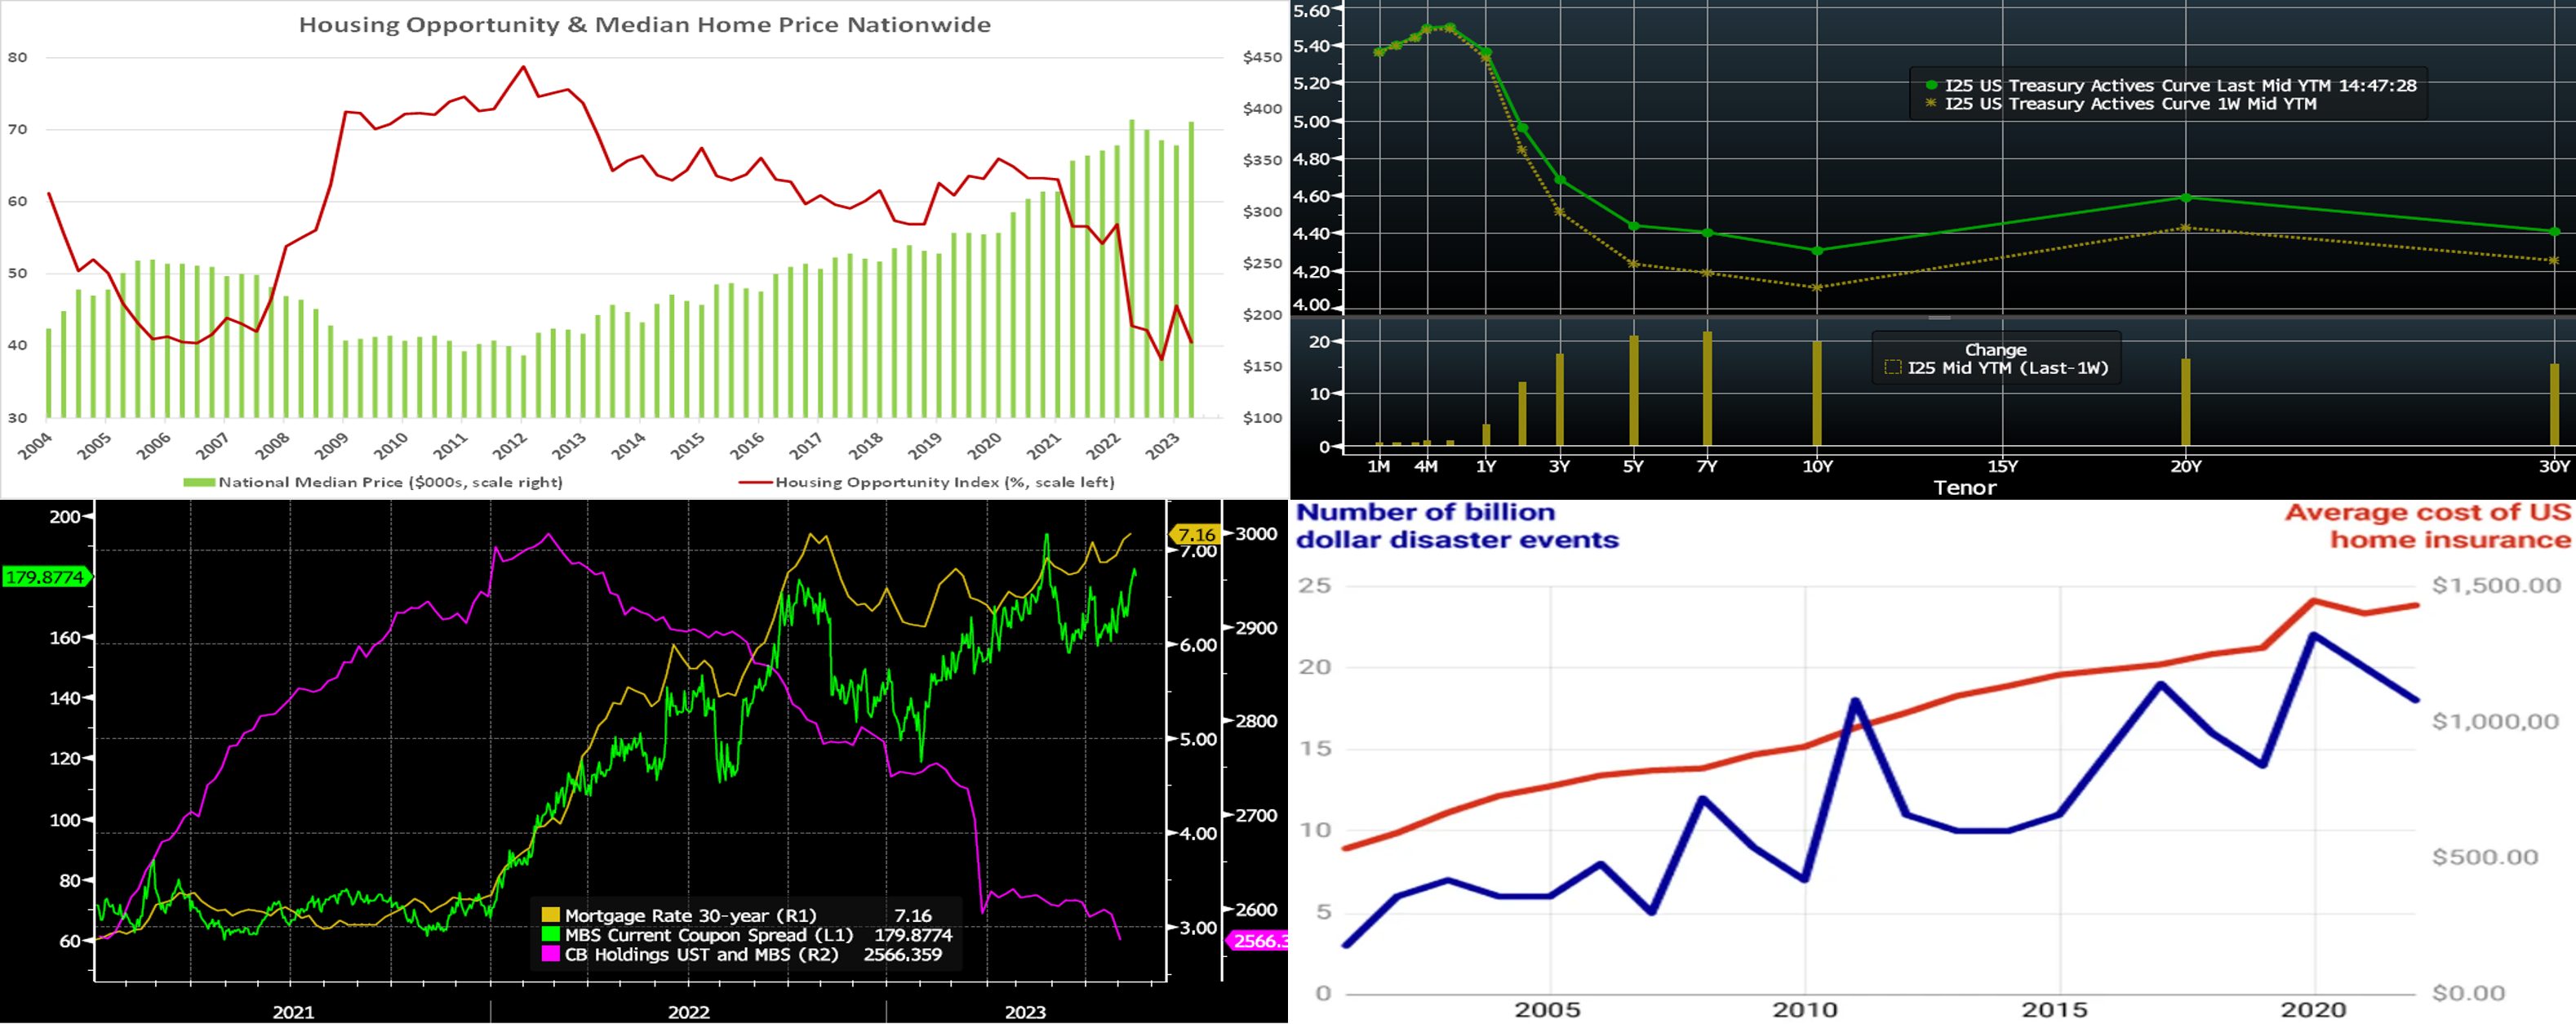
CHART 1 UPPER LEFT
Source: National Association of Home Builders/Wells Fargo; FHLB-NY. Housing opportunity deteriorated across the Nation and most of the FHLB-NY district during the spring quarter. The NAHB/Wells Fargo Housing Opportunity Index (HOI) for a given area is defined as the share of homes sold that would have been affordable to a family earning the local median income based on standard mortgage underwriting criteria. There are two components to the calculation – income and housing cost. In all, 40.5% of new and existing homes sold in Q2 were affordable to families earning the U.S. median income of $96.3K. This is down from 45.6% posted during the winter and the second-lowest reading since NAHB began tracking affordability on a consistent basis. As another reminder of ongoing affordability challenges, the Q2 2023 HOI reading registered shy of its year-ago score of 42.8%. Opportunity worsened across most of the FHLB-NY area, with the average HOI falling to 57.3% versus 61.4% during spring 2022. Housing opportunity in the FHLB-NY district during Q2 ranged from a high of 89.4% in Elmira, NY to a low of just 15.1% across the NY-Jersey City-White Plains, NY-NJ metropolitan statistical area.
CHART 2 UPPER RIGHT
Source: Bloomberg. Top pane is yield (LHS, %), bottom pane is change (LHS, bps). From last Thursday afternoon to this one, the curve moved notably higher, led by the 3-year-and-out sector which was up from 17 to 23 bps. Economic data, especially retail sales, was generally stronger than expected. Meanwhile, the FOMC Minutes report reflected a slightly hawkish tone. Global yields and the 10-year UST hit fresh highs and the highest levels since 2008. In terms of market-implied pricing of the Fed, the 2023 peak Fed Funds rate in November now stands at ~5.44%, up from 5.41% last week. Essentially, the market is pricing a ~44% chance of another 25 bp hike this year. The year-end forward is ~5.42%, or ~4 bps higher than last week. The years 2024 and 2025 moved higher from a week ago, with the year-end 2024 forward ~21 bps higher, at 4.25%, from a week ago. Please call the Member Services Desk for further information on market dynamics and/or products.
CHART 3 LOWER LEFT
Source: Bloomberg; Mortgage Bankers Association. As seen here, mortgage rates (RHS-1, gold, %) have reached fresh highs and are certainly a major contributor to declining housing opportunity. Indeed, now at ~7.30% (note that chart’s data point is 8/11), the average mortgage rate is the highest since 2001. In addition to a higher yield curve, another factor pushing mortgage rates higher has been the wider spreads (LHS, green, bps) demanded by the market on Agency MBS; the 30-year Current Coupon spread to the 5-year/10-year UST blend has widened ~110 bps since January 2022. A contributor to that spread widening has likely been the declining holdings of MBS in bank portfolios; indeed, the All Commercial Bank Holdings of UST and MBS (RHS-2, pink, $bn) portray this dynamic. With the Fed in balance sheet runoff mode and banks reducing holdings, MBS demand is left more in the hands of other investor types.
CHART 4 LOWER RIGHT
Source: Gzeromedia.com; NCEI; Business Insider; Insurance Information Institute. Other elements of housing affordability include the costs of utilities and homeowner insurance. Portrayed here is the rising cost of home insurance, in tandem with the rising number of large climate events and as the insurance industry increasingly incorporates climate change into its pricing. Confronting issues of this magnitude certainly “takes a village.” In this regard, as part of its “0%-Development Advance” (ZDA) program, FHLB-NY recently launched the “Climate Development Advance” (CDA), which can assist members in originating or purchasing climate or energy efficient-oriented loans/investments to support environmental initiatives (e.g., solar panel loans, farm/agricultural loans, purchases of green/ESG securities). And, ideally, this initiative may also help lower homeowner energy utility costs. For more information on the program, please call the Member Services Desk.
FHLBNY Advance Rates Observations
Front-End Rates
- Short-end rates were modestly changed week-over-week. Net T-bill supply remains robust and is expected to experience further upticks, given the recent announcements from Treasury regarding upsized auctions and issuance needs. But the supply has been absorbed well thus far as Money Market Funds (MMFs) switch from the Fed’s RRP to T-bills with competitive yields. Moreover, FHLB supply has subsided from peak levels of spring, further assisting T-bill interest from investors and thereby containing any severe upward pressure on rates from T-bill supply.
- Economic data should drive direction this upcoming week.
Term Rates
- The longer-term curve, generally mirroring the moves in USTs and swaps, moved notably higher week-on-week, led by the upward move of 22 to 25 bps in the 3-year-and-out zone. The advance curve remains inverted out to 5-year, thereby offering opportunities to extend in advance duration at lower coupon cost. Kindly refer to the previous section for relevant market color.
- On the UST term supply front, the upcoming week serves a 20-year nominal and a 30-year TIPS auction. Note that UST auctions usually occur at 1pm and can cause volatility near that time. Please contact the Member Services Desk for further information on market dynamics, rate levels, or products.
Product Alert: FHLB-NY recently launched the new 0% Development Advance (ZDA) Program providing members with subsidized funding in the form of interest rate credits to assist in originating loans or purchasing loans/investments that meet one of the eligibility criteria under the Business Development Advance, Climate Development Advance, Infrastructure Development Advance, or Tribal Development Advance. This program is intended to support economic development by incentivizing members to provide below-market-rate loans or invest in qualified initiatives. Reservation requests for the program have exceeded the currently available program amount; new requests will be added to the waitlist and filled if previously reserved funds become available. Please contact the Member Services Desk to learn more and/or visit the ZDA Overview page.
Forward Start Advance (FSA): For members with upcoming borrowing or refunding plans, consider the FSA as a method to opportunistically “lock in” rates before advance settlement date. Please contact the Member Services Desk at (212) 441-6600 for more information.
The Symmetrical Prepayment Advance Feature
For those anticipating term funding needs, and with rates on an uptrend, it can be an appropriate juncture to consider our SPA feature. This feature allows the member to capture, at prepayment, changes in the fair value of the advance which are favorable to the member. Contact Member Services Desk to discuss.
Looking for more information on the above topics? We’d love to speak with you!
Questions?
If you wish to receive the MSD Weekly Market Update in .pdf format (includes FHLBNY rate charts) or to discuss this content further, please email the MSD Team.