Member Services Desk
Weekly Market Update
This MSD Weekly Market Update reflects information for the week ending March 1, 2024.
Economist Views
Click to expand the below image.
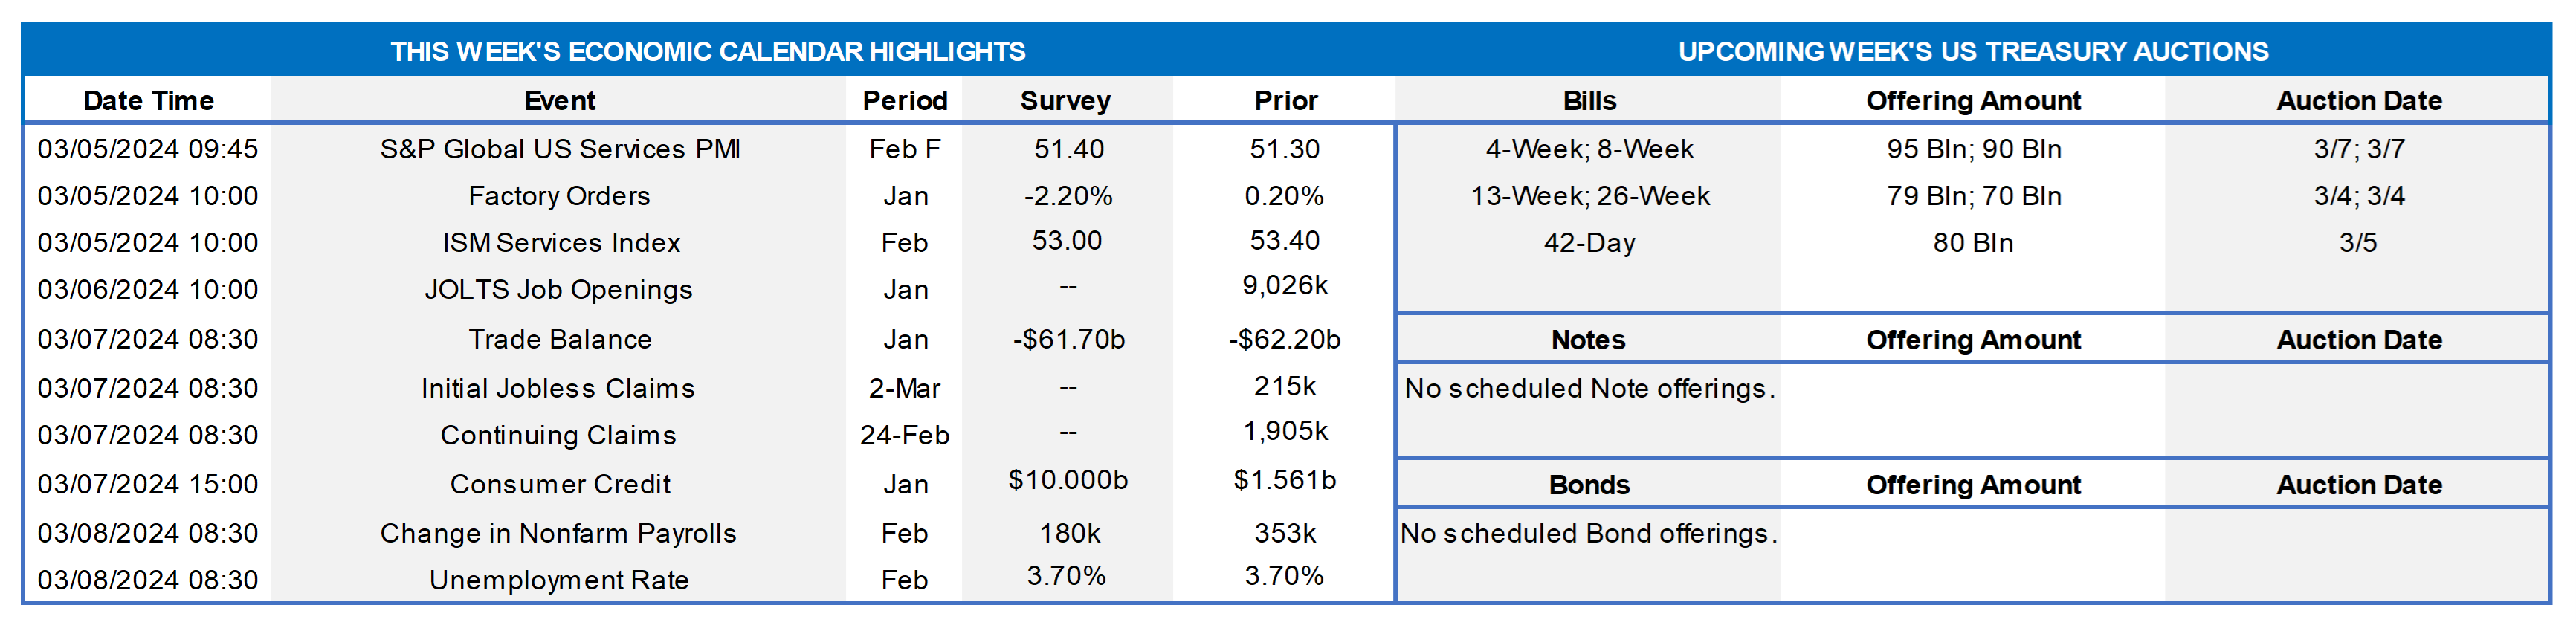
Market participants will face a heavy data calendar and public appearances by Fed officials this week. The marquee economic report will be Friday’s BLS’ update on the employment situation in February. Labor market conditions likely remained extremely tight last month. Recent soundings on initial and continuing jobless claims point to a 250K rise in nonfarm payrolls, after a pair of 300K-plus leaps in November and December. Due to an extremely favorable shift in weather conditions between the January and February establishment survey periods, however, that projection could prove too low. The number of persons unable to work because of inclement weather clocked in at 553K in January, double the average witnessed over the prior ten years for that month. Total private hours worked – a closely followed proxy for nonfarm business output – likely will rebound during the reference period, erasing the .3% January decline. The unemployment rate is expected to hold steady at 3.7% for a fourth straight month. Some relief may be in the offing on the wage inflation front. Average hourly earnings probably edged just .1% higher last month, following the outsized .6% hike at the beginning of 2024. Despite the anticipated slowdown, average hourly nominal compensation would be 4.5% above the level of a year ago. While handful of policymakers, including four current FOMC voters, will hit the lecture circuit, the highlight will be Chair Powell’s delivery of the Federal Reserve’s Semi-Annual Monetary Policy Report to Congress.
Factory Orders: Prompted by a commercial aircraft-led falloff in durable goods bookings, orders likely declined by 3.6% in January, erasing the 2.7% rise recorded over the final two months of 2023.
ISM Services Activity Index: Expansion likely continued for a 14th consecutive month in February, although the breadth of gains probably narrowed slightly to 52.9% from 53.4% in January.
JOLTS Job Openings: A reported dip in online help-wanted postings suggests that nationwide job openings fell by 75K to 8.95mn in January. At an estimated 2.83mn, the excess of vacant positions nationwide would represent 1.36 jobs per unemployed person.
International Trade Balance: An import-led widening of the merchandise trade deficit probably propelled the combined shortfall on international trade to a 3-month high of $63.7bn in January from $62.2bn in the preceding month.
Jobless Claims: Initial claims for unemployment insurance benefits likely remained in a historically low 200-220K range during the filing period ended March 2. Continuing claims – the total number of persons collecting jobless benefits – probably moved back below the 1.9mn mark during the week ended February 24, reversing a portion of the prior period’s 45K rise.
Consumer Credit: Consumer installment credit is expected to have expanded by $10bn in January, after the surprisingly small $1.6bn takedown witnessed in December.
Federal Reserve Appearances:
- Mar. 6 Federal Reserve Chair Powell to testify before the House Financial Services Committee.
- Mar. 6 San Francisco Fed President Daly to give keynote address at National Interagency Community Reinvestment Conference.
- Mar. 6 Federal Reserve to release Beige Book report on district economic conditions.
- Mar. 6 Minneapolis Fed President Kashkari to participate in a moderated discussion at the WSJ’s CFO Network Summit.
- Mar. 7 Federal Reserve Chair Powell to testify before the Senate Banking Committee.
- Mar. 7 Cleveland Fed President Mester to give virtual talk about the outlook to European Economics and Financial Centre.
- Mar. 8 New York Fed President Williams to participate in a moderated discussion held by the London School of Economics.
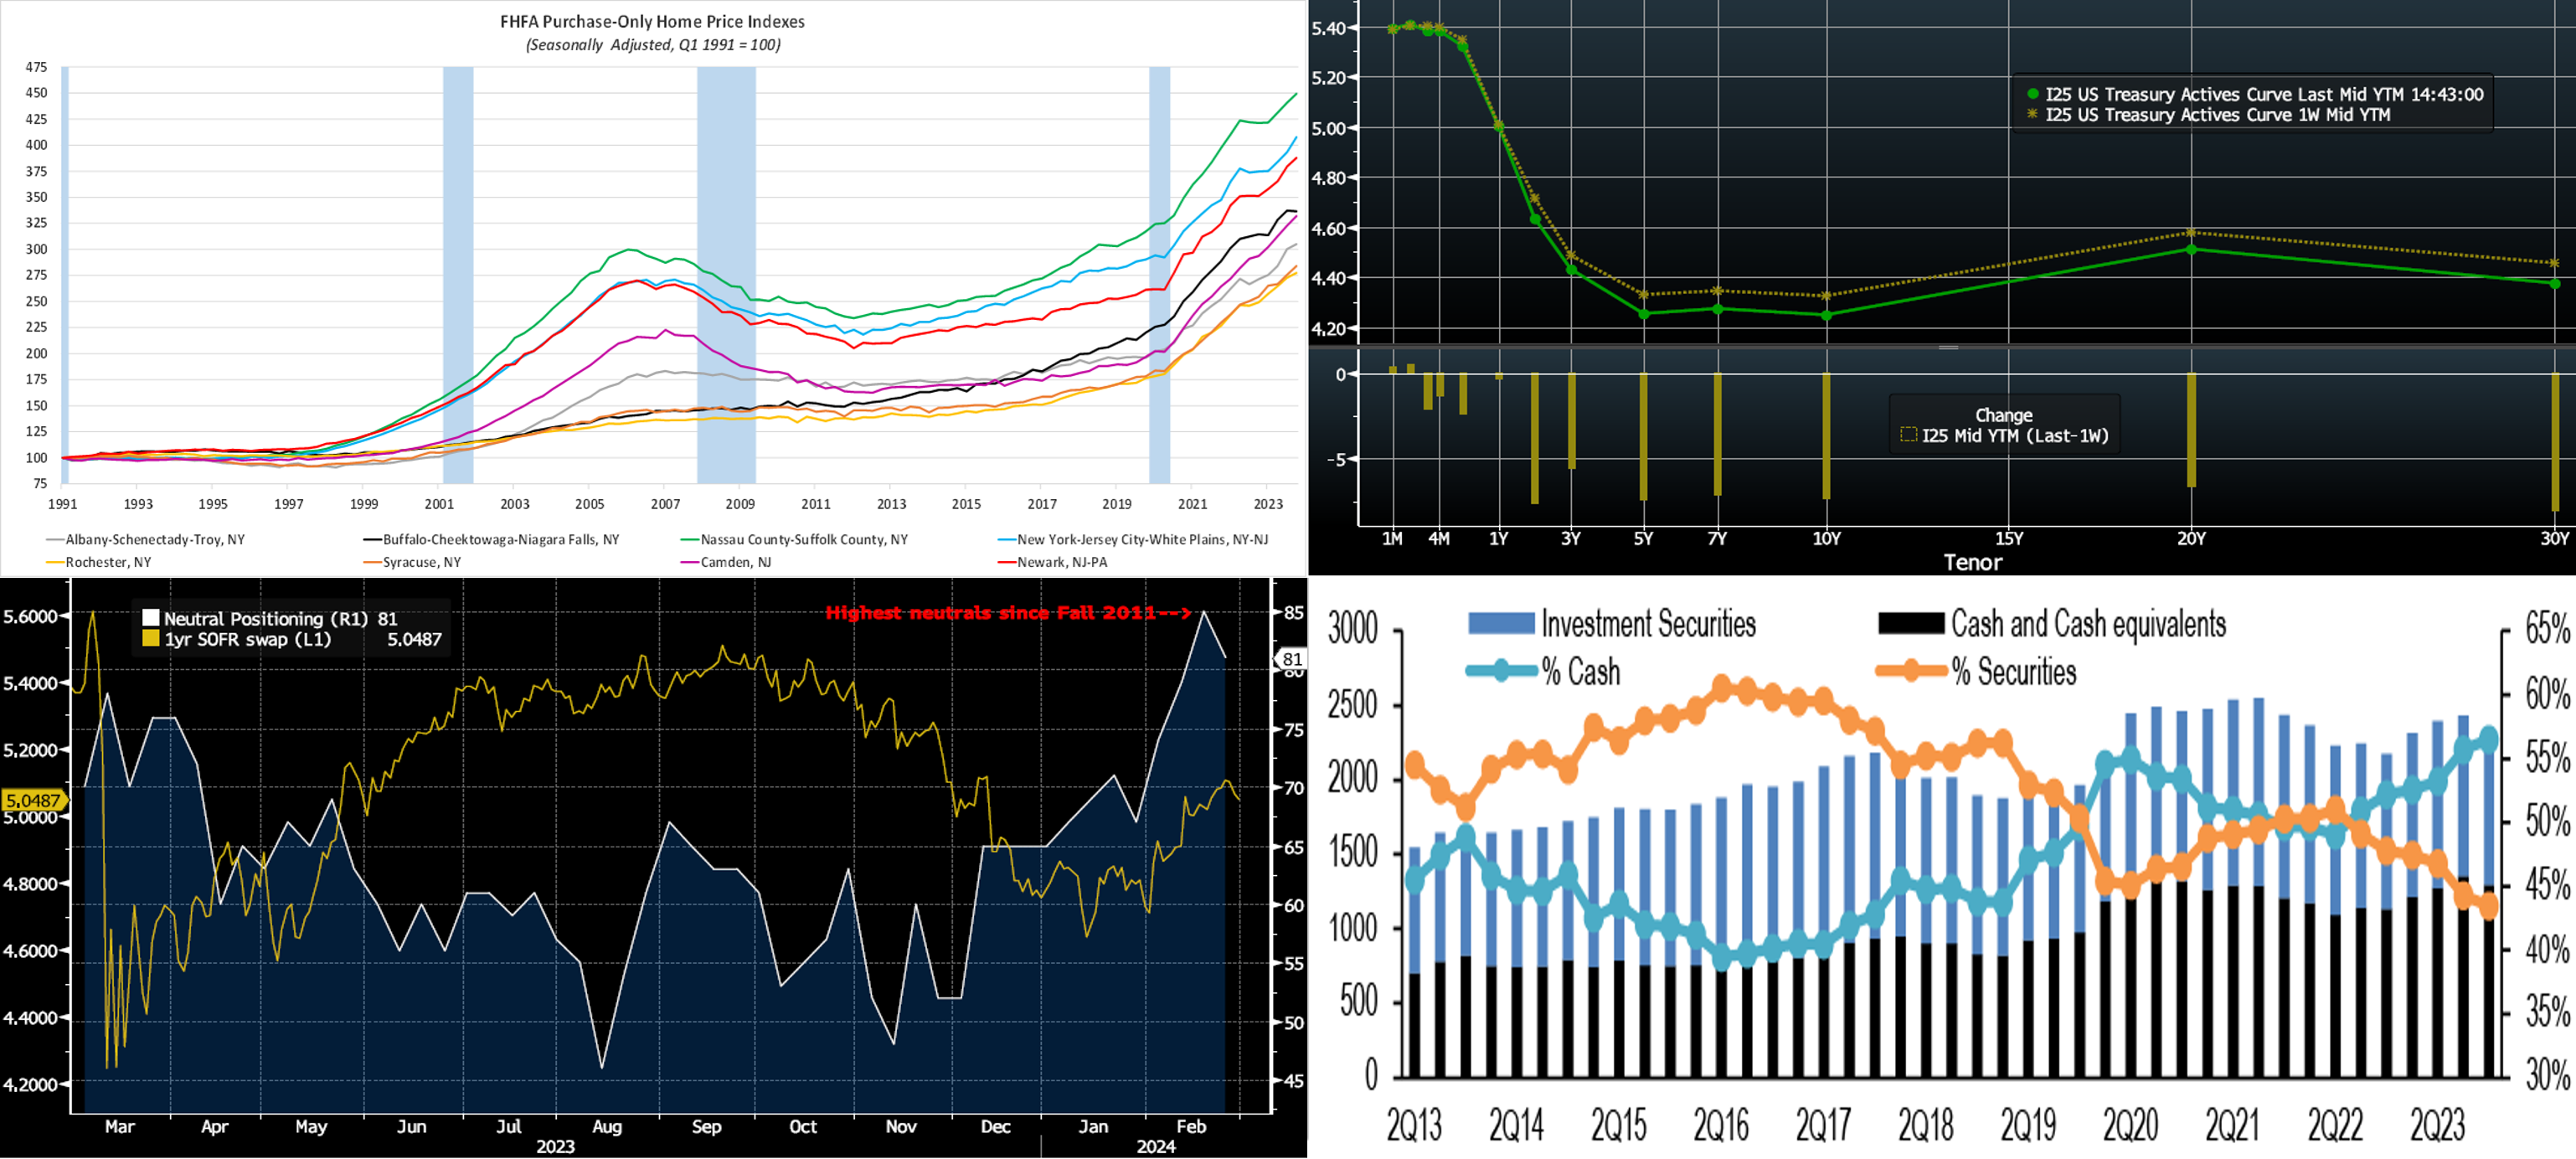
CHART 1 UPPER LEFT
Source: FHFA; FHLB-NY. Note: Blue shaded areas denote recessions. Home selling prices continued to climb across virtually all major metropolitan areas within the FHLB-NY district during the final quarter of 2023. The average price increase witnessed over the October-December span was 2.1%, down from 3.3% over the summer. Over the course of last year, home prices rose by 10.2% on average, following an 8.8% gain in 2022. Enjoying a hefty 13% jump, the Camden, NJ area recorded the largest increase in home-selling prices in 2023. At a comparatively modest 6.7%, Nassau and Suffolk counties posted the smallest. Over the past three years, canvassed areas within the FHLB-NY coverage area have seen home prices rise at an annual rate of 10.8% on average. Likely helping to support prices has been the multi-decade low levels of existing home inventories in recent years, although inventories have risen off the lowest levels of roughly two years ago. Also, note that mortgage rates fell markedly in Q4 2023 from a high of ~7.90% in mid-October to ~6.75% in late-December.
CHART 2 UPPER RIGHT
Source: Bloomberg. Top pane is yield (LHS, %), bottom pane is change (LHS, bps). From last Thursday afternoon to this one, the UST curve declined by ~5 to 7 bps, led by the 5- to 10-year sector. Data and Fedspeak during the week were generally of unsurprising nature, and rates consolidated a bit lower from the rise of recent weeks. In terms of market-implied pricing of the Fed, a full 100% probability of a 25 bp cut is now August 1st, with June 13th FOMC priced at ~73% chance of a cut. The year-end 2024 forward is ~4.515%, roughly the same as last week. Therefore, the market prices for a cumulative total of ~81.5 bps of cuts by the end of 2024, also about the same as a week ago. Perhaps best illuminating the change in markets over the past month is that market pricing for end-2024 is now only ~11 bps below the latest Fed’s “dot plot” projection of 4.625%!
CHART 3 LOWER LEFT
Source: Bloomberg; JP Morgan. Shown here is the “JPM Treasury Investor Survey Sentiment All Client Neutral” positioning index (White, RHS, %) which, in the low-to-mid 80’s zone the past two weeks, has reached the highest levels since 2011. Essentially, this barometer measures investor positioning outright vs. benchmark indices. Positioning has clearly moved to neutral over the past month, in tandem with the market’s repricing upwards of Fed policy, as portrayed here in the upward move of the 1-year SOFR swap rate (Gold, LHS, %) in the past six weeks. At this stage, with positioning more neutral, a surprise data release can potentially spur a notable market move in rates in either direction.
CHART 4 LOWER RIGHT
Source: Bloomberg; JP Morgan. Shown here are investment securities and cash/cash equivalents held by S&P 500’s non-financial companies, both absolute (LHS, $bn) and as a % of aggregate cash portfolios (RHS). Cash investment portfolios of S&P 500 corporates grew by $125bn to $2.3trn over 2023, with cash & cash equivalent allocation at a historical high of 57% at year-end. Corporates increased their balances in Money Market Funds (MMFs) over the year, surely contributing to MMF AUM reaching record levels this year and helping demand for short-end paper.
FHLBNY Advance Rates Observations
Front-End Rates
- Short-end rates were generally 1- to 2 bps higher week-over-week. The market continued to price lower odds of a near-term Fed cut, and this dynamic prompted the slight move higher. Net T-bill supply, after a long spell in positive territory, is now expected to decrease and eventually turn negative next month. This development, all else equal, may help tighten spreads on FHLB paper. Moreover, short-end supply continues to be absorbed as well.
- Money Market Funds (MMFs) currently stand at or near all-time high AUM levels.
The market will monitor data, especially Friday’s jobs report, and Fed speakers this upcoming week.
Term Rates
- The longer-term curve, generally mirroring moves in USTs and swaps, moved 5 to 8 bps lower week-on-week, led by the 5- to 10-year zone. Please refer to the previous section for color.
- On the UST term supply front, the upcoming week serves a reprieve from auctions. Corporate bond supply, however, has been heady and may remain so. Note that UST auctions usually occur at 1pm and can occasionally cause volatility around that time. Please contact the Member Services Desk for further information on market dynamics, rate levels, or products.
Grant funding under the FHLBNY 2023 Small Business Recovery Grant (SBRG) Program has begun and some funds are still available. The SBRG Program provides grant funds to benefit FHLB-NY members’ small business and non-profit customers. Please visit the SBRG webpage.
Price Incentives for Advances Executed Before Noon: In effect as of Tuesday, September 5, 2023, the FHLBNY is pleased to now offer price incentives for advances executed before Noon each business day. These pricing incentives offer an opportunity to provide economic value to our members, while improving cash and liquidity management for the FHLBNY. For further details, kindly refer to the Bulletin.
The Symmetrical Prepayment Advance Feature
For those anticipating term funding needs, and with rates on an uptrend, it can be an appropriate juncture to consider our SPA feature. This feature allows the member to capture, at prepayment, changes in the fair value of the advance which are favorable to the member. Contact Member Services Desk to discuss.
Looking for more information on the above topics? We’d love to speak with you!
Questions?
If you wish to receive the MSD Weekly Market Update in .pdf format (includes FHLBNY rate charts) or to discuss this content further, please email the MSD Team.