Member Services Desk
Weekly Market Update
This MSD Weekly Market Update reflects information for the week ending January 19, 2024.
Economist Views
Click to expand the below image.
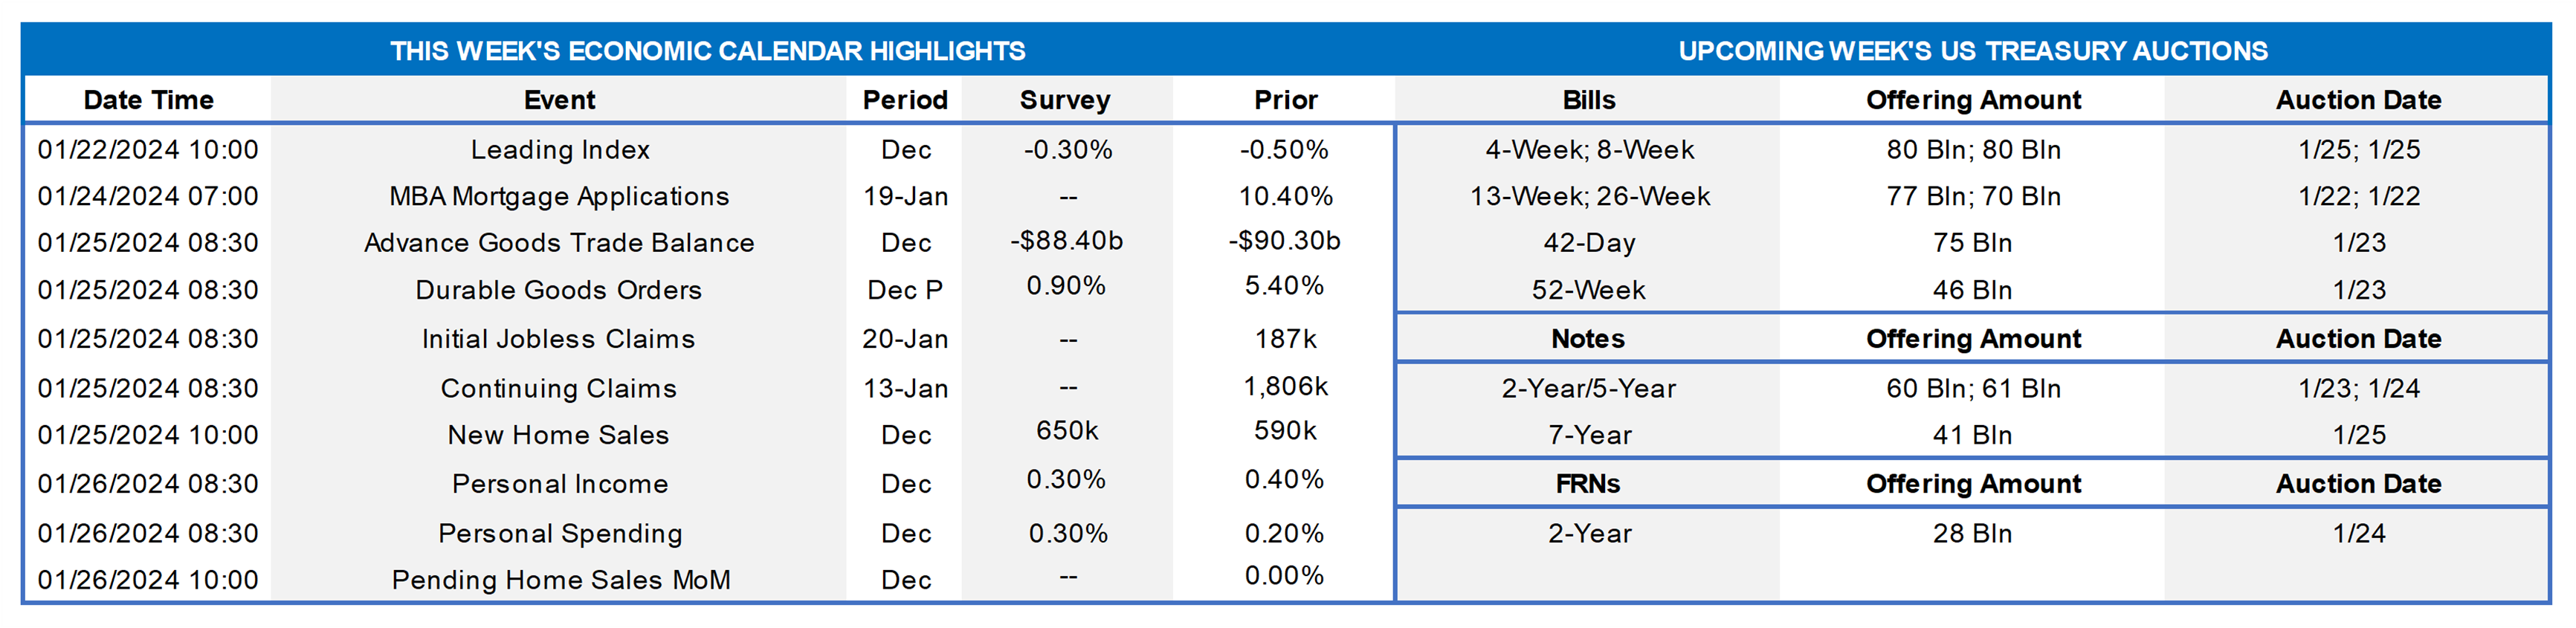
With policymakers observing the traditional blackout period on public appearances ahead of the January 30-31 Federal Open Market Committee meeting, the focus of market participants will be on the economic release calendar. The Bureau of Economic Analysis’ advance report on Q4 real GDP growth will undoubtedly be the marquee release. Inflation-adjusted business activity is expected to have slowed to a 1.8% annualized pace during the Fall, but as is usually the case with the first look, the range of projections is wide. While that projection would be a sharp deceleration from the 4.9% clip witnessed during the summer, it would also mark a sixth consecutive quarter of trend-or-better growth amidst the most aggressive tightening of monetary policy in decades.
Index of Leading Economic Indicators (LEI): The Conference Board’s augur of prospective economic activity is expected to have fallen by 0.3% in December. While that result would mark the 21st straight decline in the LEI, the economy has shown few signs of faltering. Indeed, the Federal Reserve Bank of St. Louis’ smoothed recession probabilities model placed the probability that the economy was contracting in November at a negligible 0.8%.
Merchandise Trade Balance: The merchandise trade gap likely narrowed to $88.4bn in December after an $89.3bn shortfall in the prior month.
Durable Goods Orders: Durable goods bookings probably rose by 0.9% last month, following the jetliner-led 5.4% jump posted in November. Pay attention to nondefense capital goods shipments, excluding commercial aircraft deliveries in December, for clues to the momentum of plant and equipment spending heading into 2024.
Jobless Claims: Initial claims for unemployment insurance benefits likely rebounded from the exceptionally low 187K recorded during the filing period ended January 13 yet remained at a level consistent with historically strong labor market conditions.
New Home Sales: A reported pickup in single-family building permits suggests that new home sales climbed by 8.5% to a seasonally adjusted annual rate of 640K in December. Over the course of 2023, an estimated 664K new dwellings were sold, up from 637K in the previous year.
Pending Home Sales: Buoyed by unusually favorable weather conditions, contracts to purchase an existing dwelling likely rose for the first time since September.
Federal Reserve Appearances: None; Fed officials will observe the usual blackout period on public appearances ahead of the Jan. 30-31 FOMC meeting.
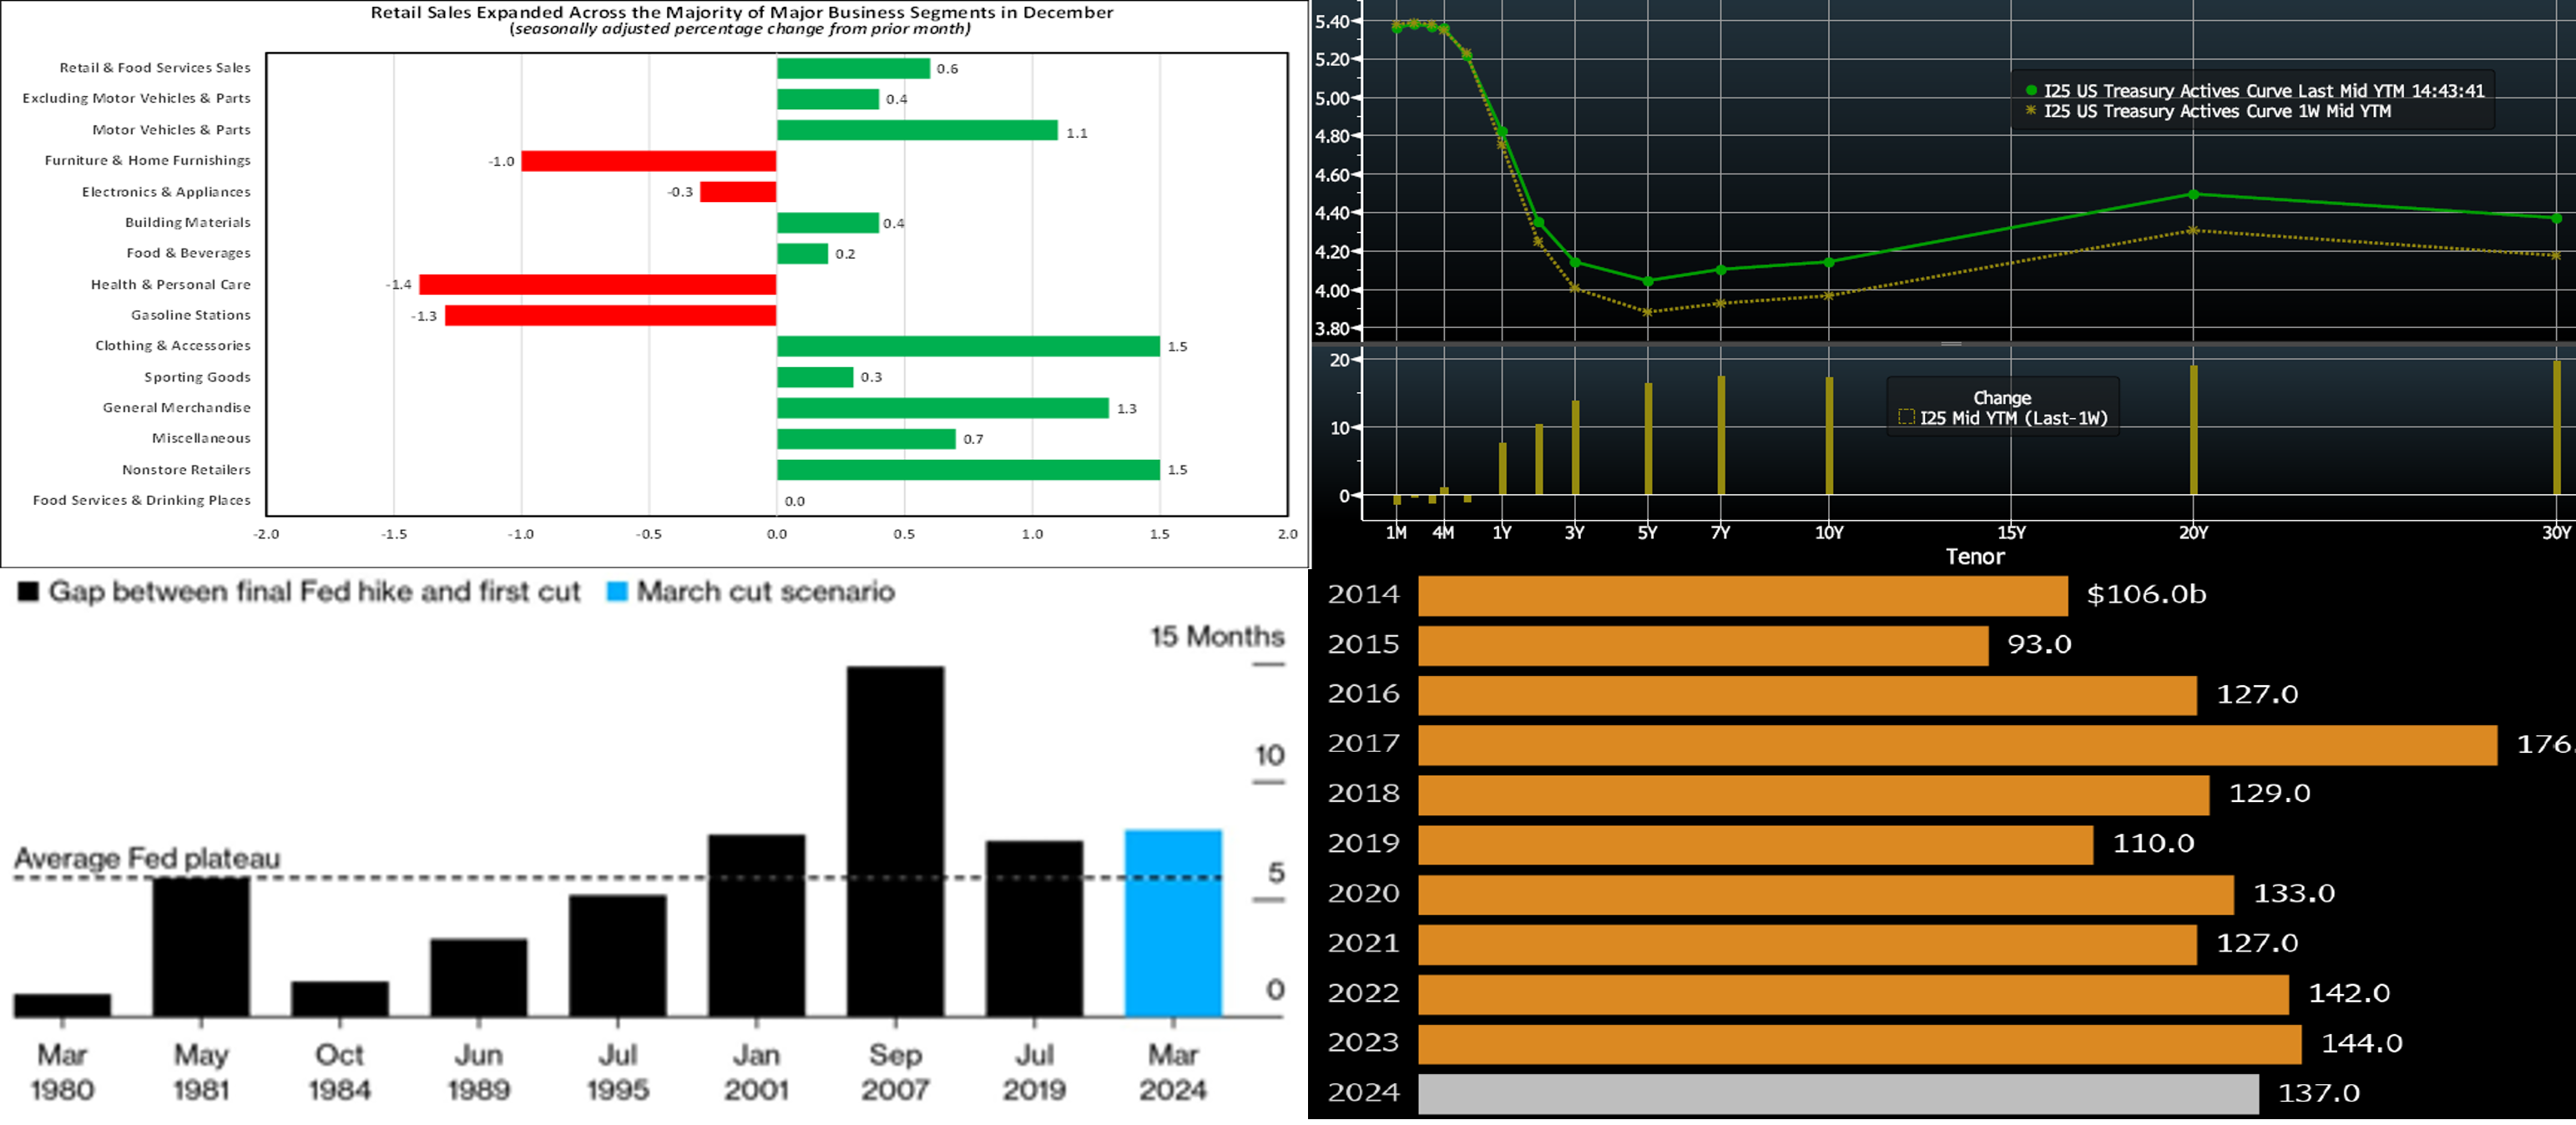
CHART 1 UPPER LEFT
Source: Bureau of Economic Analysis; Census Bureau; FHLB-NY. Consumer spending ended 2023 on a high note. Retail sales and food services sales rose by a larger-than-expected .6% in December, double the .3% gain witnessed in November. While auto-dealer revenues accounted for almost 40% of the increase in sales, eight out of the 13 major segments canvassed by government statisticians witnessed gains last month. Excluding outlays on autos, building materials, and gasoline, retail “control” – the portion of the Census Bureau’s report that is used by the Bureau of Economic Analysis to estimate nominal consumer goods spending – rose by a better-than expected .8%, after an upwardly revised .5% increase in November. December’s pop, along with prior-month adjustments, placed core sales during the fall quarter 4.4% annualized above their July-September average, hinting at yet another solid increase in consumer spending in this week’s advance report on Q4 real GDP.
CHART 2 UPPER RIGHT
Source: Bloomberg. Top pane is yield (LHS, %), bottom pane is change (LHS, bps). From last Thursday afternoon to this one, the UST curve moved higher and steeper, with 2-year-and-out tenors up by 10 to 20 bps. A strong retail sales data released on Wednesday morning, as covered above, served as a major catalyst pushing yields higher. Fed Governor Waller, meanwhile, declared that rates “can and should be lowered methodically and carefully,” which the market took as a note of caution on the prevailing pricing of cuts in the yield curve. In terms of market-implied pricing of the Fed, the chance of a 25p cut in March is ~54%, down from ~70% last week. The year-end 2024 forward is ~3.93%, ~10 bps higher than last week.
CHART 3 LOWER LEFT
Source: Bloomberg; Federal Reserve. The market’s recent pricing of a high probability of a Fed rate cut in March may have used history as a partial guide. As depicted here for data back to 1980, the Fed tends to cut rates roughly six months after its last hike. A prospective cut at the March 20th FOMC would be just shy of eight months since the Fed’s last hike. From this vantage point, a March cut would lag this historical average timeline. But cycles, naturally, vary from each other. With the current economy not displaying an overwhelmingly obvious need for rate cuts yet, the pricing of a cut in March has become more questionable.
CHART 4 LOWER RIGHT
Source: Bloomberg. January of each year typically proves to be a month of heavy Investment-Grade debt issuance, as borrowers and investors turn their focus from holidays and year-end towards the new year ahead. And this month thus far has proved to be no exception. Shown here, through early Thursday, are the monthly issuance totals ($bn) for past years and January 2024-to-date. After more deals on Thursday, the tally for this month-to-date is ~$149bn, with ~$49bn of it issued in the past holiday-shortened week. Issuance is on pace to potentially challenge the past decade’s January record of $176bn in 2017. The supply may have been an additional factor instilling upward pressure on yields this week. Notably, banks have been prominent issuers this past week post-earnings releases; indeed, seven banks issued a total of $35.5bn. More bank issuance is expected as they aim to bolster capital and liquidity metrics.
FHLBNY Advance Rates Observations
Front-End Rates
- Short-end rates were unchanged in shorter tenors but a few bps lower in the 4- to 6-month zone. Although the market pared back its pricing of Fed rate cuts in the past week, the longer maturities nonetheless are gradually crossing further into the curve’s timeline for cuts. Net T-bill supply remains positive, given announcements from the Treasury regarding upsized auctions and issuance needs. But the supply continues to be absorbed well as Money Market Funds (MMFs) switch from the Fed’s RRP to T-bills with competitive yields. Moreover, MMFs currently stand at or near all-time high AUM levels.
- The market will focus on economic data this upcoming week, given that the Fed will be in pre-meeting blackout mode.
Term Rates
- The longer-term curve, generally mirroring moves in USTs and swaps, moved higher and steeper on the week, with the 2- to 10-year sector ~7 to 18 bps higher. Please refer to the previous section for color.
- On the UST term supply front, the upcoming week serves 2/5/10-year auctions. Note that UST auctions usually occur at 1pm and can occasionally cause volatility around that time. The usual heavy January corporate bond issuance calendar should also feature in the week ahead. Please contact the Member Services Desk for further information on market dynamics, rate levels, or products.
Price Incentives for Advances Executed Before Noon: In effect as of Tuesday, September 5, 2023, the FHLBNY is pleased to now offer price incentives for advances executed before Noon each business day. These pricing incentives offer an opportunity to provide economic value to our members, while improving cash and liquidity management for the FHLBNY. For further details, kindly refer to the Bulletin.
The Symmetrical Prepayment Advance Feature
For those anticipating term funding needs, and with rates on an uptrend, it can be an appropriate juncture to consider our SPA feature. This feature allows the member to capture, at prepayment, changes in the fair value of the advance which are favorable to the member. Contact Member Services Desk to discuss.
Looking for more information on the above topics? We’d love to speak with you!
Questions?
If you wish to receive the MSD Weekly Market Update in .pdf format (includes FHLBNY rate charts) or to discuss this content further, please email the MSD Team.