Member Services Desk
Weekly Market Update
This MSD Weekly Market Update reflects information for the week of May 23, 2022.
Economist Views
Click to expand the below image.
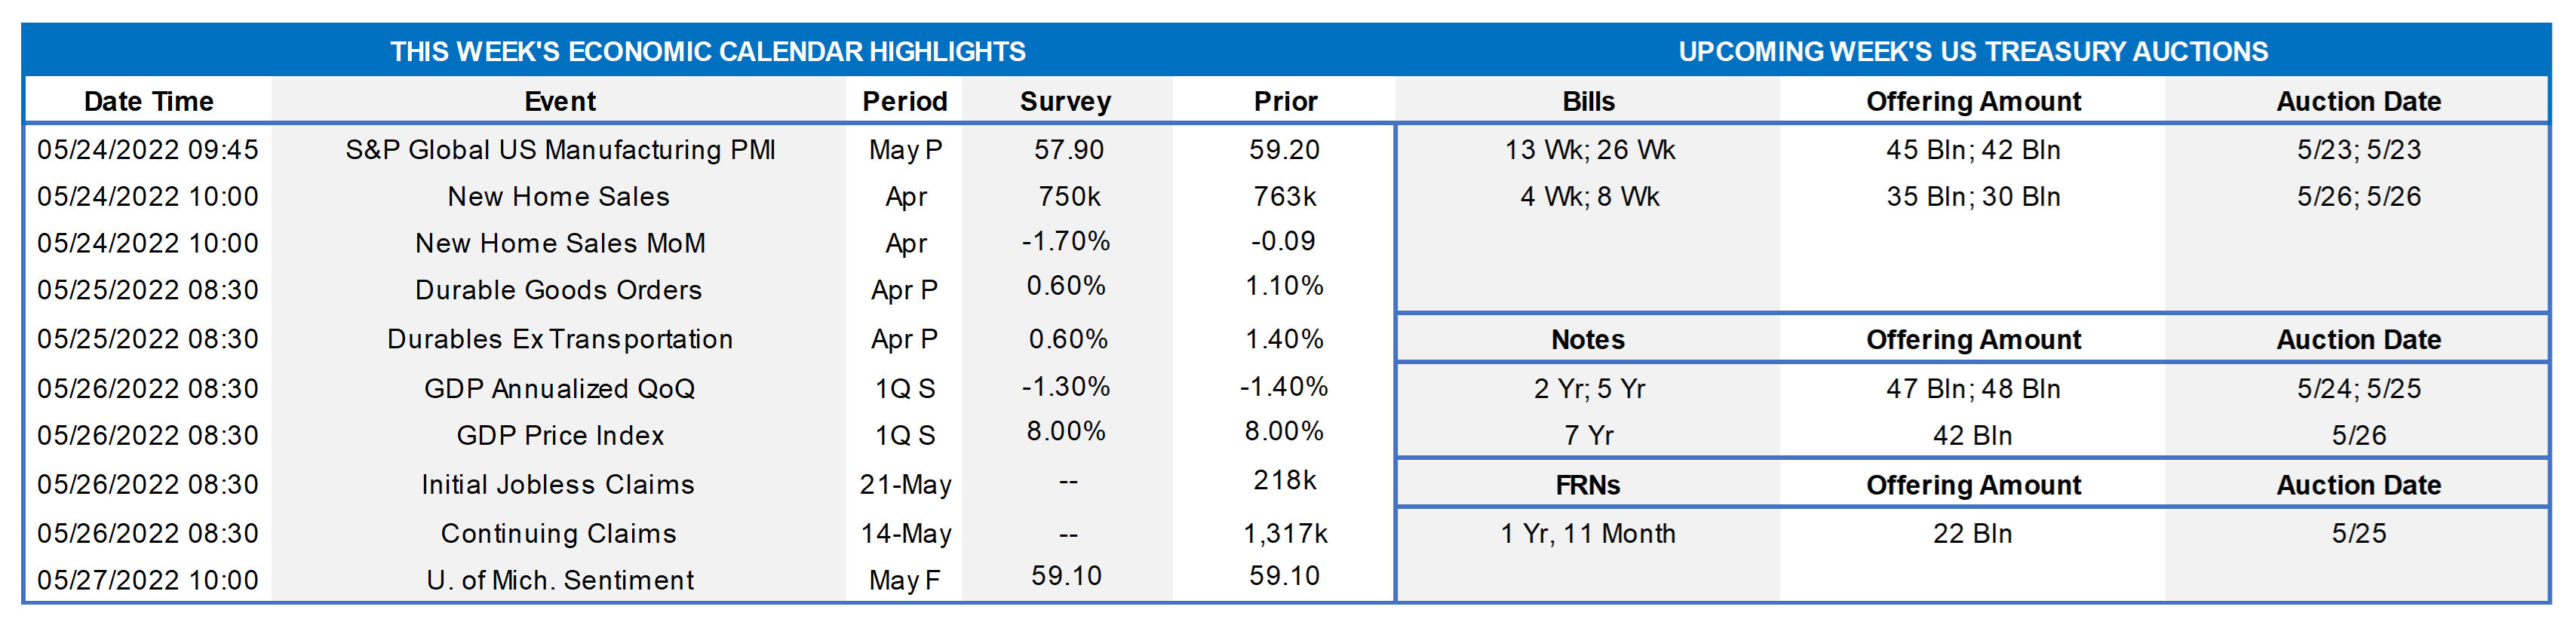
Market participants will assess this week’s slate of economic reports for clues to the pace of current-quarter growth. A significantly wider international trade gap, inventory liquidations, and reduced government outlays triggered a 1.4% annualized contraction in real GDP in Q1. While the median projection calls for a 3.0% annualized gain over the April-June period, the range of forecasts is extremely wide, extending from a modest .1% uptick to a 5% jump. The Federal Reserve speech calendar will be unusually light. The minutes from the May 3-4 Federal Open Market Committee will provide useful color on policymakers’ thoughts on the pace of removing monetary accommodation.
New Home Sales: Reported declines in single-family building permits and housing starts suggest that new home sales retreated again in April. The Street expects contract signings to dip by 1.1% to a 5-month low of 755K in this week’s report.
Durable Goods Orders: Capped by an anticipated dip in transportation equipment requisitions, durable goods orders likely climbed by .5% in April, after a 1.1% rise in March. Excluding the projected pullback in transport orders, “hard goods” bookings are expected to have edged .6% higher during the reference period and jumped by 7.9% over the latest 12 months. April’s nondefense capital goods shipments excluding commercial jetliner deliveries will be watched closely to gauge the strength of business equipment spending at the beginning of the spring quarter.
Real GDP Growth: Data released since the BEA’s advance report suggest that the contraction in real GDP growth during the first quarter may have been marginally smaller than previously thought.
Jobless Claims: With available positions eclipsing the number of jobless persons by a historically wide margin, initial and continuing state unemployment insurance claims likely moved lower in their respective reporting periods.
Pending Home Sales: Contracts to purchase an existing dwelling are expected to have fallen by 2% in April, boosting the cumulative decline since last October to 17%.
Merchandise Trade Balance: The merchandise trade deficit is projected to narrow to $114.8bn in April from $127.1bn in the preceding month, hinting at a significantly smaller drag on current-quarter real GDP growth.
Personal Income & Spending: Powered by a projected increase in wages and salaries, personal income probably rose by .5% in April, after a similar gain in March. Consumer spending is expected to have risen by .6% during the reference period, or by .4% in real terms after adjustment for anticipated price increases.
Federal Reserve Appearances:
- May 23 Atlanta Fed President Raphael Bostic discusses the economic outlook at an event in Atlanta.
- May 23 Kansas City Fed President Esther George to give a speech at an agricultural symposium hosted by her bank.
- May 25 Federal Reserve to release minutes of May 3-4 FOMC meeting.
Click to expand the below image.
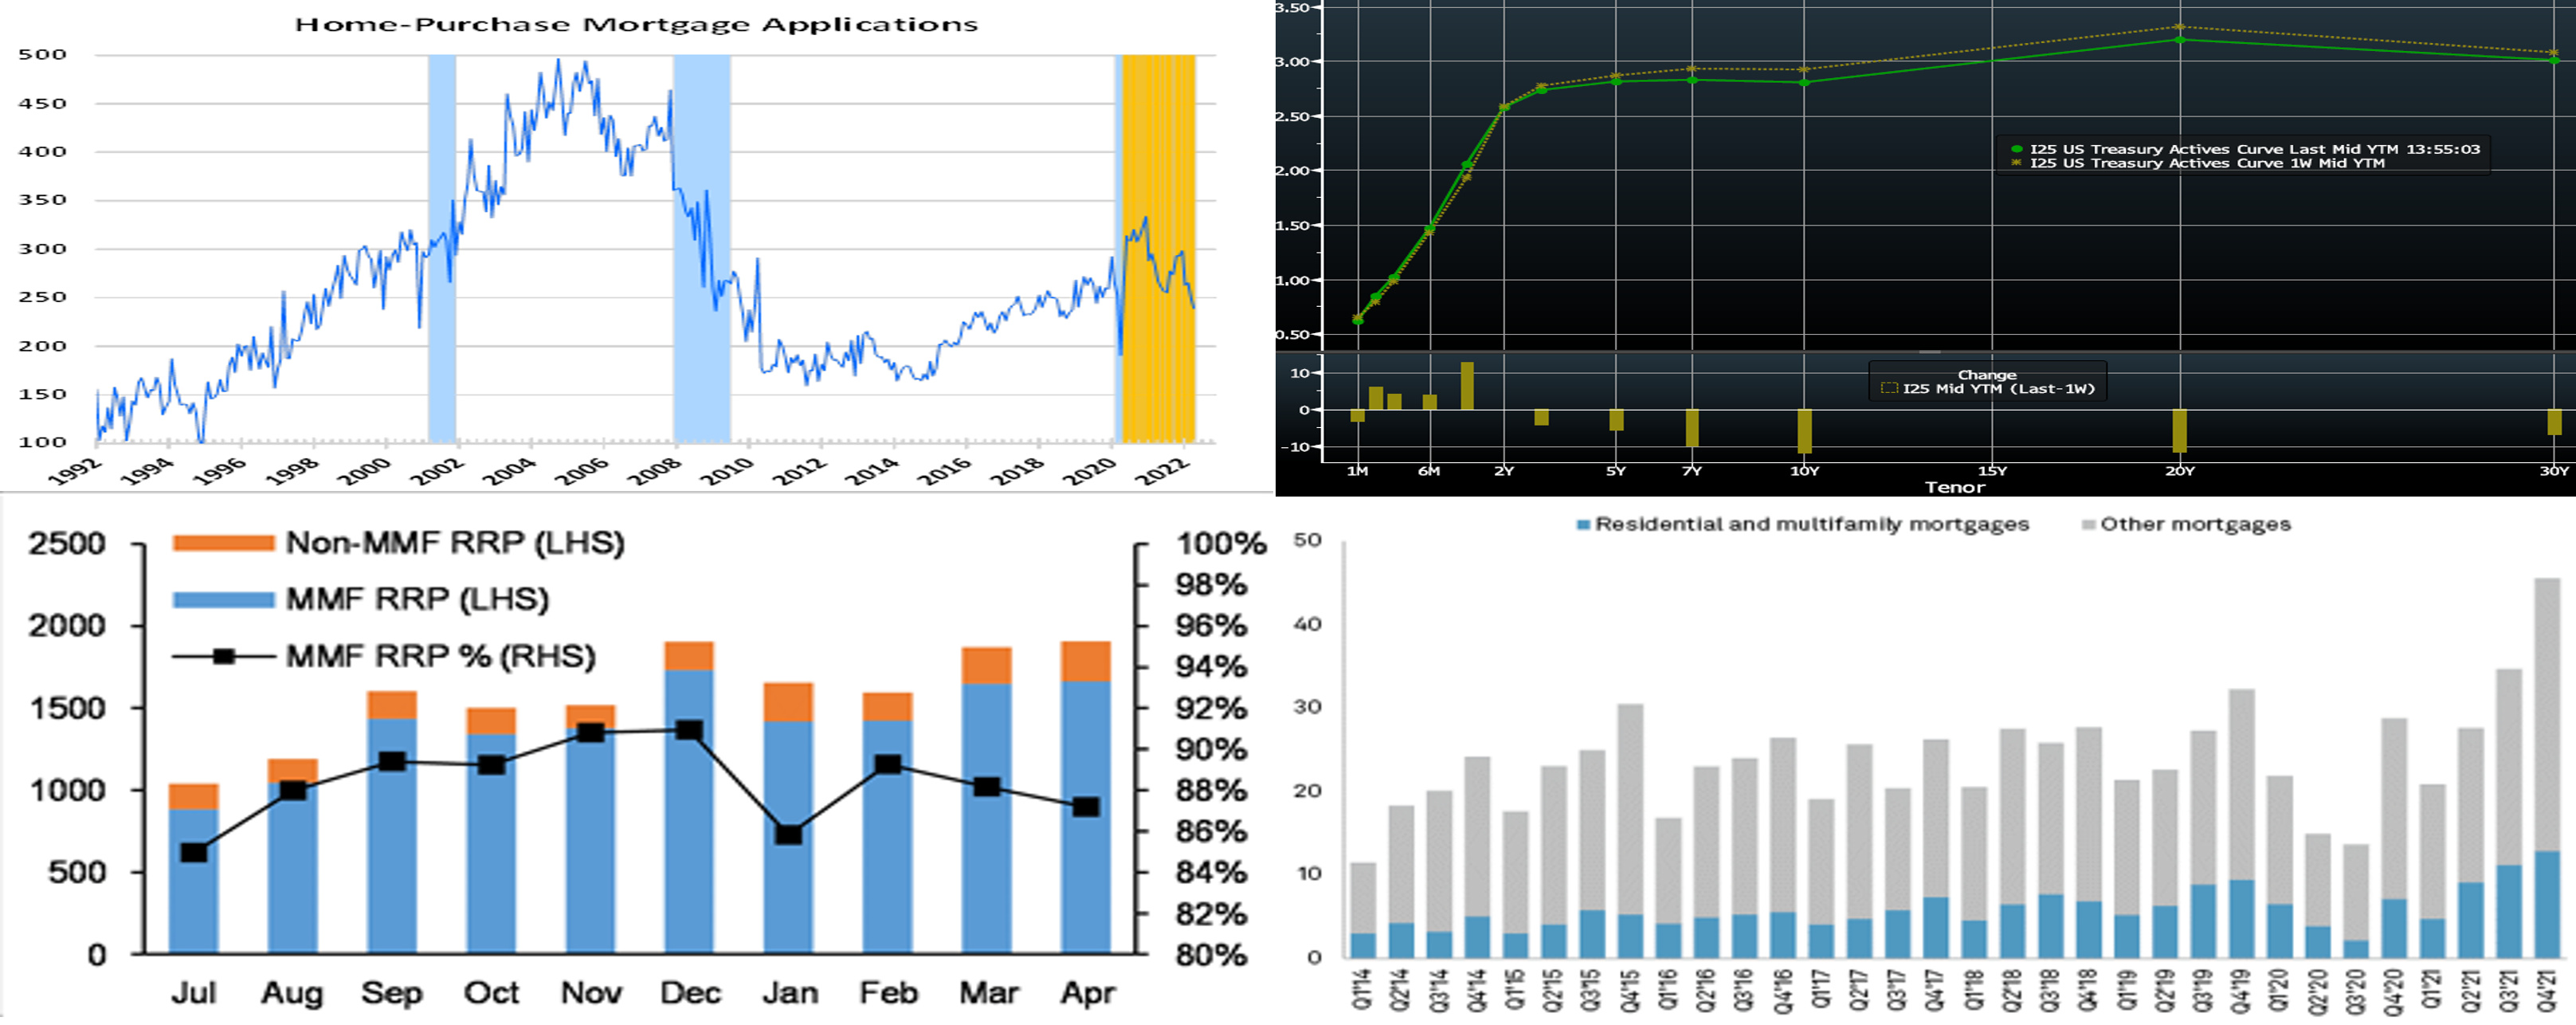
CHART 1 UPPER LEFT
Source: Mortgage Bankers Association, NBER, FHLB-NY. Notes: Blue-shaded areas denote recessions and Orange-shaded areas are current economic expansion. Already constrained by a dearth of available dwellings on the market, mortgage applications are suffering from the dramatic increase in mortgage rates. The 30-year mortgage rate has risen to ~5.5% from sub-3% back in early-2021. Off almost 30% from the expansion peak set in January 2021, the month-to-date level of the MBA’s purchase barometer stands at the lowest level since the pandemic trough of April 2020. Owing to the plunge in refinancings, purchase loans have risen to ~60% of new originations, of which about half are first-time homeowners, and so lending to first-time homeowners will be crucial to sustaining mortgage-banking growth. While rising rates affect all borrowers, first-time buyers with no tailwind from record home-price appreciation are particularly sensitive to declining affordability. In this regard, we encourage our members to utilize our housing programs (Affordable Housing Program and Homebuyer Dream Program; please visit our Housing Programs page).
CHART 2 UPPER RIGHT
Source: Bloomberg. Note: Top pane is yield (%), bottom pane is change (bps). Intermediate and long-term yields were lower week-over-week, led by the 7 to 10-year sector which was 10 to 12 bps lower. After the runup in yields of recent months, the market experienced additional short-covering from trading-oriented investor types. Also, longer yields declined partly owing to the market’s potentially budding view that the tightening of financial conditions may now serve to quell the pace of inflationary forces and spur an economic slowdown. Indeed, the 5-year “Breakeven” inflation rate on TIPS fell by ~17 bps to 2.89% from the week prior, and various Street economists have edged lower their GDP forecasts. Yields also attracted flight-to-quality demand, as the S&P 500 was ~5% lower on the week and ~20% lower YTD as of Friday afternoon. The market remains volatile, and we highly encourage members to monitor rates and engage with the desk for information and color.
CHART 3 LOWER LEFT
Source: Crane Data; JP Morgan. In last week’s edition, we covered some recent cash-rotation dynamics recently experienced in the financial ecosystem, namely that of bank deposits dipping while the Fed’s RRP and the Treasury General Account (TGA) experienced increases. Some of this flow towards the TGA was attributable to tax payments. And the increase in RRP was partly attributable to cash moving towards Money Market Funds (MMFs) which now, owing to recent Fed hikes and a higher rates complex, offer more compelling net-of-fees yields than many bank deposits. The Fed’s RRP, yielding .80%, is a popular investment vehicle for MMFs with access to it. As seen here, MMFs comprise ~87% (RHS) of the RRP balance (LHS, $bn). This past Thursday the RRP hit a fresh all-time high balance of $1.981trn, albeit much of this past week’s increase was attributed to GSE inflows (GSEs invest mortgage loan payments received from homeowners until paying their bondholders; cash typically enters the market each month around the 18th and exits by the 25th) and to the TGA balance being pared back (thereby putting cash back into the financial system), as opposed to being caused by MMFs.
CHART 4 LOWER RIGHT
Source: S&P Global Market Intelligence. As seen here, housing-related mortgage loan acquisitions (LHS, $bn) by US life insurers experienced strong growth in 2021, particularly in its final quarter. With notably higher rates and wider spreads having developed in 2022, this growth is likely ongoing. We encourage members to consider FHLB-NY as an efficient and attractive resource for funding and/or expanding investment strategies. In addition to bullet advances, note that we also offer amortizing advances that can help insurance members to structure the funding versus expected incoming premiums and thereby refine and lower risk on ALM and spread investment strategies.
FHLBNY Advance Rates Observations
Front-End Rates
- Short-end Advance rates finished mixed week-over-week, with shorter tenors down a few bps but those 2-month and longer higher by 4 to 5 bps. Short-end market flows have been volatile in recent weeks, thereby leading to dynamic intraday and day-to-day moves in rates. Meanwhile, the market’s ongoing aggressive pricing of forthcoming Fed rate hikes has served to trend advance rates higher. As of this past Friday afternoon, the market priced for a 100% probability of a 50 bps and ~10% chance of a 75 bps hike at the June 15th FOMC meeting. The July meeting is priced for a 50bps hike thereafter. This pricing, and the fact that maturities are crossing further into the timeline of the Fed hiking cycle, contributed to the moves.
- Given the Fed tightening posture and upcoming FOMC meetings, rates will remain highly responsive to the market’s moves and pricing of the Fed.
Term Rates
- Longer-term rates finished lower, week-over-week, and mirrored and slightly outpaced moves in the UST market. While 2-year was ~9 bps lower, 5 and 10-year were close to 20 bps lower. Kindly refer to the previous section for relevant market color.
- On the UST term supply front, this upcoming week brings 2, 5, and 7-year auctions. Given ongoing market volatility, members should monitor conditions for potentially more optimal timing on transactions. Please call our Member Service Desk for information on market dynamics, rate levels, or products.
Product Alert: FHLBNY is pleased to announce enhancements to our Advance Rebate Program, which provides members an opportunity to receive a cash rebate when prepaying an eligible advance and rebooking a new advance within a 30-day period. Rebate-eligible advances now must have a minimum of 6-months (reduced from 1-year) remaining. Moreover, the potential cash rebate has been increased. This program can be suitable for those wishing to extend their liability duration and/or potentially improve net interest margin. Please call the Member Service Desk at (212) 441-6600 for more information.
Forward Start Advance (FSA): For members with upcoming borrowing or refunding plans, consider the FSA as a method to opportunistically “lock in” rates before advance settlement date. Please call the Member Service Desk at (212) 441-6600 for more information.
The Symmetrical Prepayment Advance Feature
With rates at or near multi-year lows, it is a compelling juncture to use the SPA feature on term advances. This feature allows member to capture, at prepayment, changes in the Fair Value of the advance which are favorable to the member. Contact us to discuss.
Looking for more information on the above topics? We’d love to speak with you!
Questions?
If you wish to receive the MSD Weekly Market Update in .pdf format (includes FHLBNY rate charts) or to discuss this content further, please email the MSD Team.