Member Services Desk
Weekly Market Update
This MSD Weekly Market Update reflects information for the week ending February 10, 2023.
Economist Views
Click to expand the below image.
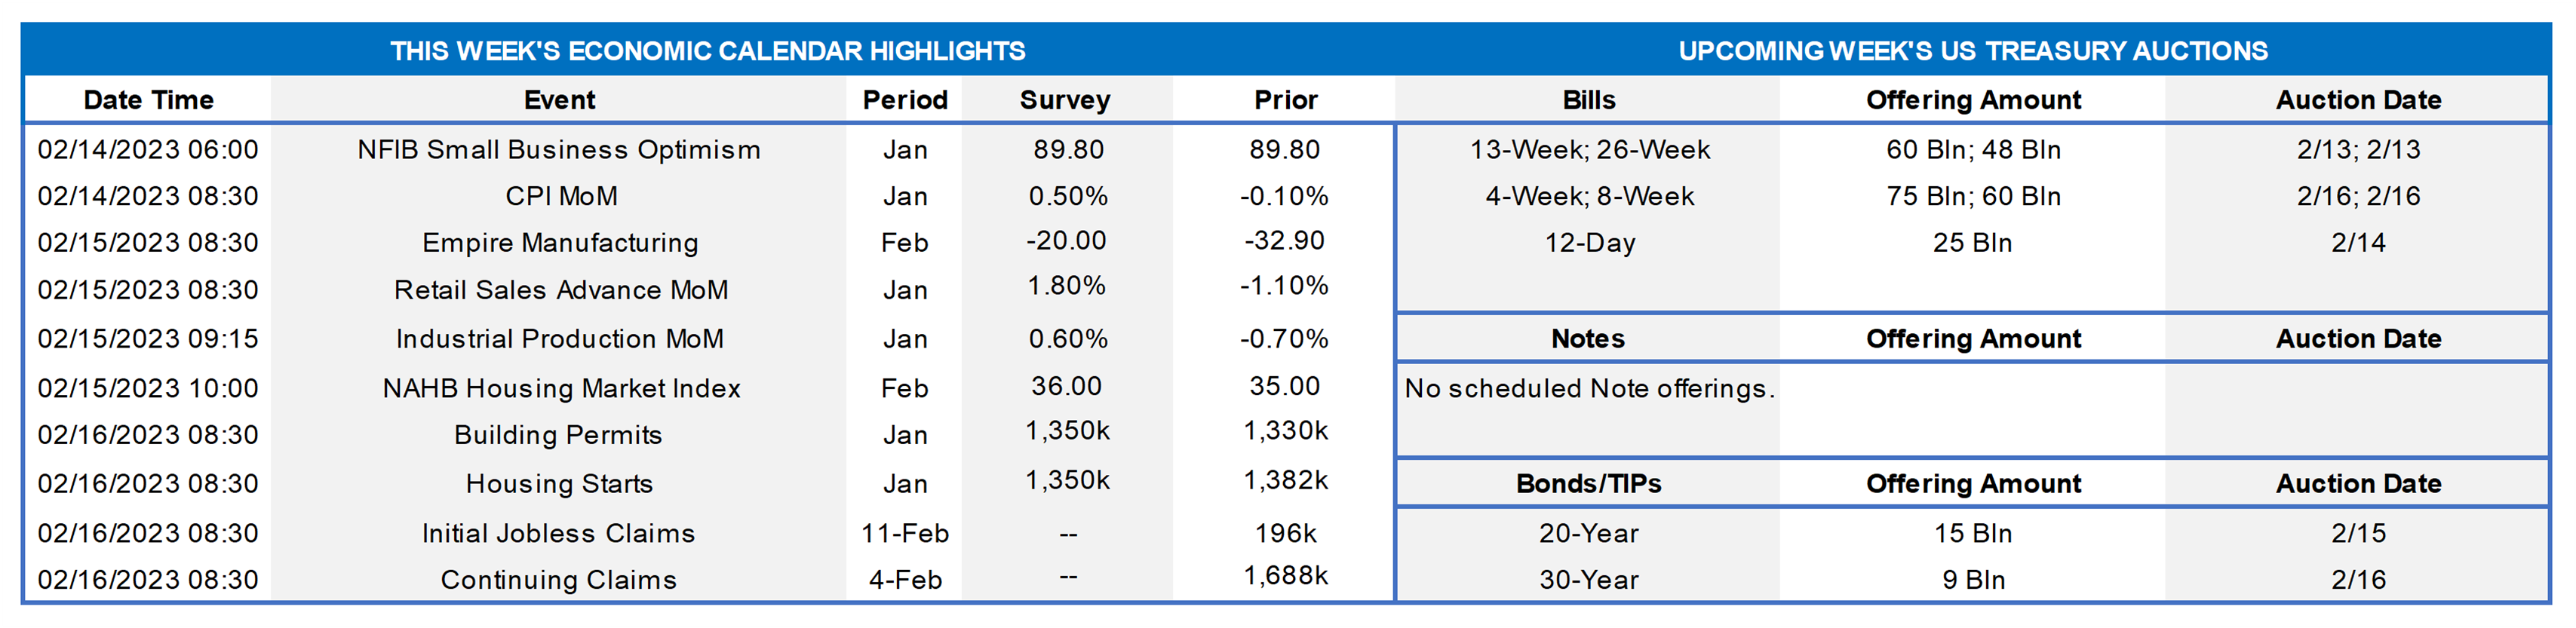
Market participants will contend with a crowded data calendar and public appearances by a quintet of Fed officials this upcoming week. Since the January jobs report, the spate of hawkish comments from policymakers suggests that the Bureau of Labor Statistics (BLS) update on consumer prices will be the most important data. However, figures on retail sales, industrial production and home-building activity last month will allow economists to get a better handle on current-quarter real GDP growth. With little hard data to go on, the range of available estimates is wide, extending from a 2.5% annualized contraction to a well-above-trend 4.6% annualized gain. The Atlanta Fed, which marks to market their tracking estimate after each new economic report, is currently calling for a 2.2% annualized advance in Q1, following the fall quarter’s 2.9% annualized rise.
Consumer Prices: The BLS is expected to report that inflation reaccelerated at the beginning of 2023. Higher energy prices, along with a broad-based pickup in non-energy goods and services costs, likely propelled the CPI .5% higher in January, after a .1% dip in December. Excluding volatile food and energy items, the so-called core CPI is expected to climb by .4% – the largest one-month increase since last September. Those projections, if realized, would place the overall and core CPIs 6.2% and 5.5% above their respective year-ago levels – both well above Fed’s desired 2% target.
Empire State Manufacturing Survey: Manufacturing activity in New York State likely contracted for a third straight month in early February, although the net percentage of survey respondents witnessing a falloff in activity probably narrowed from January’s -32.9% reading.
Retail & Food Services Sales: Led by an anticipated leap in auto dealership revenues, retail and food services sales probably rose by 2% in January – the largest gain since the beginning of last year. Excluding the projected pop in motor vehicle sales, retail purchases are expected to have climbed by .7%, recouping a little over one-third of the 1.7% decline witnessed over the November-December span. Market participants will pay attention to so-called “control” sales, excluding auto, building materials, and gasoline purchases. Barring any prior-month revisions, the .7% rise anticipated by the Street would place core purchases in January .4% annualized above their October-December average, after a 1.9% annualized fall-quarter gain.
Industrial Production & Capacity Utilization: Activity at the Nation’s factories, mines and utilities likely rebounded in January, erasing December’s .7% decline. With additions to productive capacity expected to grow during the reference period, the overall operating rate probably moved four ticks higher to 79.2%.
NAHB Housing Market Index: Buoyed by ongoing reductions in rates, the National Association of Home Builders’ sentiment gauge likely climbed to a five-month high of 40 in early February.
Housing Starts & Building Permits: Residential building activity is expected to have been mixed in January. The number of building permits issued likely climbed by 1% to a seasonally adjusted annual rate of 1.35mn, while new starts dipped by 1.4% to 1.36mn – the fewest groundbreakings since the 1.27mn posted in June 2020.
Jobless Claims: New claims for unemployment insurance benefits probably remained below the 200K mark for a fifth straight week during the period ended February 10. Keep an eye on continuing claims, which have clocked in below the 1.7mn mark since mid-December, for any signs that recently furloughed employees may be having a more difficult time finding work.
Federal Reserve Appearances:
- Feb. 14 Dallas Fed President Lorie Logan to take part in a moderated discussion hosted by Prairie View A&M University, TX.
- Feb. 14 New York Fed President John Williams to give the keynote speech at an event hosted by the New York Bankers Assn.
- Feb. 16 St. Louis Fed President Bullard to discuss the outlook with the Greater Jackson County Chamber in Jackson, TN.
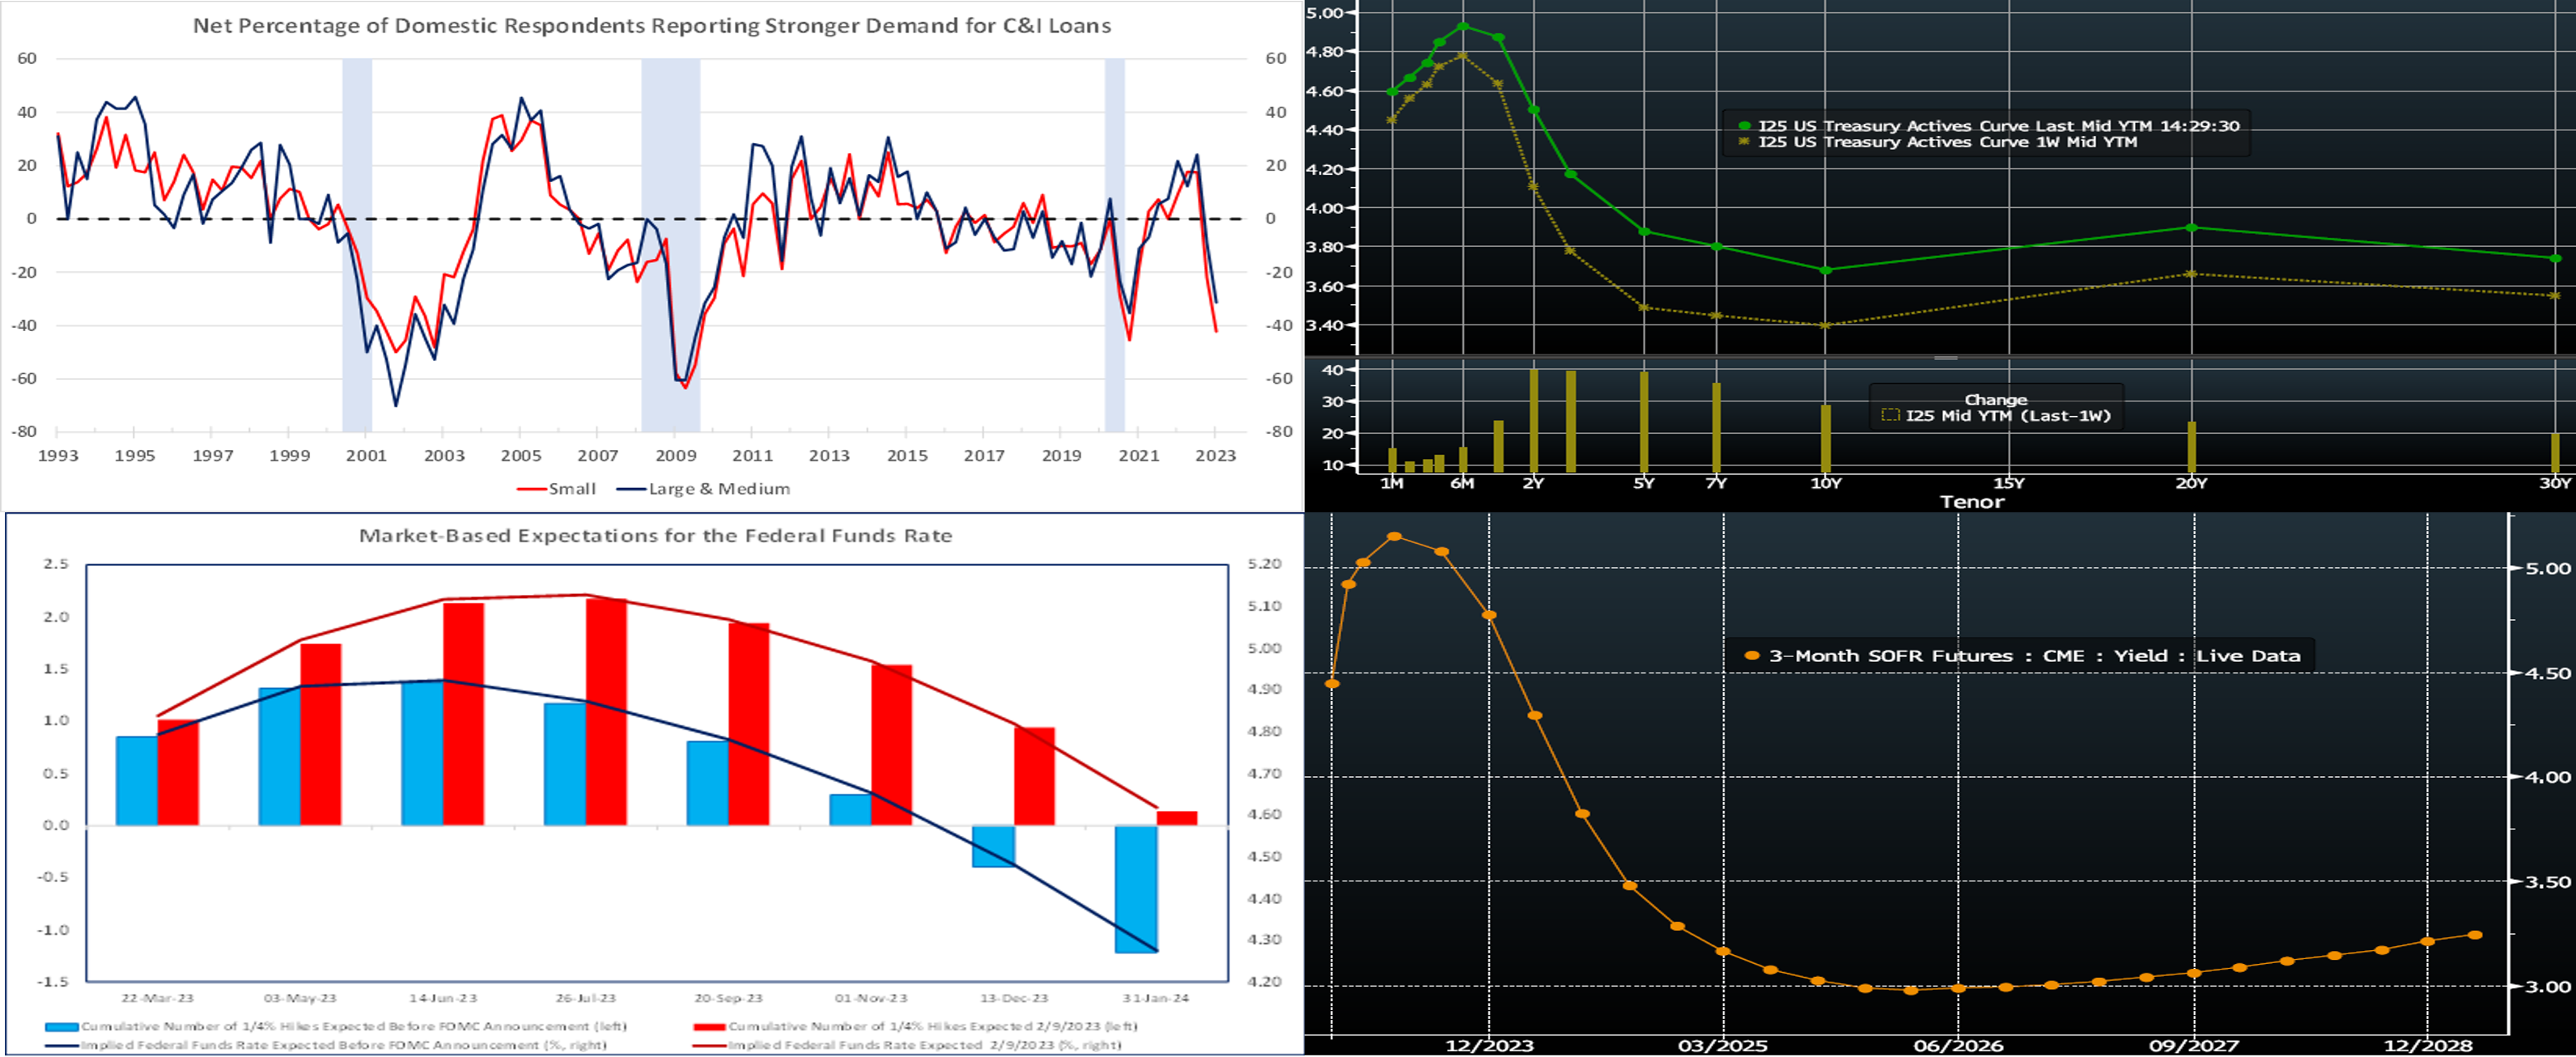
CHART 1 UPPER LEFT
Source: Federal Reserve Board; National Bureau of Economic Research; FHLB-NY. Note: Shaded areas denote recessions. The Federal Reserve Board’s January 2023 Senior Loan Officer Opinion Survey on Bank Lending Practices revealed a general tightening of standards and reduced demand across all borrowing categories during the fall quarter. The net percentages of commercial bank loan officers reporting tighter lending standards for C&I loans to large & medium and small firms registered at 44.8% and 43.8%, respectively, during the reference period, thereby marking the broadest firming in practices since the spring of 2020. The diffusion of demand for loans from large and medium companies contracted sharply as well, tumbling to -31.3% from -8.8% in October – the weakest reading in 27 months. Demand for loans from smaller firms deteriorated by a nearly equivalent amount in the final quarter of 2022, with the relevant diffusion measure tumbling from -21.9% to -42.2%, also marking the softest result since the summer of 2020.
CHART 2 UPPER RIGHT
Source: Bloomberg. Top pane is yield (LHS, %), bottom pane is change (bps). UST term yields moved markedly higher week-over-week, led by the 2 to 5-year sector’s rise of ~40 bps. The main catalyst to the upwards move was last Friday’s stronger-than-expected jobs report. In the aftermath, the market has notably repriced the prospective path of the Fed; basically, the market has pushed it’s pricing of near–term Fed hikes higher, while also pushing out the timeline of an easing cycle; see below for more specific color. Adding fuel to the move this week was a slug of UST supply as well as Fed member comments espousing the mantras of “need to do more” and “higher for longer.” This coming Tuesday’s CPI report will be a key data point for the Fed and markets.
CHART 3 LOWER LEFT
Source: Bloomberg. Here the notable shift can be seen, as mentioned above, in the market’s pricing (implied by futures and swaps market curves) of the prospective path of the Fed Funds effective rate. Shown is the market’s current (as of midday Thursday) pricing compared to that prior to the February 1st FOMC. With the market’s recent upsizing of Fed hikes, as well as “pushing out” the timeframe of potential future easing, the disconnect between market pricing and the Fed’s “dot plot” projections has narrowed. For instance, while the Fed’s latest “dot plot” median projection for year-end 2023 is ~5.125%, the market’s pricing for end-2023 is now ~4.85% from the pre-FOMC level of ~4.45% and last week’s level of ~4.385%. The market has also priced higher the peak rate to ~5.145% for this summer from the mid-4.80’s prior to the FOMC and of a week ago (pre-jobs report), and so the disconnect on the peak rate level has narrowed too. While Fed members have promoted a “higher for longer” rates posture, the market still prices for an easing timeline at odds with Fed projections.
CHART 4 LOWER RIGHT
Source: Bloomberg. Portrayed here is the SOFR 3-month futures curve. Yield curves are currently inverted owing to the market pricing forward rates to be lower than today’s spot rates, as this chart clearly depicts. While SOFR is now 4.55%, forward SOFR trades at much lower levels. All else equal, and for members who may need protection versus higher rates, an inverted forward curve can be a compelling time to purchase interest rate caps, as the lower forward rates can cheapen the price of a given cap strike. For more information and sample pricing on our ARC-with-Cap and Fixed-with-Cap products, kindly contact us on the desk.
FHLBNY Advance Rates Observations
Front-End Rates
- Short-end rates were mixed week-over-week. The 1-month-and–in sector moved 5 to 6 bps lower, helped by strong demand in short end markets. The 2-month-and-out zone is unchanged to 9 bps higher in steepening fashion; the market’s repricing of Fed hikes spurred this move. Please see the previous section for more specific Fed-pricing color.
- Given the Fed’s ongoing tightening and data-dependent posture, rates will be most responsive to this week’s data.
Term Rates
- The longer-term curve moved higher by ~22 to 38 bps week-over-week, led by the 2 to 5-year zone, generally mirroring moves in USTs and swaps. Kindly refer to the previous section for relevant market color. The advance curve remains inverted out to 5-year, thereby offering opportunities to extend in advance duration at lower coupon cost.
- On the UST term supply front, this upcoming week serves a 20-year nominal and a 30-year TIPS auction. Corporate bond issuance is likely to maintain its early-year heady pace. The CPI report could be an influential market-mover. Kindly call the Member Services Desk for information on market dynamics, rate levels, or products.
Product Alert: FHLBNY is pleased to announce the reintroduction, after a temporary suspension owing to Libor-cessation, of the Putable Advance, Fixed-Rate with SOFR Cap Advance, and ARC with SOFR Cap/Floor Advance. The Callable Advance continues to be offered. This expansion of the product menu will provide members with more options and flexibility for the management of funding and/or hedging needs.
Forward Start Advance (FSA): For members with upcoming borrowing or refunding plans, consider the FSA as a method to opportunistically “lock in” rates before advance settlement date. Please contact the Member Services Desk at (212) 441-6600 for more information.
The Symmetrical Prepayment Advance Feature
For those anticipating term funding needs, and with rates on an uptrend, it can be an appropriate juncture to consider our SPA feature. This feature allows the member to capture, at prepayment, changes in the fair value of the advance which are favorable to the member. Contact Member Services Desk to discuss.
Looking for more information on the above topics? We’d love to speak with you!
Questions?
If you wish to receive the MSD Weekly Market Update in .pdf format (includes FHLBNY rate charts) or to discuss this content further, please email the MSD Team.