Member Services Desk
Weekly Market Update
This MSD Weekly Market Update reflects information for the week ending May 9, 2025.
Economist Views
Click to expand the below image.

Market participants will confront a busy data calendar this week. While the focus will be on the inflation data, other reports will help provide direction for tracking estimates of Q2 real GDP growth. The median call stands at 1% annualized, after Q1’s .3% decline, with nowcasts from Fed District Banks centered at 2.3%.
NFIB Small Business Optimism Index: Echoing reported declines in a variety of confidence gauges, the sentiment barometer likely retreated to a six-month low of 95.8 in April from 97.4 in March.
Consumer Prices: Capped by stable retail energy costs, CPI probably edged .2% higher in April, erasing the surprising .1% dip witnessed in March. Excluding changes in volatile food and energy items, the so-called core CPI likely climbed by .3%, after a modest .1% prior-month rise. Those projections, if realized, would place the overall and core CPIs 2.3% and 2.8% above their prior-year readings.
Retail & Food Services Sales: Powered by yet another tariff-induced rise in auto purchases, sales probably climbed by 1% in April, building on the 1.5% jump of March. Excluding autos, sales probably edged .5% higher, almost matching March’s .6% gain. Economists will monitor so-called “control” sales, excluding auto, building materials, and gas, for clues to the pace of consumer spending during Q2. Barring any prior-month revisions, a modest .1% uptick would place core purchases in April 2.6% annualized above their January-March average, following a solid 4% annualized Q4 gain.
Empire State Manufacturing Survey: Manufacturing in NYS likely contracted for a third straight month in May, with the general business conditions diffusion index – the percentage of respondents witnessing an increase in activity less those experiencing a decline – little changed from the -8.1% reading posted in the prior month.
Jobless Claims: Labor market conditions probably were little changed during the filing period ending May 10, with initial claims for unemployment insurance benefits remaining in a historically low 220K-230K range. The total number of persons receiving regular state benefits probably registered below 1.9mn again during the week of May 3, implying that recent job-losers can find work. Keep an eye on separate federal worker figures for signs that layoffs announced by the Department of Government Efficiency have taken place.
Industrial Production & Capacity Utilization: Output likely edged .2% higher in April, reversing two-thirds of the decline in March. The overall operating rate probably moved one tick higher to 77.9%.
NAHB Housing Market Index: Due to possible impacts of tariffs on construction costs, sentiment probably eroded further in early May, leaving the confidence gauge at an 18-month low of 35.
Housing Starts & Building Permits: Buoyed by favorable weather conditions, both likely rose from the respective seasonally adjusted annual rates of 1.32mn and 1.47mn recorded in March.
New York Fed Business Leaders Survey: Mimicking the anticipated weakness in its manufacturing barometer, the gauge of services activity across NYS, northern NJ, and southwestern CT likely remained in contractionary territory for an eighth consecutive month, although it probably improved from the abysmal -19.8% reading recorded in April.
University of Michigan Sentiment Index: Marginally rosier appraisals of current and prospective economic conditions probably boosted the gauge to 53 in early April from 52.2 in March.
Federal Reserve Appearances:
May 12 Federal Reserve Board Governor Adriana Kugler to speak at the International Economic Symposium in Dublin.
May 14 SF Fed President Daly to speak at the California Bankers Association’s 2025 Annual Conference & Directors Forum.
May 15 Fed Chair Powell to give opening remarks at the Thomas Laubach Research Conference on monetary policy review.
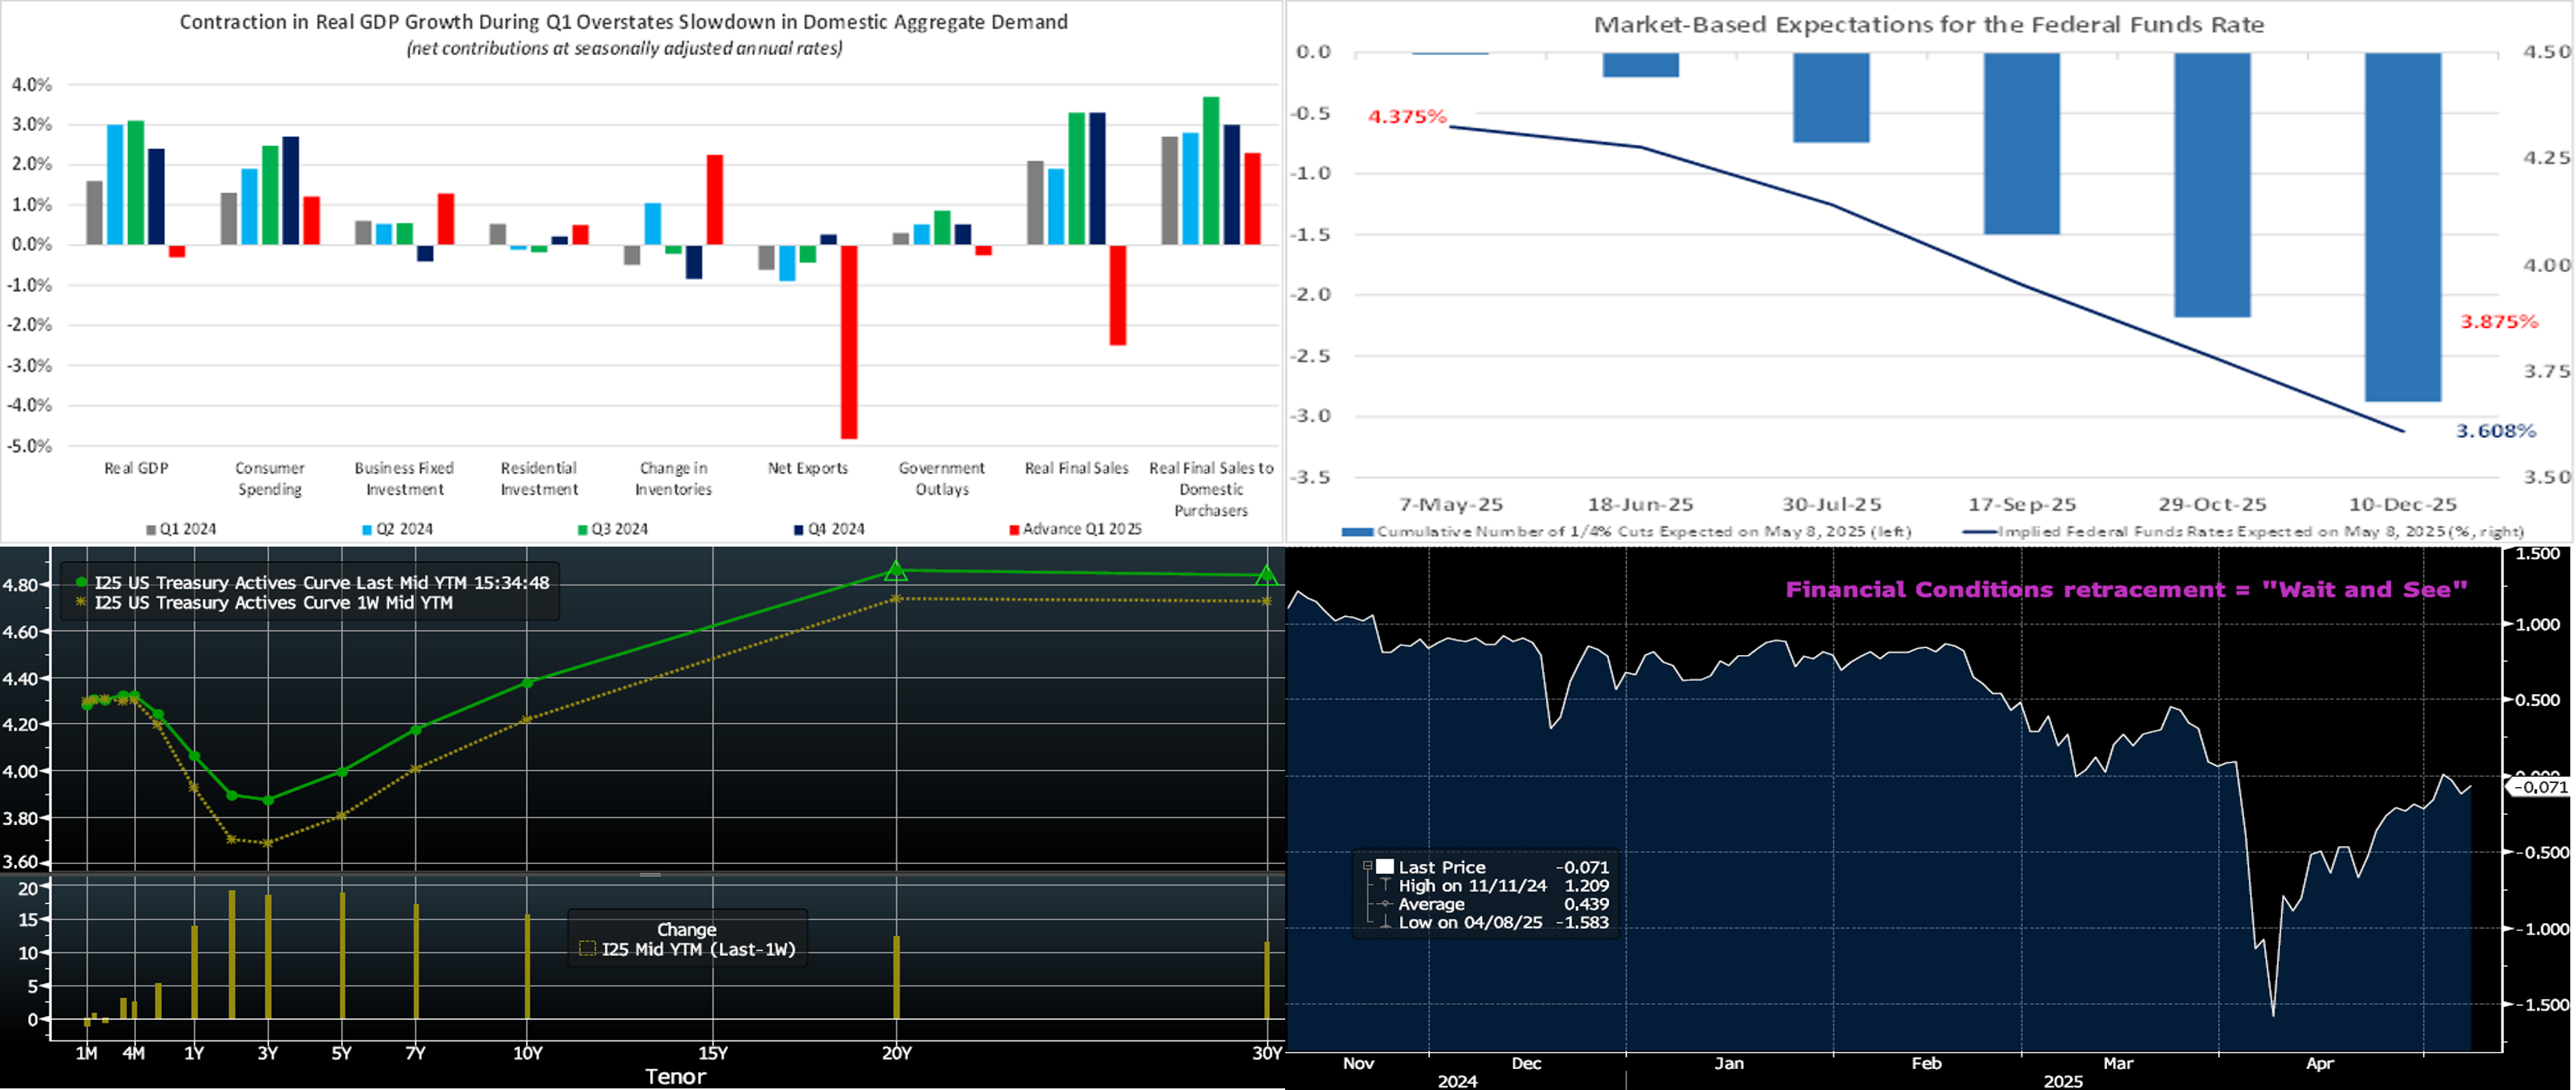
CHART 1 UPPER LEFT
Source: Bureau of Economic Analysis; FHLB-NY. Triggered by a tariff-induced surge in merchandise imports, the latest GDP report revealed that GDP contracted by 0.3% annualized over the January-March span, following an above-trend 2.4% advance during the final quarter of 2024. The reported dip marked the first contraction in this measure of aggregate economic activity in three years. While negative growth prints often put some analysts on recession watch, the true situation is far from dire. Indeed, the growth of real final sales to domestic purchasers – GDP less the change in business inventories with the signs on exports and imports reversed – advanced at an annualized clip of 2.3%, slower than Q4’s 3% gain but still well above the 1.8% most consider the long-term pace. Note that this past week’s balance of trade report for March hit a record deficit of $140.5bn, driven by a tariff- “front-running” deficit in goods of $160.5bn.
CHART 2 UPPER RIGHT
Sources: Bloomberg; Board of Governors of the Federal Reserve System; FHLB-NY. Post this past week’s FOMC meeting, and as of midday Thursday, market pricing of prospective federal funds rate cuts in 2025 remains slightly more aggressive than what policymakers expressed in the March FOMC Summary of Economic Projections (“dot plot”). In contrast to two 25-bps reductions (reflected in the median 3.875% “dot”) anticipated by Fed officials at that time, the market continues to price for approximately three cuts, thereby leaving the market’s view of the year-end target range at 3.5% to 3.75%. During the volatile tariff-driven markets of early April, the market at one stage priced close to four cuts for this year. As tariff policy dynamics have since calmed, at least for the time being, and “hard” economic data has remained resilient, the market has gradually toned down and pushed out in time its projections of rate cuts. The Fed will release a fresh dot plot at the June 18th meeting.
CHART 3 LOWER LEFT
Source: Bloomberg. Top pane is yield (LHS, %); bottom pane is change (LHS, bps). At Thursday’s close, the UST term curve was higher than a week prior, with the 2- to 5-year sector leading the move. The 2, 5, and 10-year rose by 19, 18, and 16 bps, respectively. A relatively calmer economic and tariff news backdrop this week helped to underpin a recovery in stocks and a backup in yields. Meanwhile, the Fed essentially noted that stagflation risks and uncertainty have risen and thereby solidified a “wait and see” approach. As of late Thursday, the market prices end-2025 fed funds at 3.65%, or 23 bps higher than a week ago and which equates to ~2.7 25-bps Fed cuts. The market’s end-2026 forward is ~3.20%, or 19 bps higher than a week ago.
CHART 4 LOWER RIGHT
Source: Bloomberg. Financial condition metrics have rebounded from last month’s severe tariff-induced freefall. Shown here is the Bloomberg U.S. Financial Conditions Index, which tracks the overall level of financial stress in the U.S. money, bond, and equity markets to help assess the availability and cost of credit. A positive value indicates accommodative financial conditions, while a negative value indicates tighter financial conditions. Essentially, tariff policy dynamics have calmed down, at least for now, and relative to a month ago. In turn, stocks have recovered, bond spreads have tightened back from wider levels, money market spreads are stable, and volatility measures, both realized and implied, have declined from dramatically higher levels. Given this backdrop, the Fed remaining in “wait and see” mode was unsurprising. But conditions are tighter than in March, and so events have clearly left an imprint.
FHLBNY Advance Rates Observations
Front-End Rates
- As of Thursday afternoon, short-end rates were mixed vs. a week ago. The 3-month-and-in sector declined by 2 to 10 bps, led by the shortest tenors. Overnight and 1-week, for instance, fell by 10 and 7 bps, respectively, owing greatly to a dissipation of upward pressures in short-term repo markets and SOFR from the typical balance sheet and UST auction settlement dynamics experienced near month-end. The 4- to 6-month zone was 1 to 8 bps higher, driven by market repricing of potential Fed rate cuts in 2025. Of note, our funding spreads have experienced tightening in the past week; this trend is most visible in our short-term ARC (floater) product. Robust Money Market Fund AUM levels have helped underpin demand for short-end paper, and cash should gradually return to the sector post the usual April tax-date withdrawals. Also helpful is that net T-bill supply is expected to be modestly negative in the month ahead, owing to debt ceiling dynamics.
- The market will focus on data and any trade policy developments in the upcoming week.
Term Rates
- The longer-term curve, generally mirroring moves in USTs and swaps, was 14 to 18 bps higher vs. a week ago, with the 2- to 5-year zone leading the move. Kindly refer to the previous section for color on market dynamics and changes. We encourage members to engage with the desk for current rate levels and market color.
- On the UST term supply front, the upcoming week serves a reprieve from auctions. Except for the 30-year, this past week’s auctions were digested well, thereby indicating that foreign participation levels have not fallen off a cliff. Note that UST auctions usually occur at 1pm and can occasionally spur volatility around that time. Please contact the Member Service Desk for further information on market dynamics, rate levels, or products.
Price Incentives for Advances Executed Before Noon: In effect as of Tuesday, September 5, 2023, the FHLBNY is pleased to now offer price incentives for advances executed before Noon each business day. These pricing incentives offer an opportunity to provide economic value to our members, while improving cash and liquidity management for the FHLBNY. For further details, kindly refer to the Bulletin.
Looking for more information on the above topics? We’d love to speak with you!
Archives
Questions?
If you wish to receive the MSD Weekly Market Update in .pdf format (includes FHLBNY rate charts) or to discuss this content further, please email the MSD Team.