Member Services Desk
Weekly Market Update
This MSD Weekly Market Update reflects information for the week ending July 07, 2023.
Economist Views
Click to expand the below image.
Please note that the Friday, July 7th morning jobs report may impact conditions/color herein; please call the Member Services Desk for any rate updates.
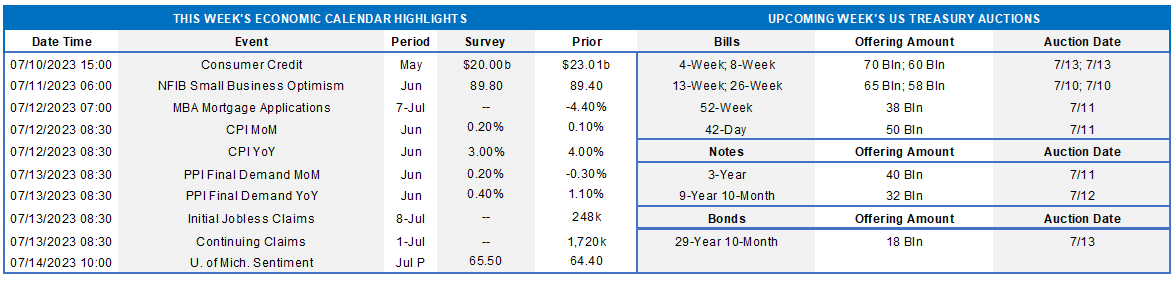
With key labor-market soundings for June in the rear-view mirror, the market’s attention will turn to the inflation side of the Fed’s dual mandate in the upcoming week. Due primarily to a modest rebound in gas prices, the headline Consumer Price Index (CPI) likely quickened slightly last month, but markedly lower quotes for used vehicles hint at a potentially benign reading on core goods and services costs. Such a report may reduce expectations for a resumption of rate hikes at the June 25-26 Federal Open Market Committee (FOMC) meeting, which currently place the probability of a 25 bps move at ~90%. Small business and consumer sentiment measures probably improved during their respective reference periods. Half a dozen Federal Reserve officials – two of whom are FOMC voters – will make public appearances to discuss a variety of timely topics. The Federal Reserve Beige Book will be issued in advance of the upcoming FOMC meeting.
Consumer Credit: Consumer installment credit is expected to have expanded by $20bn in June, almost matching the $23bn takedown recorded in the prior month. If that projection is on the mark, the annualized growth rate would recede to 4.9% from the 5.7% clip witnessed over the April-May span.
NFIB Small Business Optimism Index: Echoing reported improvements in a variety of consumer sentiment surveys, the National Federation of Independent Business’ optimism gauge likely climbed to a seven-month high of 91 in June from 89.4 in May.
Consumer Prices: Buoyed by marginally higher retail energy costs, the CPI probably climbed .2% higher in June, after a .1% uptick in the previous month. Capped by lower prices for used motor vehicles and softer apartment-rental rates, the CPI excluding volatile food and energy items likely edged .2% higher as well during the reference period – the smallest one-month rise since August 2021. Those estimates, if realized, would place the overall and core CPIs 3% and 4.9% above their respective year-ago levels – both still above Federal Reserve’s desired 2% target.
Producer Prices: The Producer Price Index for final demand is expected to have risen by .2% during the final month of the spring quarter, reversing two-thirds of May’s surprising .3% decline. If that forecast is on the mark, the year-to-year growth of the wholesale inflation measure will recede to .4% in June from 1.1% in the prior month.
Jobless Claims: Initial claims for unemployment benefits likely retreated to a seven-week low of 230K during the holiday shortened filing period ended July 8. Keep an eye on continuing claims, which have been trending lower over the latest three weeks, for any indication that furloughed employees may be having a more challenging time finding work.
University of Michigan Sentiment Index: Rosier appraisals of current and prospective conditions probably propelled this gauge to a 5-month high of 67 in early June from 64.4 the previous month.
Federal Reserve Appearances:
- July 10 Fed Vice Chair for Supervision Michael Barr to discuss bank supervision, regulation, and new capital requirements.
- July 10 San Francisco Fed President Mary Daly to discuss inflation and bank supervision at a Brookings Institution event.
- July 10 Cleveland Fed President Mester to speak on the outlook as part of UC San Diego Economics Roundtable Series.
- July 12 Minneapolis Fed President Neel Kashkari to discuss banking solvency and monetary policy at an NBER event.
- July 12 Federal Reserve to release Beige Book Summary of Commentary on Current Economic Conditions.
- July 12 Cleveland Fed President Loretta Mester to speak about FedNow at a NBER Summer Institute event.
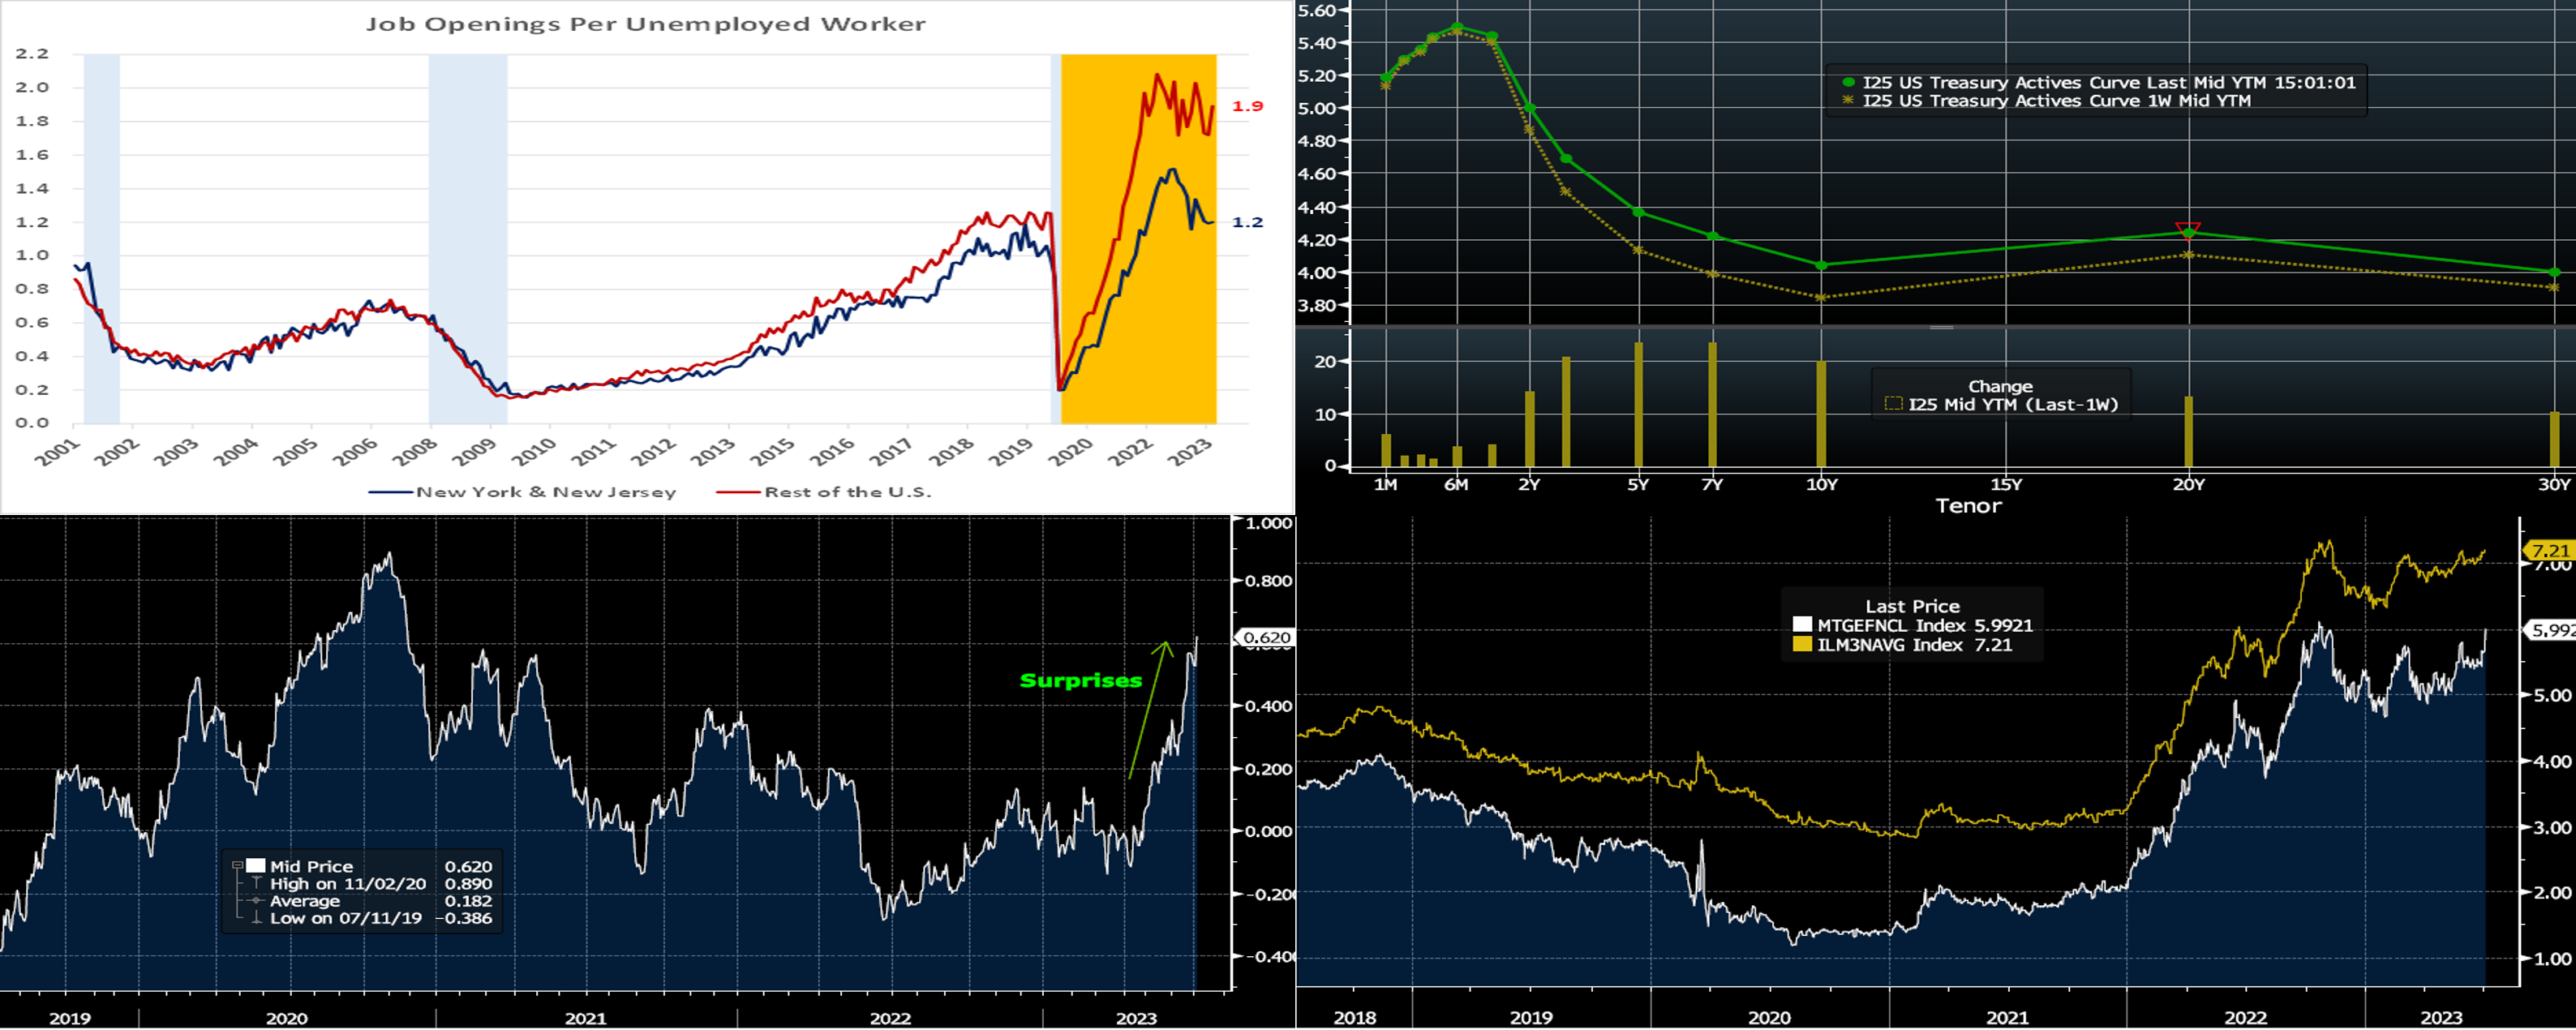
CHART 1 UPPER LEFT
Source: Bureau of Labor Statistics; National Bureau of Economic Research; FHLB-NY. Notes: Blue-shaded areas denote recessions; orange-shaded highlights current economic expansion. Amidst ongoing attempts to bring inflation back down to the desired 2% target, Federal Reserve officials have consistently described labor market conditions as too tight for comfort. Indeed, demand for workers continues to eclipse the number of unemployed persons across the country and within the FHLB-NY district. While the number of job openings nationwide in May was almost one-half million below April’s 10.3mn tally, there remained almost 1.6 positions per unemployed person. How are New York State and New Jersey faring? The latest figures available revealed that the surfeit of open positions across the two states exceeded the jobless by 112K in April. While the 1.2 jobs per unemployed person across the Empire and Garden States is well shy of the 1.9 witnessed across the remainder of the U.S., it is important to consider that the historical average for the FHLB-NY coverage area from 2001-forward is just 0.6.
CHART 2 UPPER RIGHT
Source: Bloomberg. Top pane is yield (LHS, %), bottom pane is change (bps). From last Thursday afternoon to this one, UST term yields again forged higher. The 2 to 10-year sector was up 13 to 22 bps, with the 5 to 7-year leading the move. Hawkish Fedspeak again was a contributor to upward moves. Released this past week were the Minutes from the last FOMC, and they revealed a clear desire among some members for a hike, not a pause. In this light, the FOMC outcome can more definitively be dubbed a “hawkish pause.” Meanwhile, economic data was again better than expected; see below for more insight. Consequently, the market priced a higher chance of hikes this year and backtracked further on its pricing of potential rate cuts later in 2023-2024. As of this writing, the market prices the odds of a 25 bps hike at the July 27th FOMC at ~90%. The 2023 peak funds rate stands at ~5.46% in November, while the year-end Fed Funds forward is ~5.42%, ~3 bps higher than a week ago. The market’s repricing higher of the Fed was more pronounced out of the curve in 2024-25. The 2-year yield hit its highest since 2007 this past Thursday morning; meanwhile, the 2s10s curve hit its flattest since the early 1980s. Please call the Member Services Desk for further information on market dynamics and/or products.
CHART 3 LOWER LEFT
Source: Bloomberg. Shown here is the Bloomberg Economic Surprise Index (RHS) which measures actual economic data releases relative to pre-release market consensus expectations. It has reached the highest level in nearly 2.5 years, with data points, especially in the past two months, overall coming in higher/greater than expectations. This dynamic has been a clear driver of the bear flattening of the curve over this period and surely also of the Fed’s indication that the rate hike cycle may be paused but not necessarily over. Market strategists, meanwhile, have pared back the timing/extent of any potential recession. Indeed, strategists have been calling for recession for some time now, and these forecasts have somewhat turned into “Waiting for Godot” thus far. The Friday jobs report to be released the morning after this writing could be a clear market-mover if it keeps this trend intact or definitively breaks it.
CHART 4 LOWER RIGHT
Source: Bloomberg. The persistent trend higher in market yields over the past month has served to push mortgage-related rates to the highest levels since last Fall. Shown here is the Agency MBS 30-year Current Coupon (RHS, white, %, computed yield of a par-priced bond) and the Bankrate.com 30-year National Average Mortgage rate (RHS, gold, %). For those looking to add securities, this trend may provide a better opportunity. But the impact of higher rates on mortgage origination/refinancings and housing markets appears poised to continue for the time being.
FHLBNY Advance Rates Observations
Front-End Rates
- Short-end rates were mostly higher from a week ago, with 2-month-and-in tenors up 3 to 5 bps on average and longer ones ~1bp higher. Relatively hawkish Fedspeak and the market pricing higher odds of hikes helped push rates a bit higher, albeit was more pronounced in tenors past 2023. Net T-bill supply remains robust as Treasury rebuilds its account post-debt ceiling agreement; however, it has been absorbed well thus far, as Money Market Funds (MMFs) switch from the Fed’s RRP to T-bills with competitive yields. Moreover, FHLB supply has subsided from peak levels of spring, further assisting T-bill interest from investors. These dynamics are conspiring to ease any upward pressure on rates from the T-bill supply resurgence.
- Economic data and Fedspeak should be the prime driver of rates this upcoming week.
Term Rates
- The longer-term curve moved higher by 10 to 24 bps, generally mirroring moves in USTs and swaps. The 3 to 7-year zone led the move, all higher by 22 to 24 bps. Kindly refer to the previous section for relevant market color. The advance curve remains inverted out to 5-year, thereby offering opportunities to extend in advance duration at lower coupon cost.
- On the UST term supply front, the upcoming week serves 3/10/30-year auctions. Please contact the Member Services Desk for further information on market dynamics, rate levels, or products.
New Product Alert: FHLBNY is pleased to announce the new 0% Development Advance (ZDA) Program providing members with subsidized funding in the form of interest rate credits to assist in originating loans or purchasing loans/investments that meet one of the eligibility criteria under the Business Development Advance, Climate Development Advance, Infrastructure Development Advance, or Tribal Development Advance. This program is intended to support economic development by incentivizing members to provide below-market-rate loans or invest in qualified initiatives. Please contact the Member Services Desk to learn more and/or visit the ZDA Overview page.
Forward Start Advance (FSA): For members with upcoming borrowing or refunding plans, consider the FSA as a method to opportunistically “lock in” rates before advance settlement date. Please contact the Member Services Desk at (212) 441-6600 for more information.
The Symmetrical Prepayment Advance Feature
For those anticipating term funding needs, and with rates on an uptrend, it can be an appropriate juncture to consider our SPA feature. This feature allows the member to capture, at prepayment, changes in the fair value of the advance which are favorable to the member. Contact Member Services Desk to discuss.
Looking for more information on the above topics? We’d love to speak with you!
Questions?
If you wish to receive the MSD Weekly Market Update in .pdf format (includes FHLBNY rate charts) or to discuss this content further, please email the MSD Team.