Member Services Desk
Weekly Market Update
This MSD Weekly Market Update reflects information for the week ending April 19, 2024.
Economist Views
Click to expand the below image.
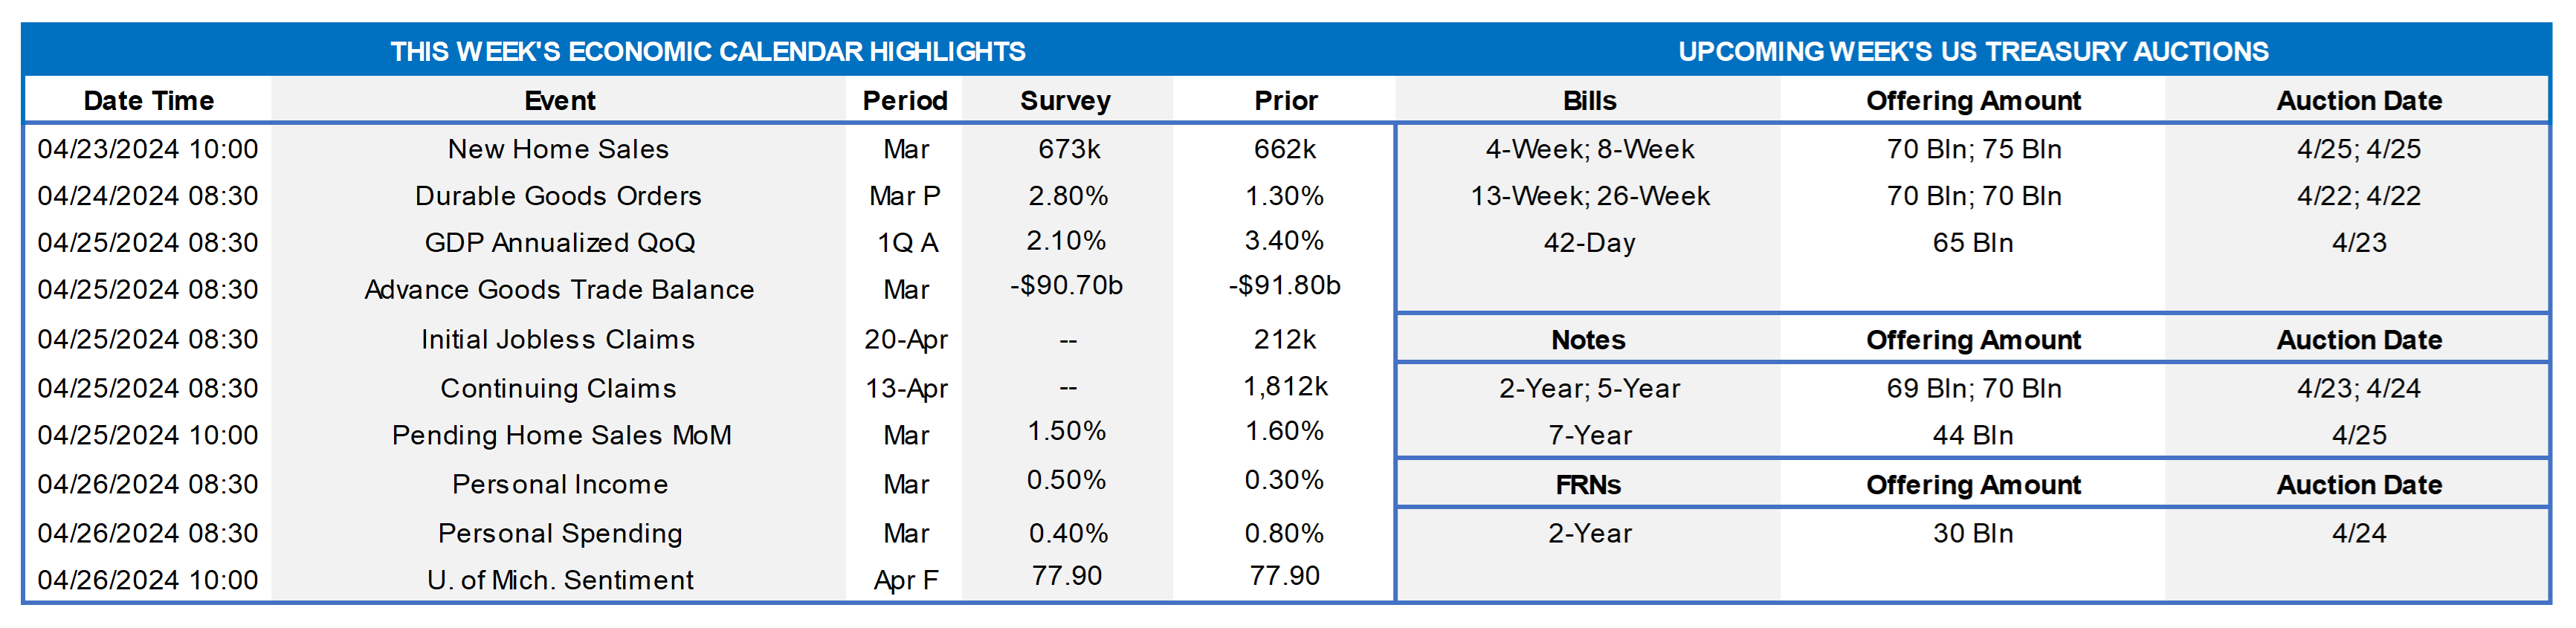
With policymakers observing the traditional blackout period on public appearances ahead of the April 30-May 1 Federal Open Market Committee (FOMC) meeting, market participants will focus on the economic data calendar this week. The Bureau of Economic Analysis’ advance report on Q1 real GDP growth will undoubtedly be the marquee release. Inflation-adjusted business activity is expected to have slowed to a 2% annualized pace during Q1, but as is usually the case with the first look, the range of forecasts is wide. While that projection would be a sharp deceleration from the 3.4% clip witnessed during the Fall, it would also mark a seventh consecutive quarter of trend-or-better growth amidst the most aggressive tightening of monetary policy in decades.
New Home Sales: Reported sharp declines in single-family building permits and housing starts suggests that contract signings on newly constructed dwellings declined by 3.3% to a four-month low seasonally adjusted annual rate of 640K in March.
Durable Goods Orders: Powered by a sharp pickup in commercial aircraft requisitions, durable goods bookings likely jumped by 3.7% in March, after a 1.3% increase in February. As always, pay attention to nondefense capital goods shipments excluding aircraft deliveries for clues to the strength of business equipment spending during the first quarter.
Merchandise Trade Balance: The merchandise trade deficit probably widened to $91.5bn in March from the $90.3bn shortfall posted in February.
Jobless Claims: Initial claims for unemployment insurance benefits likely remained in the recent 210-225K range during the filing period ended April 20. Continuing claims – the total number of persons receiving regular state benefits – probably continued to hover near the 1.8mn mark during the week of April 6 – a sign that the newly unemployed are having few difficulties finding work.
Pending Home Sales: Pending home sales likely ended the winter quarter on a high note, rising by 1% in March after a 1.6% gain in the prior month.
Personal Income & Spending: Buoyed by an anticipated pickup in wage and salary disbursements, personal income is expected to have climbed by .5% last month, eclipsing February’s .3% gain. By contrast, the pace of consumer spending probably slowed during the reference period, rising by .4% after a .8% prior-month jump. While hikes in core consumer prices continued apace at .3% in March, the year-to-year growth in the Federal Reserve’s preferred inflation metric edged one tick lower to 2.7%.
Michigan Sentiment Index: Consumers’ appraisals of current and prospective economic conditions likely improved in the latter part of April, lifting the University of Michigan’s sentiment gauge from this month’s preliminary 77.9 reading.
Federal Reserve Appearances: None – Federal Reserve officials will observe the blackout period ahead of the April 30-May 1 FOMC meeting.
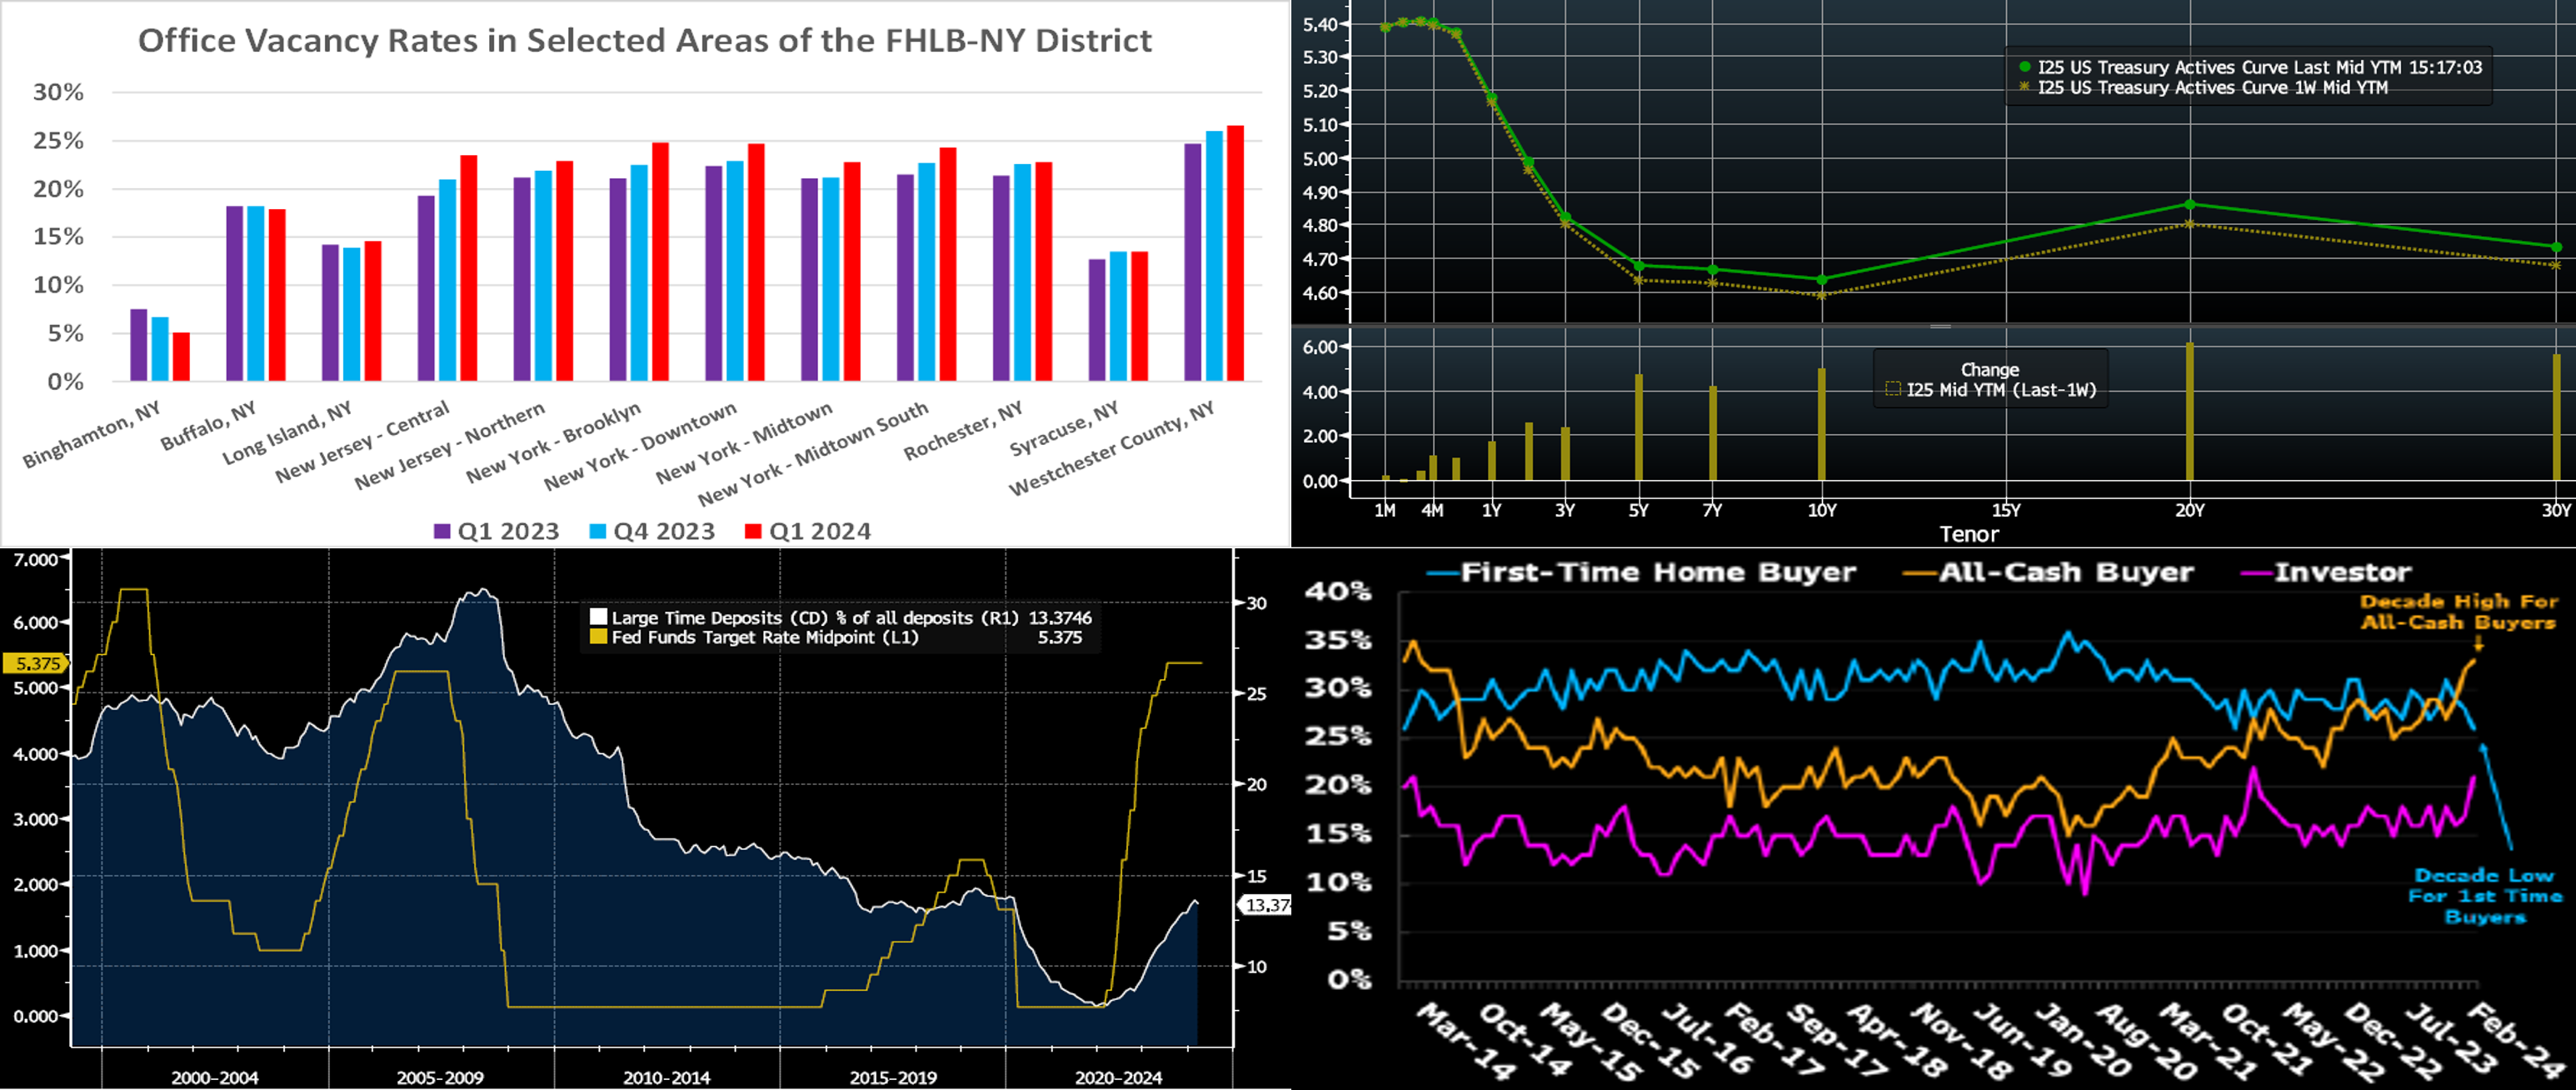
CHART 1 UPPER LEFT
Source: Cushman & Wakefield; FHLB-NY. Office vacancy rates continued to climb across selected areas of the FHLB-NY district during the first quarter. Indeed, the portion of office properties that were vacant and available climbed to an average of 20.3% across the dozen segments canvassed by Cushman & Wakefield, up from 19.4% at the end of 2024 and 18.8% at the end of the previous winter. Vacancy rates continued to vary widely across the FHLB-NY coverage during the past quarter, extending from an estimated low of just 5.1% in Binghamton, NY to a high of 26.6% in Westchester County, NY. The average vacancy rate in Manhattan registered at 23.9% at the end of Q1, up from 21.7% a year earlier and more than double the 10.5% witnessed before the COVID-19 pandemic struck.
CHART 2 UPPER RIGHT
Source: Bloomberg. Top pane is yield (LHS, %), bottom pane is change (LHS, bps). From last Thursday afternoon to this one, the UST curve pushed modestly higher and steeper. Whereas the 2-year rose ~3 bps, the 5-year rose ~5 bps. The tone of Fedspeak, including comments from Chair Powell in the past week, has decidedly and consistently shifted to “in no rush to cut rates, need to see more data, and can keep rates steady as events evolve.” Stronger-than-expected economic data has underpinned this shift. In terms of market-implied pricing of the Fed, a full 100% probability of a 25 bps is now in the Fall, with the June 13th FOMC priced at only ~13% chance, down from ~23% last week. The August 1st FOMC is priced at ~43% chance of the first 25 bps cut. The year-end 2024 forward is ~4.95%, or ~5 bps higher than last week, implying a cumulative total of ~38 bps of cuts by the end of this year.
CHART 3 LOWER LEFT
Source: Bloomberg; Federal Reserve H.8. The theme of net interest margin and net interest income pressures, partly owing to higher deposit costs, has generally persisted in freshly released earnings reports from banks. Shown here are large time deposits, such as CD’s, as a percentage (RHS, %) of all deposits for the commercial banking sector versus the Fed Funds target rate mid-point (LHS, %). The percentage has increased in the past year and a half, an outcome generally typical for Fed-hiking cycles. Given the fast pace of the most recent hiking cycle and keen competition from other investment products such as Money Market Funds (MMFs), many banks have increased usage of customer specials and/or brokered channels. However, while the time deposit percentage has certainly risen and currently stands ~13.4%, it is well below levels experienced in past years. In this light, and if the Fed remains on hold for an extended period, the percentage could increase further. As always, we remind members to compare any borrowing options with the “All-in” (incorporating the dividend) borrowing rate of our Advances. For a copy of our “All-in Pricing Tool”, please contact the Member Services Desk.
CHART 4 LOWER RIGHT
Source: Bloomberg Intelligence; National Association of Realtors. As seen here, first-time homebuyers now comprise a decade low as a percentage of overall buyers. Limited starter homes for sale and low affordability, owing to higher prices and mortgage rates, have been a factor. Meanwhile, cash-buyers, a large share of whom are investors, represent a decade high as a percentage of total purchases. In some respects, first-timers (and others) are being squeezed out by cash-buyers. Meanwhile, the need for supply is widely cited by housing affordability experts as vital to address affordability challenges. In these areas, we encourage members to become familiar with and participate in the FHLBNY’s Affordable Housing and Homebuyer Dream Programs; for further information, please visit https://www.fhlbny.com/community/housing-programs/. Note that the 2024 AHP General Fund Round opens this Monday, April 22, with a total of $70.8mn in available grant funds.
FHLBNY Advance Rates Observations
Front-End Rates
- Short-end rates moved little week-over-week, with most tenors unchanged or a bp or two changed in either direction. The April tax date passed with minimal impact on short-end markets. Net T-bill supply, after a long spell in positive territory and in timing with the upcoming Tax Day when Treasury receives cash inflows, has turned negative in recent weeks. This dynamic, all else equal, can help tighten spreads on FHLB paper. But the April tax date spurred ~$130bn of withdrawals from Money Market Funds (MMFs) in the week ending April 16th, thereby decreasing a demand source for short-end paper. Nonetheless, the impact on rates was basically non-existent.
- Given the Fed blackout, market focus will steer towards the slate of economic data releases.
Term Rates
- The longer-term curve, week-on-week and generally mirroring moves in USTs and swaps, moved 4 to 7 bps higher and steeper. Please refer to the previous section for color.
- On the UST term supply front, the upcoming week serves 2/5/7-year auctions, with record sizes on the 2 and 5-year. Note that UST auctions usually occur at 1pm and can occasionally spur volatility around that time. Please contact the Member Services Desk for further information on market dynamics, rate levels, or products.
The FHLBNY is pleased to announce the 2024 0% Development Advance (ZDA) Program, now available with a new streamlined submission process. This program provides members with subsidized funding in the form of interest rate credits to assist in originating loans or purchasing loans/investments that meet the eligibility criteria under the Business Development Advance (BDA), Climate Development Advance (CDA), Infrastructure Development Advance (IDA), or Tribal Development Advance (TDA). Please contact the Member Service Desk for information and/or visit our ZDA information page.
Price Incentives for Advances Executed Before Noon: In effect as of Tuesday, September 5, 2023, the FHLBNY is pleased to now offer price incentives for advances executed before Noon each business day. These pricing incentives offer an opportunity to provide economic value to our members, while improving cash and liquidity management for the FHLBNY. For further details, kindly refer to the Bulletin.
The Symmetrical Prepayment Advance Feature
For those anticipating term funding needs, and with rates on an uptrend, it can be an appropriate juncture to consider our SPA feature. This feature allows the member to capture, at prepayment, changes in the fair value of the advance which are favorable to the member. Contact Member Services Desk to discuss.
Looking for more information on the above topics? We’d love to speak with you!
Questions?
If you wish to receive the MSD Weekly Market Update in .pdf format (includes FHLBNY rate charts) or to discuss this content further, please email the MSD Team.