Member Services Desk
Weekly Market Update
This MSD Weekly Market Update reflects information for the week ending August 11, 2023.
Economist Views
Click to expand the below image.
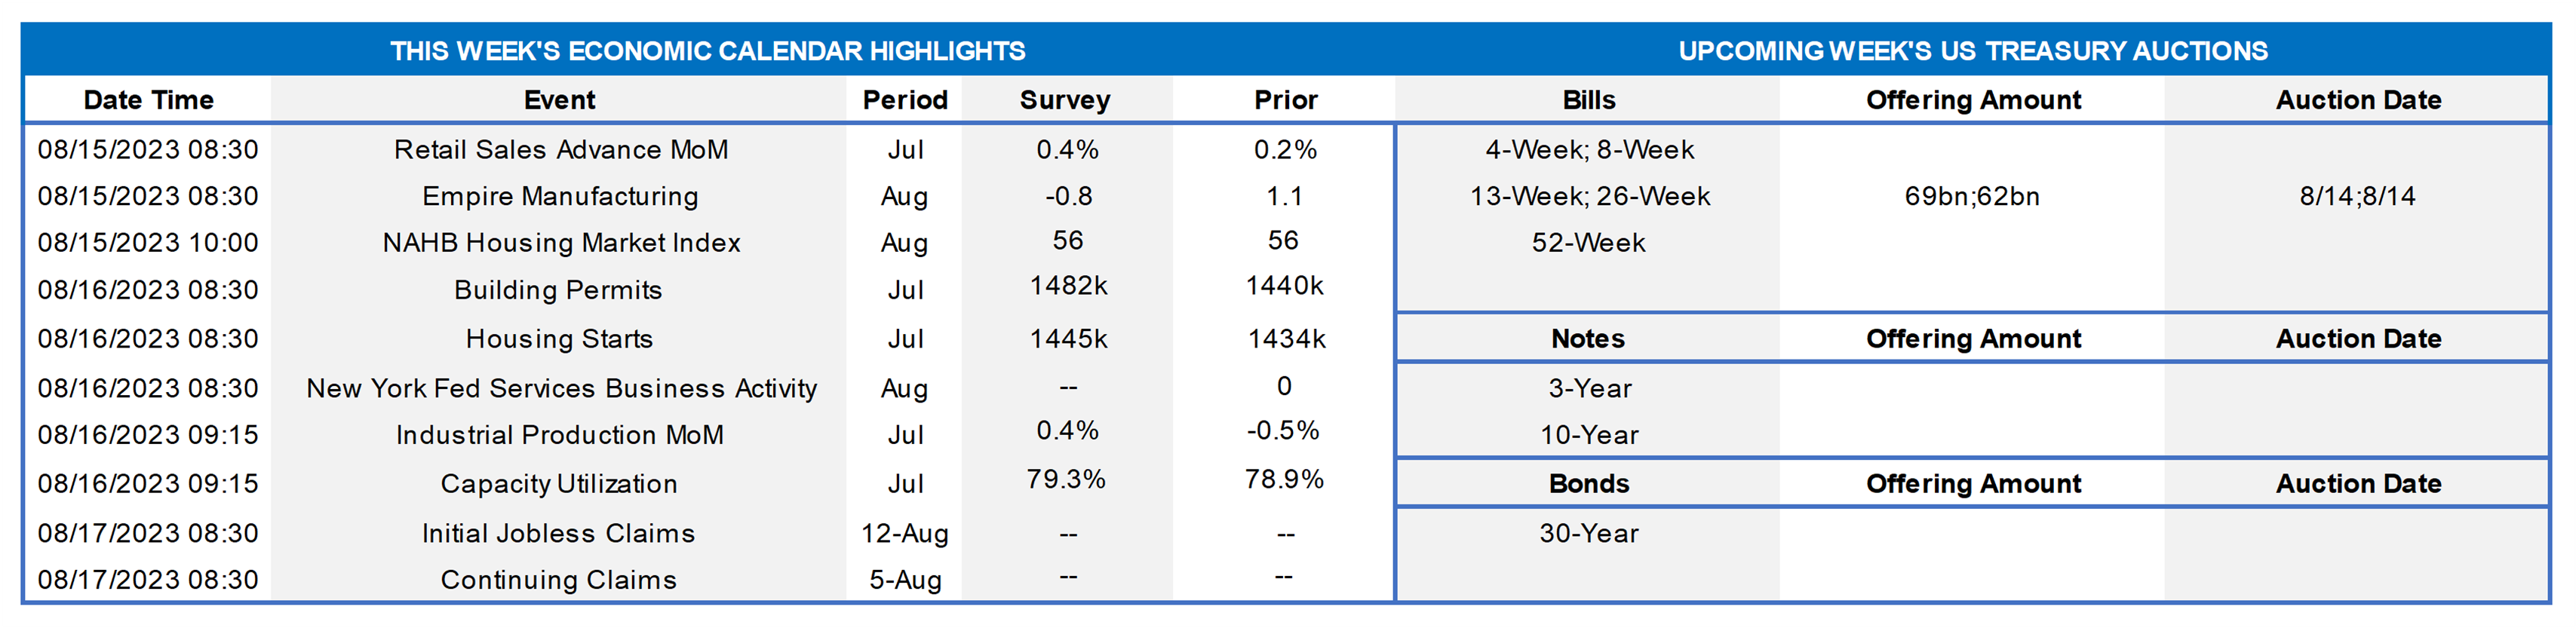
Market participants will contend with a crowded calendar of data this upcoming week, many of which could influence economists’ forecasts for current quarter real GDP growth. The current median projection calls for an annualized gain of .7%, ending the string of above-trend gains witnessed since last summer. With little input data available, however, the range of estimates is wide. Of note, the FRB of Atlanta’s GDPNow model, which accurately called the Bureau of Economic Analysis’ advance estimates for both Q1 and Q2, currently projects a hefty 4.1% annualized gain in inflation-adjusted activity over the July-September quarter. Minutes from the July-25-26 FOMC meeting may shed some light on policymakers’ thinking about the necessity of further rate hikes.
Retail & Food Services Sales: Sales probably quickened at the beginning of the summer quarter, rising by .4% in July after a .2% uptick in June. Excluding an anticipated uptick in motor vehicle purchases, retail purchases are expected to have climbed by .4% as well during the reference period, also double the prior month’s gain. As always, the market will pay attention to so-called “control” sales, excluding auto, building materials and gasoline purchases for clues to the pace of consumer spending during Q3. Barring any prior-month revisions, the .4% rise projected by the Street would place core purchases 3.5% annualized above their April-June average, following a comparatively modest 1.7% annualized spring-quarter gain.
Empire State Manufacturing Survey: Manufacturing activity in New York State probably expanded modestly for a third straight month in August, with the general business activity diffusion index improving upon the 1.1% reading recorded in July.
NAHB Housing Market Index: Home-builder sentiment likely improved in early August, lifting the index by two points to 58 – the rosiest reading since the 67 witnessed in June 2022.
Housing Starts & Building Permits: Buoyed by favorable weather conditions, these figures probably rebounded in July, reversing portions of their respective 3.7% and 8% June declines.
New York FRB Business Leaders Survey: Service-producing activity across New York State, northern NJ and southwestern CT probably expanded for the first time in 11 months in August.
Industrial Production & Capacity Utilization: Powered by an anticipated jump in electricity generation, industrial production likely climbed by .5% in July, erasing the reported June decline. With output expected to eclipse additions to productive capacity during the reference period, the overall operating rate probably climbed to 79.3% from 78.9% in the preceding month.
Jobless Claims: Initial claims for unemployment benefits likely retreated from the prior period’s 248K tally during the filing period ended August 12. Keep an eye on continuing claims, which have clocked in below the 1.7mn mark for three weeks running, for any sign that furloughed employees may be having a more challenging time finding work.
Index of Leading Economic Indicators: To be released 8/17, the Conference Board’s augur of prospective economic activity is expected to dip by .4% in July, continuing a string of uninterrupted declines going back to April 2022. Despite its ongoing weakness, the Federal Reserve Bank of St. Louis placed the probability that the economy was contracting in June at a negligible 1.5%.
Federal Reserve Appearances:
- Aug. 15 Minneapolis Fed President Kashkari to participate in a discussion at the API’s annual global controllers conference.
- Aug. 16 Minutes of July 25-26 Federal Open Market Committee meeting are released.
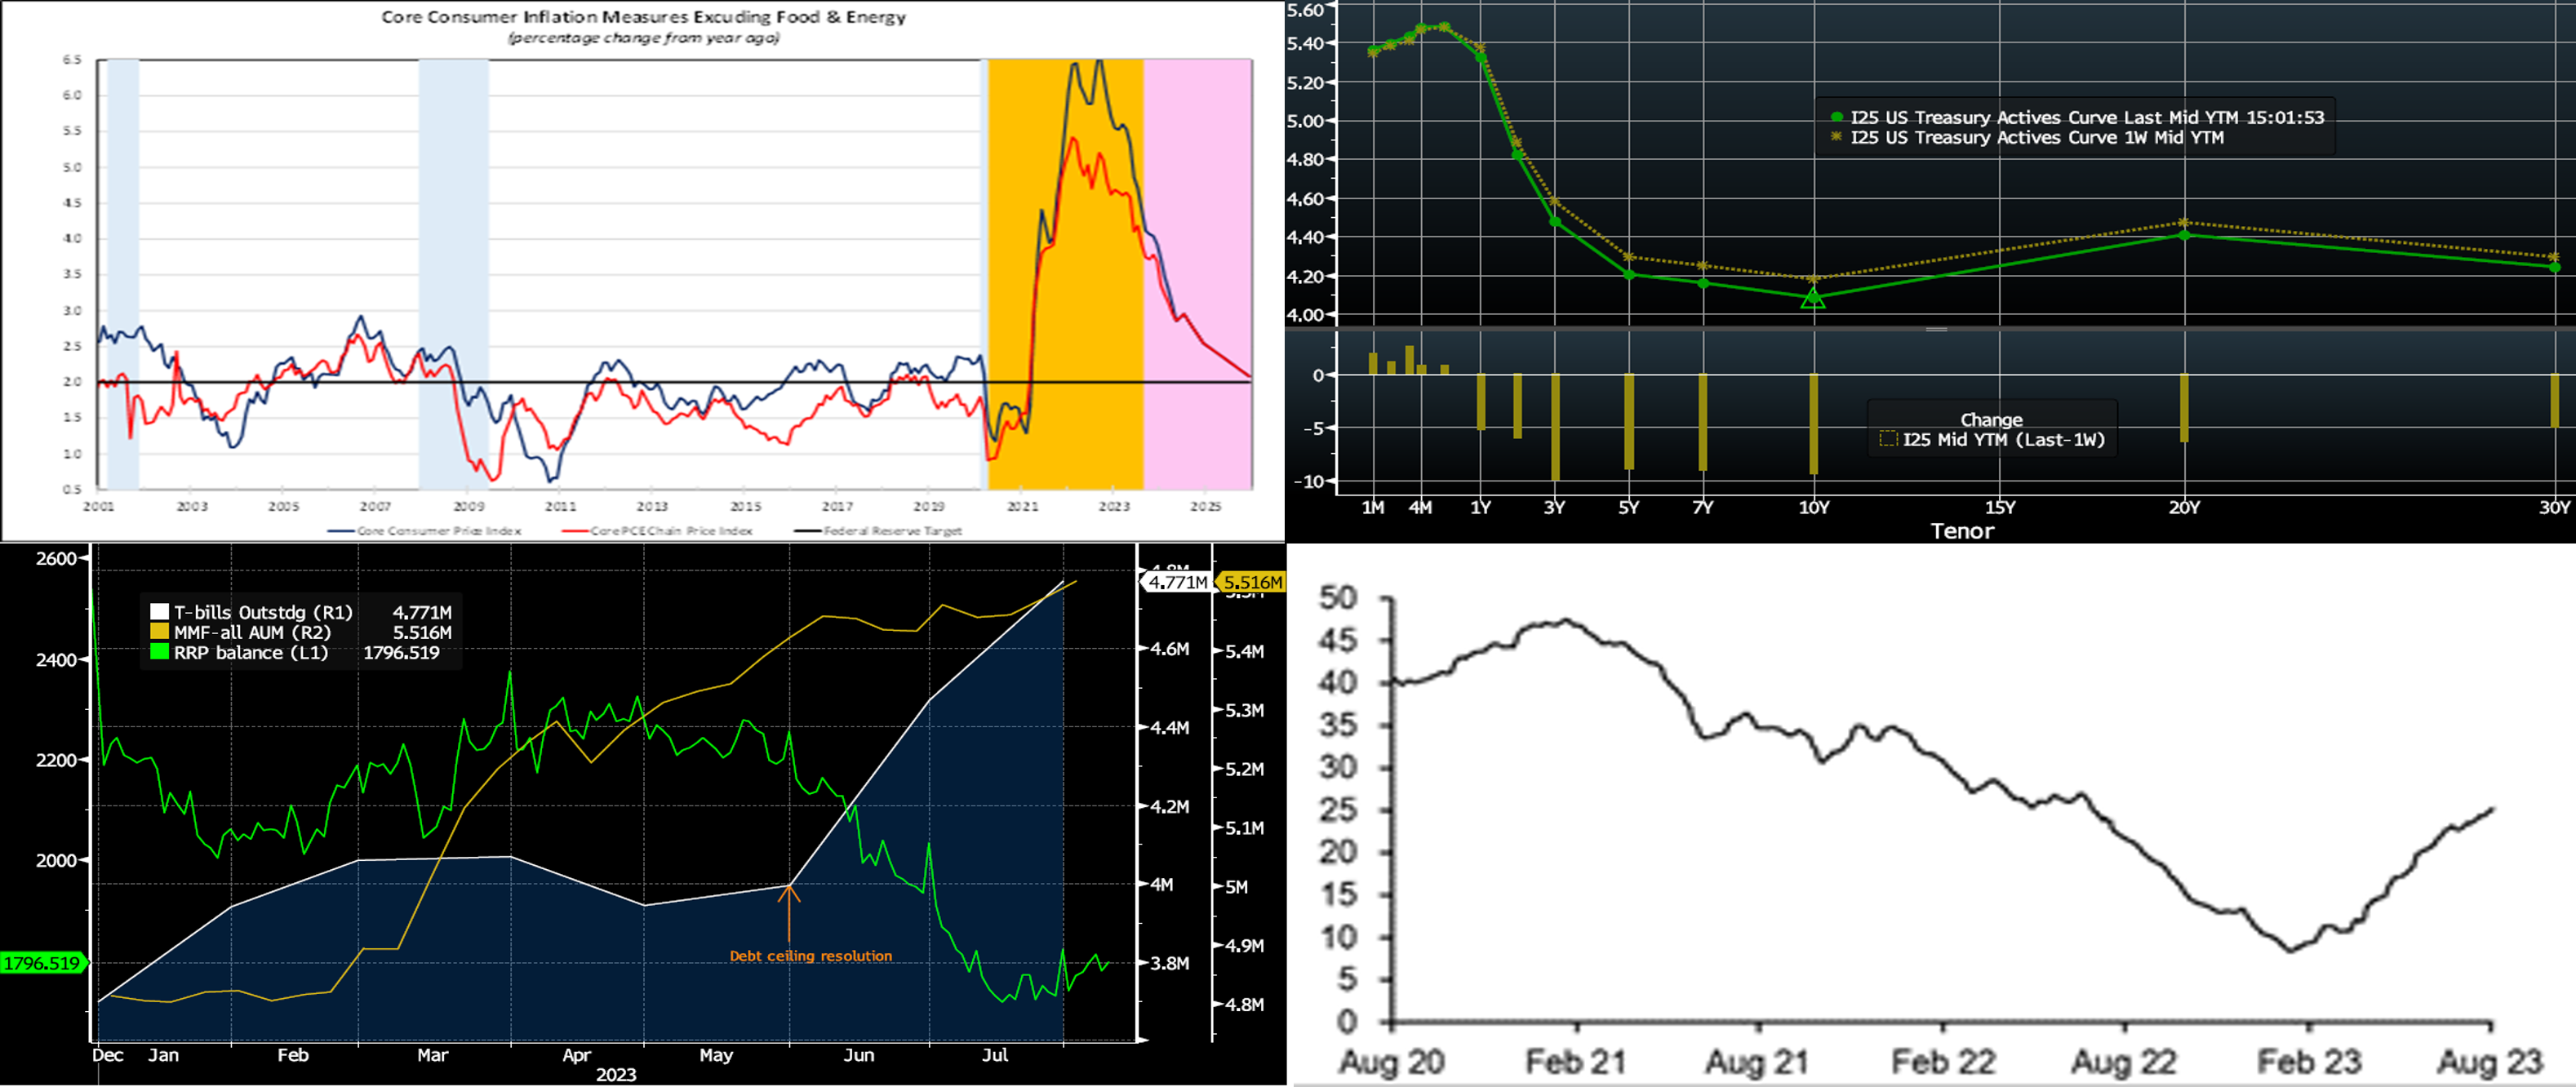
CHART 1 UPPER LEFT
Source: BLS; NBER; FHLB-NY. Notes: Blue-shaded areas denote recessions; orange-shaded areas highlight current economic expansion. Core inflation continues to move in the FOMC’s desired direction. Excluding volatile food and energy components, the year-to-year growth of the CPI edged one tick lower to 4.7% in July – a significant improvement from the 6.6% peak set last September. The inherent stickiness of shelter costs, which account for 34.7% of the overall CPI and 43.5% of the core subindex, continues to mask the success that Fed officials have made in reining in prices. Indeed, since February 2022, the year-to-year growth in the CPI, excluding energy, food and shelter costs has slowed from 7.6% to 2.5% last month – one-half percentage point above monetary policymakers’ target.
CHART 2 UPPER RIGHT
Source: Bloomberg. Top pane is yield (LHS, %), bottom pane is change (LHS, bps). From last Thursday afternoon to this one, the curve traded mildly lower led by the belly, with 3 to 10-year yields lower by ~8 bps. Given the large UST auctions of 3/10/30-year over the week, the dip in yields was somewhat surprising and perhaps driven by short-covering from “fast-money“ trading types and an as-expected benign CPI release. Moreover, the market pushed a bit lower its pricing of future Fed moves. In terms of market-implied pricing of the Fed, the 2023 peak Fed Funds rate in November now stands at ~5.41%, down from 5.43% last week. Essentially, the market is pricing a ~33% chance of one more 25 bp hike this year. The year-end forward is at ~5.38%, or ~2 bps lower than last week. The years 2024 and 2025 moved lower from a week ago, with the year-end 2024 forward ~11 bps lower, at 4.04%, from a week ago. Please call the Member Services Desk for further information on market dynamics and/or products.
CHART 3 LOWER LEFT
Source: Bloomberg. Here we revisit Money Market Funds (MMFs) and related dynamics in the short-end markets. Shown here are the year-to-date trends of MMF AUM (gold, RHS-2, $trn), the Fed’s Reverse Repurchase Program (RRP) facility (Green, LHS, $bn), and the dollar amount of T-bills outstanding (white, RHS-1, $trn). Without getting buried in precise figures, we can note a few discernible trends. MMFs continue to grow and represent a competitive threat to bank deposits. Indeed, while recent bank earnings reports generally appeared to reflect more stability in deposits, the mix of deposits also appeared to skew more toward higher-cost products and rate offerings. On the positive side, MMF AUM growth has served to help absorb the large increase in T-bill supply of recent months, which, in turn, helps contain the relative degree of upward pressure on short-end market yields and FHLB advance rates. Meanwhile, given that MMFs are major investors in the RRP, the chart also illuminates the migration of MMFs out of the RRP and into other vehicles such as T-bills and/or FHLB paper.
CHART 4 LOWER RIGHT
Source: Crane Data; JP Morgan. Shown here is the 5-day moving average (LHS, days), weighted by assets, of the weighted average maturity (WAM) of government MMFs. While still far from the 3-year high (47 days in Dec 2020), WAM has gradually lengthened this year, thereby further indicating movement out of very short vehicles such as the RRP and into longer tenors. This dynamic has helped markets absorb increased T-bill issuance. Moreover, the fact that the current WAM is still ~20 days below the 2020 peak could bode well for MMFs continuing to absorb increased T-bill supply. Further assisting T-bill demand from MMFs could be a now, compared to back in the spring, clearer Fed policy path as well as lower levels of FHLB supply.
FHLBNY Advance Rates Observations
Front-End Rates
- Short-end rates were steady to a bit lower week-over-week, with the 2-month-and-in unchanged to a bp lower and the 3-month-and-out 2 to 4 bps lower. The market’s pricing of any further Fed hikes edged lower, thereby helping the small yield decline. Net T-bill supply remains robust and is expected to experience further upticks, given the recent announcements from Treasury regarding upsized auctions and issuance needs. But the supply has been absorbed well thus far as Money Market Funds (MMFs) switch from the Fed’s RRP to T-bills with competitive yields. Moreover, FHLB supply has subsided from peak levels of spring, further assisting T-bill interest from investors and thereby containing any severe upward pressure on rates from T-bill supply.
- Economic data, as well as the FOMC Minutes release, should drive direction this upcoming week.
Term Rates
- The longer-term curve, generally mirroring the moves in USTs and swaps, moved lower week-on-week, led by the 11 to 12 bps decline in the 3 to 10-year sector. The advance curve remains inverted out to 5-year, thereby offering opportunities to extend in advance duration at lower coupon cost. Kindly refer to the previous section for relevant market color.
- On the UST term supply front, the upcoming week serves as a reprieve from auctions. Please contact the Member Services Desk for further information on market dynamics, rate levels, or products.
ZDA Reminder: FHLBNY recently launched the new 0% Development Advance (ZDA) Program providing members with subsidized funding in the form of interest rate credits to assist in originating loans or purchasing loans/investments that meet one of the eligibility criteria under the Business Development Advance, Climate Development Advance, Infrastructure Development Advance, or Tribal Development Advance. This program is intended to support economic development by incentivizing members to provide below-market-rate loans or invest in qualified initiatives. Reservation requests for the program have exceeded the currently available program amount; new requests will be added to the waitlist and filled if previously reserved funds become available. Please contact the Member Services Desk to learn more and/or visit the ZDA Overview page.
Forward Start Advance (FSA): For members with upcoming borrowing or refunding plans, consider the FSA as a method to opportunistically “lock in” rates before advance settlement date. Please contact the Member Services Desk at (212) 441-6600 for more information.
The Symmetrical Prepayment Advance Feature
For those anticipating term funding needs, and with rates on an uptrend, it can be an appropriate juncture to consider our SPA feature. This feature allows the member to capture, at prepayment, changes in the fair value of the advance which are favorable to the member. Contact Member Services Desk to discuss.
Looking for more information on the above topics? We’d love to speak with you!
Questions?
If you wish to receive the MSD Weekly Market Update in .pdf format (includes FHLBNY rate charts) or to discuss this content further, please email the MSD Team.