Member Services Desk
Weekly Market Update
This MSD Weekly Market Update reflects information for the week of September 20, 2021.
Economist Views
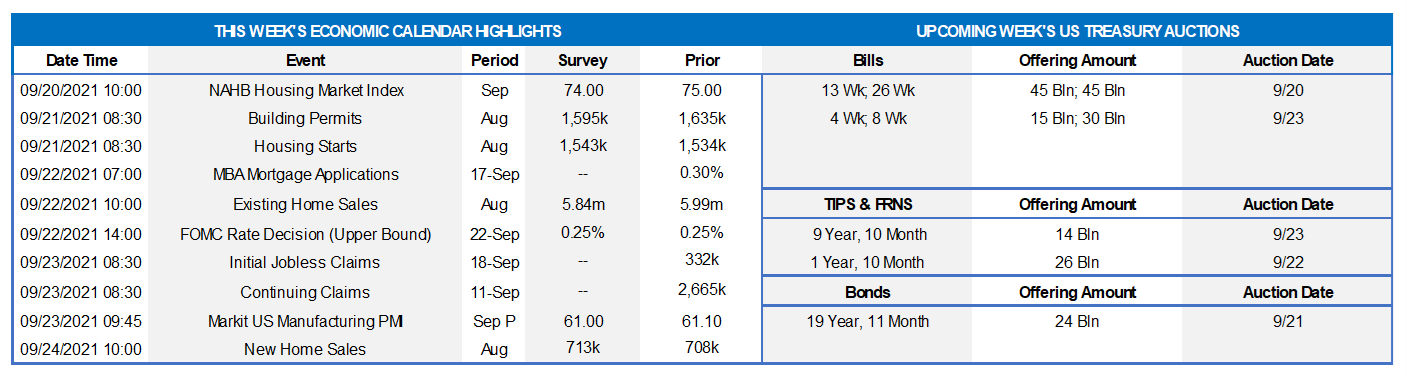
Click to expand the below image.
The Federal Open Market Committee (FOMC) is expected universally to leave the federal funds rate target range unaltered at 0 to .25% at this week’s meeting. Policymakers likely will acknowledge that economic activity has slowed somewhat in response to the Delta variant outbreak and reiterate that the sectors most adversely affected by the pandemic have shown improvement but have yet to recover fully. The post-meeting statement probably will note that overall financial conditions remain accommodative. In the communiqué released following the July 27-28 gathering, the FOMC raised the issue of the central bank’s asset-purchase program. Last December, the FOMC indicated that it would continue to increase its holdings of USTs by at least $80bn per month and of Agency MBS by at least $40bn per month until substantial further progress had been made toward its maximum employment and price stability goals. While the economy has indeed made strides toward these twin goals, recent soundings suggest that the pandemic is again adversely impacting economic activity. As a result, it is unlikely that policymakers will announce a tapering of asset purchases at this time and repeat that they will continue to assess progress at future meetings.
NAHB Housing Market Index: Home-builders’ appraisals of market conditions probably were marginally less rosy in early September. Expected to move one point lower to 74, the index would remain well above the critical 50-point mark.
Housing Starts & Building Permits: The number of new housing starts likely climbed by 1% to a seasonally adjusted annual rate of 1.55mn in August, reversing a fraction of the 7% drop recorded in July. By contrast, the number of new building permits issued probably took a breather during the reference period, retreating to an annual rate of 1.6mn from 1.635mn in the preceding month.
Existing Home Sales: The reported dip in purchase-contract signings over the June-July span suggests that existing homes sales declined by 1.8% to a seasonally adjusted annual rate of 5.88mn in August yet remained level with the average posted over the prior three months. With available dwellings on the market likely dipping by 100K to 1.31mn during the reference period, the stock of unsold homes likely moved one tick higher to 2.7 months’ supply.
Jobless Claims: Initial and continuing claims under regular state unemployment insurance programs likely moved lower during their latest respective reporting periods. Those figures continue to overstate the improvement in the labor market from the worst of the pandemic, however. As of the week ended August 28, 12.1mn persons were still receiving some sort of unemployment assistance, down from the pandemic peak of 32.4mn reached a year ago but still well above the 2.1mn prevailing before the shuttering of the economy. Using August’s level as a base, 7.5% of the civilian labor force were receiving some form of unemployment insurance payments three weeks ago.
Markit U.S. Manufacturing PMI: Available Federal Reserve district bank surveys suggest that the Markit manufacturing activity gauge climbed to 61.5 in September from 61.1 in August.
New Home Sales: Contracts to purchase a newly constructed dwelling are expected to be little changed from the 708K seasonally adjusted annual rate recorded in July.
Federal Reserve:
- Sept. 22 FOMC post-meeting statement to be released along with an updated Summary of Economic Projections or SEP.
- Sept. 22 Federal Reserve Chair Jerome Powell to hold press conference after FOMC meeting.
- Sept. 24 Cleveland Fed President Mester to discuss the economic outlook at an event hosted by the Ohio Bankers League.
- Sept. 24 Fed Chair Powell, Vice Chair Clarida and Governor Bowman to speak at a Fed Listens Event with representatives from various industries and labor groups.
- Sept. 24 Kansas City Fed President George to discuss the economy and monetary policy at an event hosted by the AEI.
Click to expand the below images.
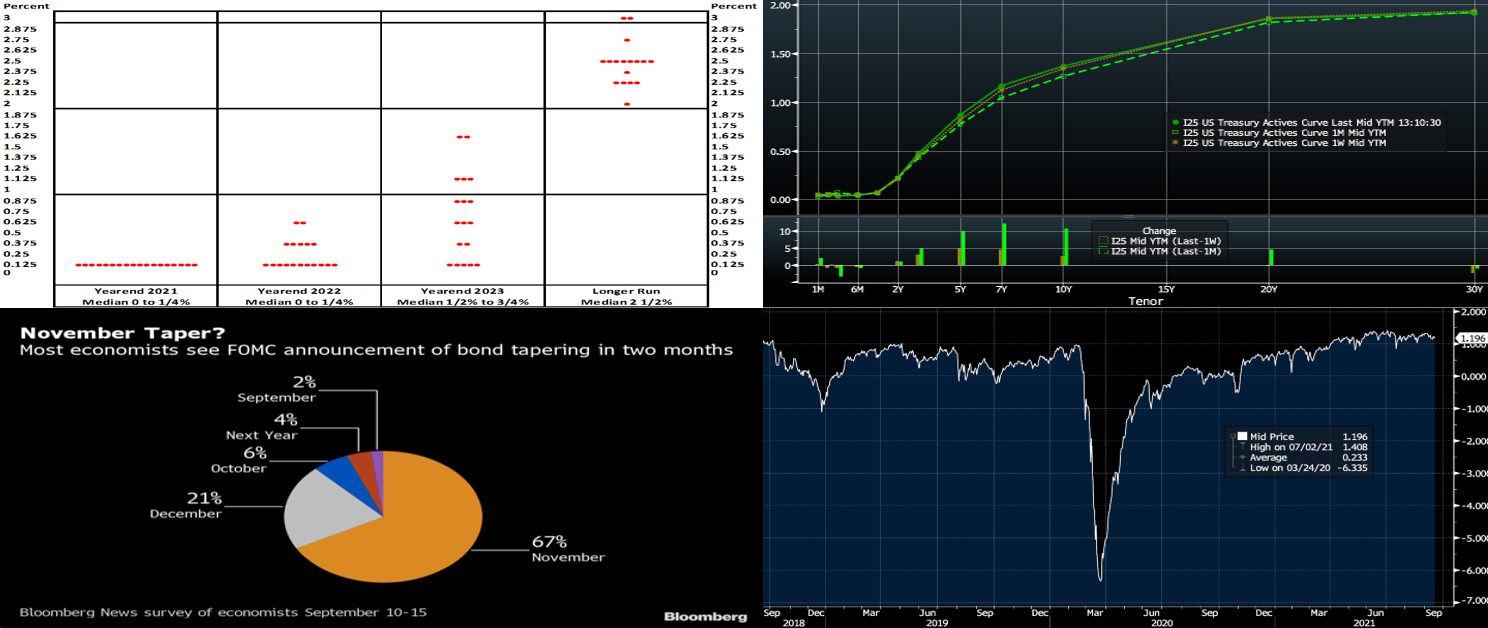
CHART 1 UPPER LEFT
Source: Board of Governors Federal Reserve System; FHLB-NY. As per convention, the Federal Reserve will release an updated Summary of Economic Projections (SEP) following this week’s FOMC meeting. Of note, the upcoming edition will include policymakers’ initial expectations for 2024. The so-called “dot plot” will be watched very closely for any changes to policymakers’ federal funds rate projections over the year-end 2022-2023 horizon. The June SEP brought the first expected increase in administered rates into 2023, and only two Fed officials would have to become marginally more hawkish (i.e., if two additional dots in the 2022 column increase from .125%) at the upcoming gathering to push the initial rate hike forecast sooner into next year. The nominal federal funds rate anticipated over the longer run likely will remain at 2.5%.
CHART 2 UPPER RIGHT
Source: Bloomberg. Note: Top pane is yield (%), bottom pane is change (bps). Week-over-week as of midday Friday, UST yields closed 1 to 5 bps higher from 2 to 10-year, led by the belly (5 to 7-year) sector. Yields in the very long-end were unchanged to 1-2 bps lower. The bulk of the rate moves occurred late in the week and in reaction to Thursday’s stronger-than-expected retail sales report. Overall, the curve remains in a sort of stalemate between the potentially looming onset of the Fed’s taper later this year and the negative impacts of the Delta variant. In recognition of the latter, many economists have adjusted their GDP forecasts downwards, but recently announced federal measures to increase vaccination rates may stem further pandemic impacts and so bear monitoring. As expected, September continues to experience a surge of fixed income supply, but demand remains solid. This week’s key event is the FOMC meeting.
CHART 3 LOWER LEFT
Source: Bloomberg. The Fed will probably hint at its meeting this week that it is moving toward scaling back monthly asset purchases and make a formal announcement in November, according to a recent Bloomberg survey of economists. Two-thirds of those surveyed expect the announcement at the Fed’s Nov. 2-3 meeting, with more than half seeing the actual tapering starting in December. This result is earlier than in the July survey, likely a result of various Fed officials in the past month expressing support for a taper in the near-term horizon. It should be noted that tapering is likely to be a gradual “wind-down” process of the Fed’s current monthly purchases of $80bn USTs and $40bn MBS; also, the taper is well-anticipated by the markets at this stage. In this regard, news on this topic may not impact rates much unless dramatically different from these survey expectations.
CHART 4 LOWER RIGHT
Source: Bloomberg. Depicted here is the Bloomberg U.S. Financial Conditions index which tracks the overall level of financial stress in the U.S. money, bond, and equity markets to help assess the availability and cost of credit. A positive value indicates accommodative financial conditions, while a negative value indicates tighter conditions relative to pre-2008 financial crisis norms. As the pandemic ensued in early 2020, the index dropped precipitously, but relief programs and the Fed’s response (lower rates, various asset purchase plans) then dramatically reversed its course. Indeed, the index now resides at a level above that prevailing pre-pandemic. If these conditions persist, and especially if the Delta variant subsides, the Fed is likelier to taper sooner rather than later.
FHLBNY Advance Rates Observations
Front-End Rates
Short-end Advance rates finished unchanged on the week. Money Market Funds’ AUM decreased by a sizable ~$39bn this past week, likely owing to redemptions for the Sept. 15th corporate tax date. Nonetheless, demand for short paper and the Fed’s RRP, which stands ~$1.2trn, remains strong. The overall supply/demand paradigm persists in suppressing rate levels, as the GSEs continue to invest large sums into money markets, the TGA continues its decline, Fed purchases instill funds to the banking system, and short-maturity paper is in low supply.
UST issuance overall is now net positive supply in that more is being issued than what the Fed is buying in its programs. However, with short UST rates at rock-bottom levels and the Fed on hold, rates are likely to persist in a near-term sideways pattern. Importantly, weekly net T-bill issuance has been lower since 2020 and negative for months, and Treasury intends to shift issuance out the curve. Moreover, the looming federal debt ceiling may further constrain issuance. Further legislative packages and related borrowing may lead to an eventual increase of T-bill auction sizes and positive net supply, but for now overall market supply/demand dynamics should keep short rates in check from large moves to the upside.
Term Rates
The Advance rate curve was modestly changed from a week prior. The 1 to 10-year sector was unchanged to ~5 bps higher, led by the belly of the curve. For instance, while 1-year was unchanged, 5-year was 5 bps higher and 10-year 1bp higher. Kindly refer to the previous section for further color on relevant market dynamics.
On the UST supply front, this week brings a 2 and 10-year TIPS and a 20-year nominal auction. The market will monitor economic data and pandemic developments but pay special focus on the FOMC meeting. Heavy corporate issuance will continue to add supply to the market but likely be easily absorbed
Product Enhancement Alert: FHLBNY this past week announced an enhancement to the Callable Adjustable Rate Credit Advance (“Callable ARC”). The product features a 1-time call/cancel option (member’s option) to extinguish funding early at no cost via two distinct option structures, thereby giving members flexibility in meeting the demands of a fluctuating balance sheet. Given the shorter-term nature of the current borrowing environment, the minimum term for the Callable ARC has been lowered to 4-month (from the previous 7-month) for our 1-month-left-to-maturity call option (SOFR or 1-month Libor index available) to better meet our members’ needs. Meanwhile, the 3-year Non-Call 2-year product for SOFR continues to be offered to members for their longer-term needs.
New Product Alert: In order to satisfy member needs and provide greater product flexibility to match bond and derivative market conventions, FHLB-NY now offers SOFR-linked advances based on SOFR-index compounding. Note that this product is in addition to SOFR-linked advances based on SOFR-index averaging which have been offered since November 2018.
The Symmetrical Prepayment Advance Feature
With rates at or near multi-year lows, it is a compelling juncture to use the SPA feature on term advances. This feature allows member to capture, at prepayment, changes in the Fair Value of the advance which are favorable to the member. Contact us to discuss.
Looking for more information on the above topics? We’d love to speak with you!
Questions?
If you wish to receive the MSD Weekly Market Update in .pdf format (includes FHLBNY rate charts) or to discuss this content further, please email the MSD Team.
Special Member Alert
The FHLBNY recently announced a newly expanded and flexible Disaster Relief Funding (DRF) advance program which offers discounted rate advances with maturities 1-mo and greater. Additionally, we have announced that PPP loans will be accepted as eligible collateral. Please contact us with any questions.