Member Services Desk
Weekly Market Update
This MSD Weekly Market Update reflects information for the week ending January 13, 2023.
Economist Views
Click to expand the below image.
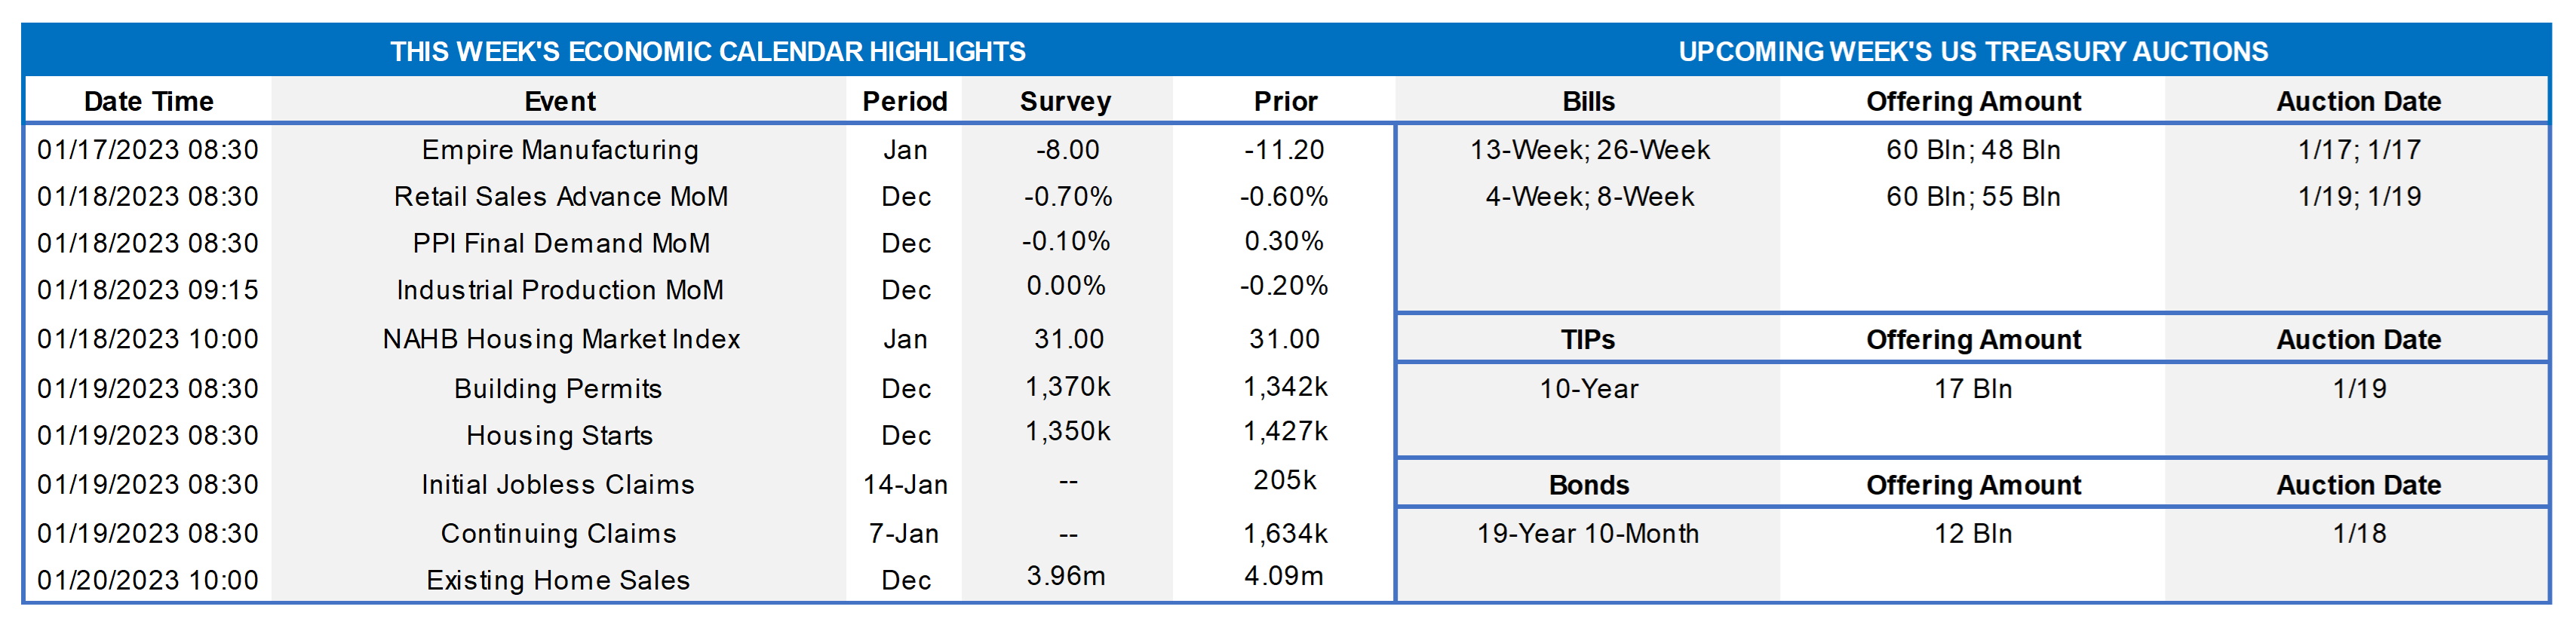
With the BLS update on December consumer prices in the past, market focus will return to real economic activity data at year-end. Anticipated declines in retail sales, industrial production and housing starts may prompt economists to pare their estimates for real GDP growth in Q4. The current median forecast calls for a 1.2% annualized gain, but the range of projections is very wide. Indeed, the tracking estimate produced by the Atlanta Fed is for a well-above trend 4.1% annualized gain. Also on deck is the Fed’s Beige Book report on regional economic conditions.
Empire State Manufacturing Survey: Manufacturing activity in New York State is expected to have ebbed for the fifth time in the last six months in January but at a slower clip than in December. The general business conditions diffusion index probably clocked in at -7.5%, following an –11.2% reading in the preceding month.
Retail & Food Services Sales: Led by yet another falloff in auto-dealer revenues, retail sales and food services sales likely retreated by .8% in December, after a .6% prior-month decline. Excluding the anticipated drop in motor vehicle sales, retail purchases are expected to have contracted by .4% in the final month of the year, following a .2% dip in November. Market participants will pay particular attention to so-called “control” sales excluding auto, building materials and gasoline purchases. Barring any prior-month revisions, the .3% decline anticipated by the Street would place core purchases over the October-December span 2.9% annualized above their July-September average, after a 7.4% annualized summer-quarter gain.
Producer Prices: The PPI for final demand probably remained steady in December, following a trio of .3% increases over the September-November span. If that projection is on the mark, the headline PPI climbed by 6.9% during 2022 after a 10% jump in 2021.
Industrial Production & Capacity Utilization: Production at the Nation’s factories, mines and utilities likely held steady in December, following a .2% decline in November. With additions to productive capacity expected to grow during the reference period, the overall operating rate probably moved one tick lower to 79.6%.
NAHB Housing Market Index: Buoyed by recent lower rates, the gauge likely moved two points higher to 33 in January, putting an end to the huge 53-point plunge over the course of 2022.
Housing Starts & Building Permits: Residential building activity is expected to have been mixed in December. The number of building permits issued likely climbed by 1.4% to a seasonally adjusted annual rate of 1.37mn, while new starts slumped by 5.4% to 1.35mn – the fewest groundbreakings since the 1.27mn posted in June 2020.
Jobless Claims: Initial claims for jobless benefits likely returned to the 210-225K range during the period ended January 13, after the holiday capped filings posted in the prior two weeks. Continuing claims probably moved back above the 1.7mn mark during the week ended January 6, implying that recently furloughed employees may be having a slightly more difficult time finding work.
Existing Home Sales: Home-purchase signings over the October-November span suggest that closings slipped by 3.4% to a 22-year low SAAR of 3.95mn in December. Constrained by higher rates and limited supplies of available dwellings, this data point tumbled by an estimated 16.9% in 2022 to 5.09mn – the lowest tally since the 4.92mn homes purchased in 2014. Reflecting well-worn seasonal patterns, the number of homes on the market likely plunged by 21.1% to a 10-month low of 900K, paring the months’ supply of available dwellings to 2.7 from the 3.3 posted in November.
Federal Reserve Appearances:
- Jan. 18 Federal Reserve to release Beige Book Summary of Economic Conditions.
- Jan. 19 Boston Fed President Susan Collins to speak at a conference on housing hosted by her bank.
- Jan. 19 New York Fed President Williams to speak at an event hosted by the Fixed Income Analyst Society in New York.
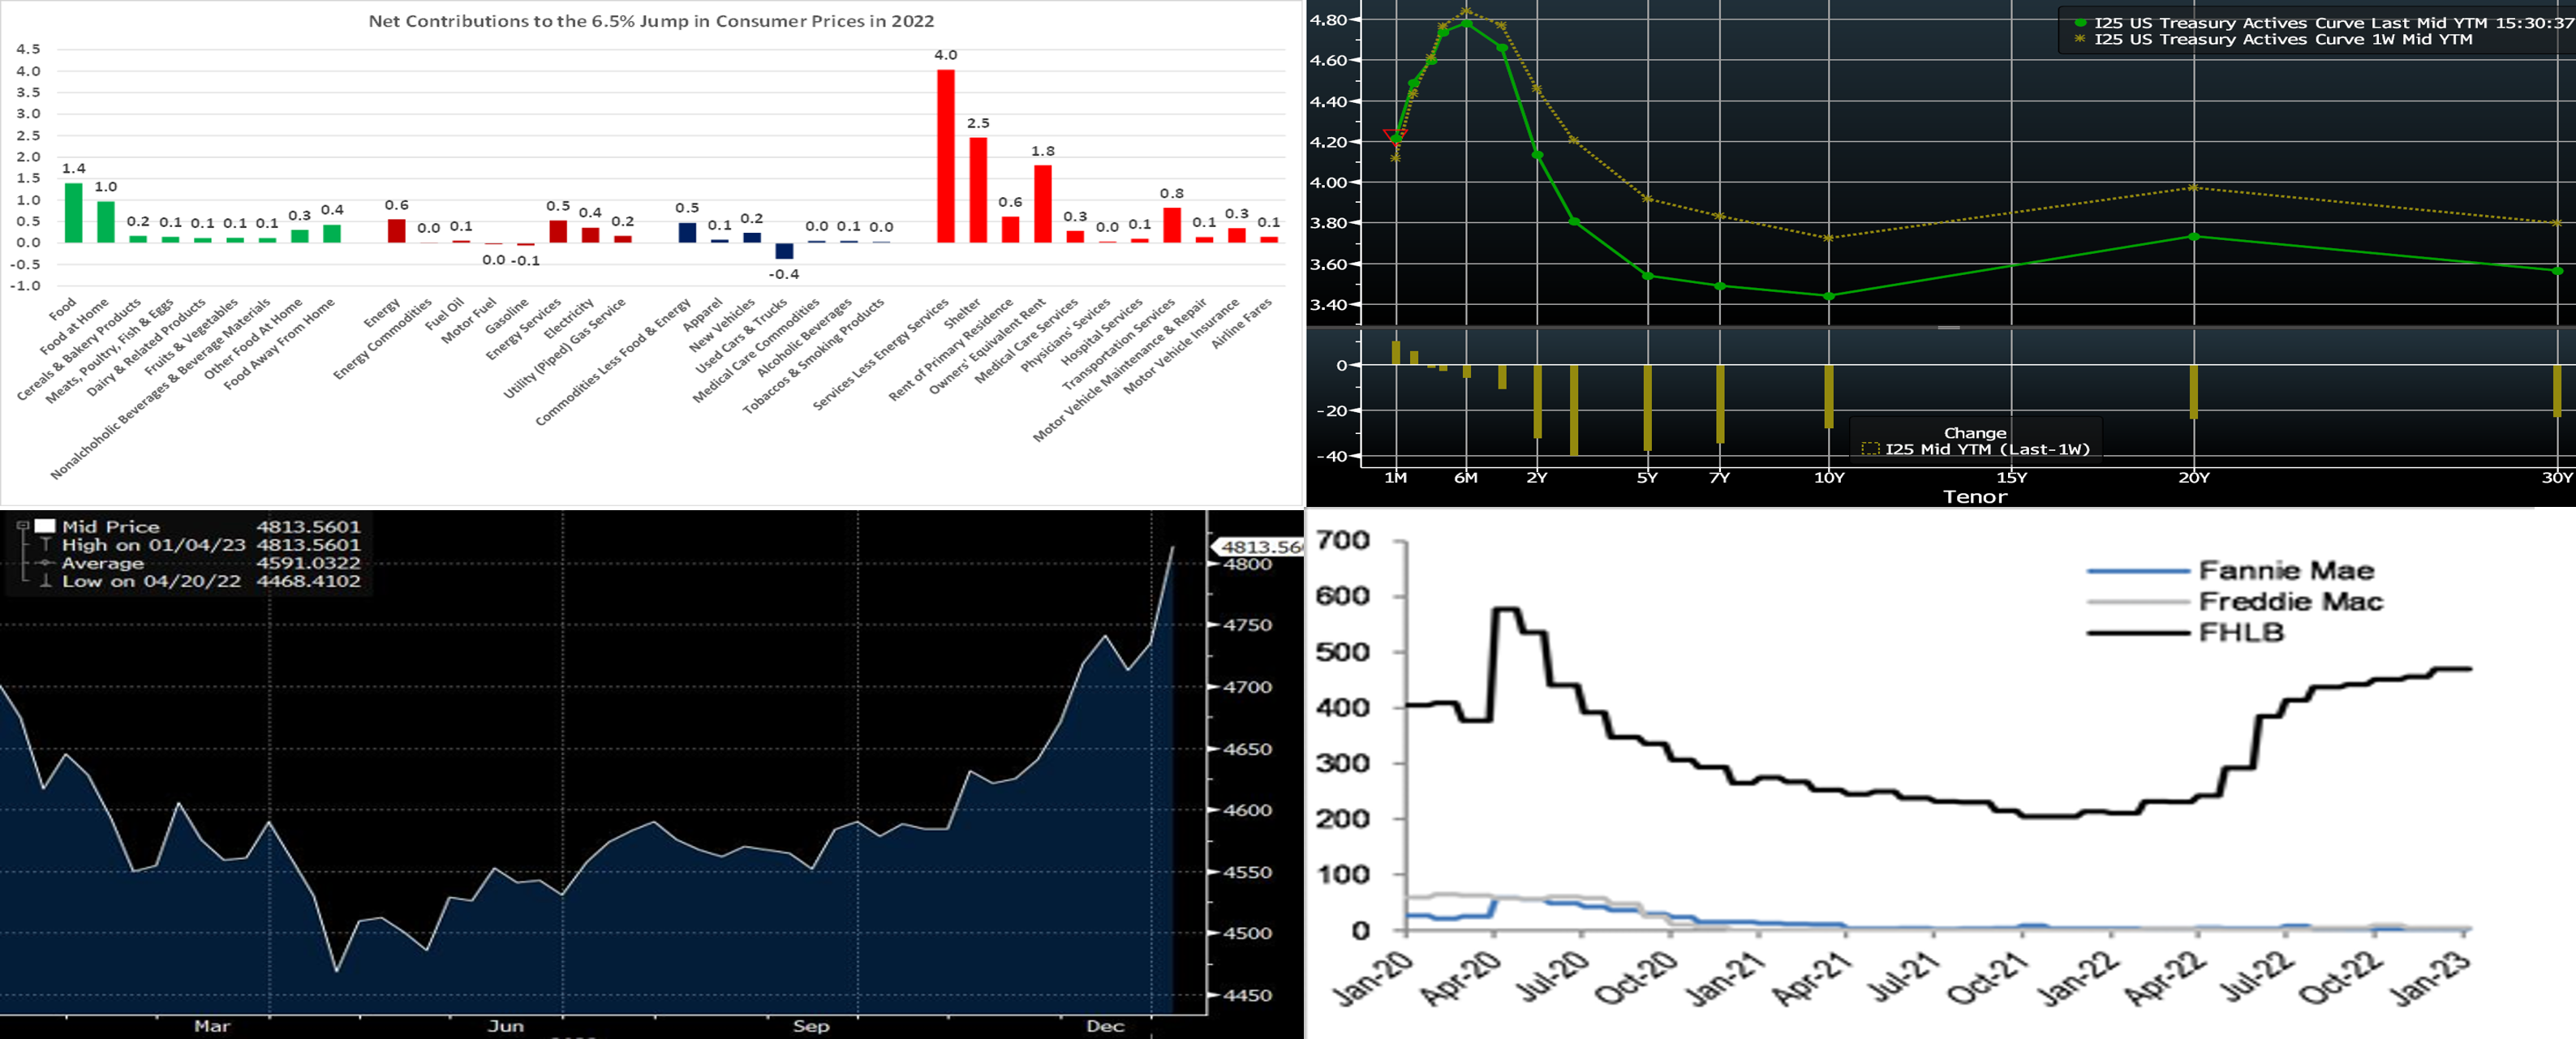
CHART 1 UPPER LEFT
Source: Bureau of Labor Statistics; FHLB-NY. Consumer prices climbed by 6.5% in 2022, slower than the 7% increase witnessed over the course of calendar 2021, but still well above the Federal Reserve’s desired 2% target. The composition of last year’s inflation gain hints that a significant further slowdown could be in the offing in coming months. Almost 40% of the rise in the Consumer Price Index last year was attributable to higher shelter costs. With both apartment rental rates and home prices moving lower in recent months, it is merely a matter of time before those reductions appear in the BLS inflation reports.
CHART 2 UPPER RIGHT
Source: Bloomberg. Top pane is yield (LHS, %), bottom pane is change (bps). UST yields moved dramatically lower the past week, with the 3-year leading the way with a ~37 bps decline. While a few FOMC members this week advocated for a slower pace, i.e. 25 bps, of hikes at forthcoming meetings, overall Fed-speak continues to emphasize the “higher for longer” theme. Yet the market persists in underpricing that theme, as evidenced in its pricing for the peak (~4.91%) in Fed Funds effective to be in summer 2023 and then descending ~50bps into the close of the year. For the end of 2024, market pricing reflects a rate of ~2.82%! The market apparently signals that it believes inflation is on the downtrend and/or a growth slowdown or mild recession could loom this year. Indeed, Thursday’s CPI figures generally reflected that inflationary forces are ebbing. Moreover, TIPS ”breakevens”, a barometer of expected inflation via market pricing of inflation bonds, currently trade ~2% in the 2 and 3-year sectors. These dynamics helped drive the move lower in term yields this week. For the upcoming February 1 FOMC, the market fully prices for a 25 bps hike but for a minimal (~6%) chance of a 50 bps hike.
CHART 3 LOWER LEFT
Source: Bloomberg. As depicted here, Money Market Fund (MMF) AUM (RHS, $bn) rose markedly late in 2022 and now rest near a record $4.813trn. The AUM experienced a continued ascent to begin 2023, as it grew ~$73.2bn in the year’s first week, led by Government-Only funds rising $54.4bn. The $18.8bn increase in Prime Funds’ AUM, meanwhile, represented the 29th consecutive week of net inflows to this sector. The MMF complex should continue to represent a competitive threat to bank deposits, as the sector’s yields have kept pace with Fed rate hikes and thereby attracted cash.
CHART 4 LOWER RIGHT
Source: JP Morgan. This past week’s FHLB-NY President’s report (https://www.fhlbny.com/news/presidents-report/2023/pr010923) emphasized the powerful impact of FHLB-NY membership on members and their customers and communities. Via membership, each institution gains access to the global funding markets and a dependable source of on-demand liquidity. This feature was clear in 2022 at FHLB-NY and across the FHLB-system, as members notably increased advance usage post the “highly-liquid” period in the aftermath of the pandemic’s onset. Indeed, the FHLB model is designed to expand or contract naturally based on member needs, as evident in this chart of FHLB-system short-term (“discount notes”) debt outstanding (LHS, $bn) over the past few years. Issuance spiked at the onset of the pandemic in early 2020, as members sought to secure precautionary funding. After a subsequent descent, outstanding amounts grew again, especially as the Fed’s hiking cycle was underway and the “highly liquid” era of 2021 was left in the rear-view mirror. The FHLB-NY looks forward to working with you in 2023!
FHLBNY Advance Rates Observations
Front-End Rates
- Short-end rates moved higher over the past week, partly attributable to maturities crossing further into the Fed’s expected hiking timeline and partly owing to volatile supply/demand technical dynamics in T-bill and discount note markets. Please see the previous section for more specific Fed-pricing color. Rates in the 3mo-and-in sector were up by 11 to 23 bps, led by shorter tenors, while tenors thereafter were higher to a lesser degree.
- Given the Fed’s tightening and data-dependent posture, rates will remain responsive to economic data this upcoming week.
Term Rates
- The longer-term curve finished dramatically lower from a week ago, with the 3 to 5-year sector ~40 bps lower on average. Kindly refer to the previous section for relevant market color. The advance curve remains inverted out to 5-year, thereby offering opportunities to extend in advance duration for minimal or lower coupon cost. The flat curve and still relatively high implied volatility environment also can serve to make putable advances more compelling.
- On the UST term supply front, this upcoming week serves a 20-year nominal and a 10y TIPS auction. Kindly call the Member Services Desk desk for information on market dynamics, rate levels, or products.
Product Alert: FHLBNY is pleased to announce the reintroduction, after a temporary suspension owing to Libor-cessation, of the Putable Advance, Fixed-Rate with SOFR Cap Advance, and ARC with SOFR Cap/Floor Advance. The Callable Advance continues to be offered. This expansion of the product menu will provide members with more options and flexibility for the management of funding and/or hedging needs.
Forward Start Advance (FSA): For members with upcoming borrowing or refunding plans, consider the FSA as a method to opportunistically “lock in” rates before advance settlement date. Please contact the Member Services Desk at (212) 441-6600 for more information.
The Symmetrical Prepayment Advance Feature
For those anticipating term funding needs, and with rates on an uptrend, it can be an appropriate juncture to consider our SPA feature. This feature allows the member to capture, at prepayment, changes in the fair value of the advance which are favorable to the member. Contact Member Service Desk to discuss.
Looking for more information on the above topics? We’d love to speak with you!
Questions?
If you wish to receive the MSD Weekly Market Update in .pdf format (includes FHLBNY rate charts) or to discuss this content further, please email the MSD Team.