Member Services Desk
Weekly Market Update
This MSD Weekly Market Update reflects information for the week ending March 22, 2024.
Economist Views
Click to expand the below image.
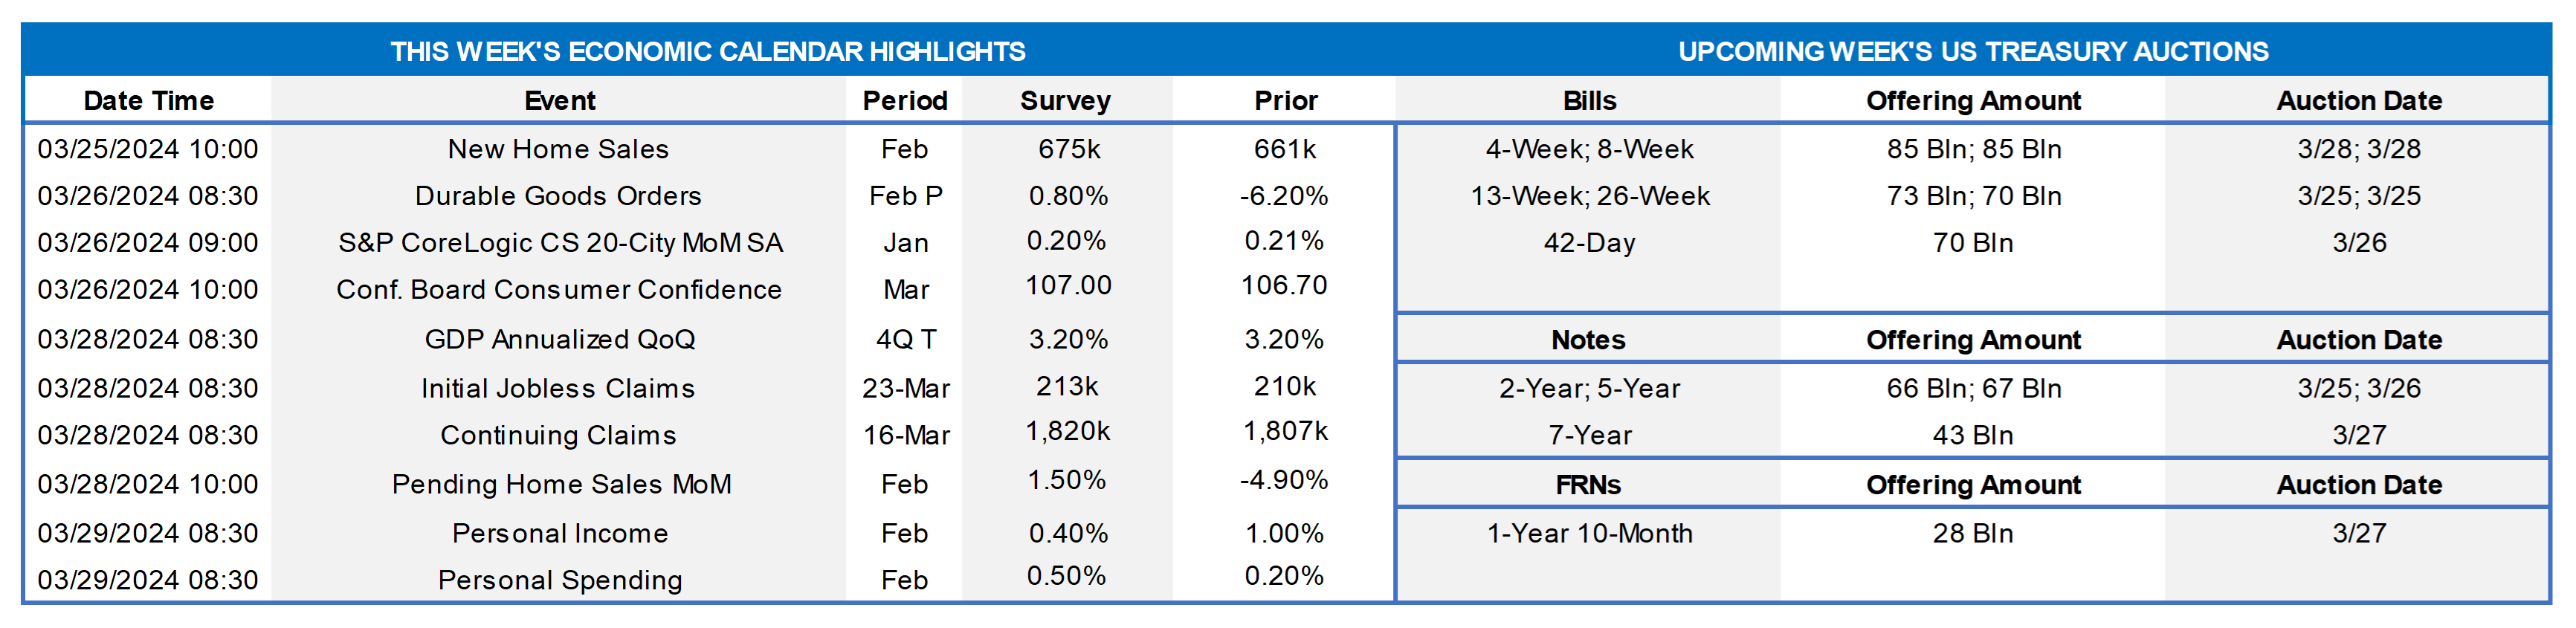
Having weathered the latest Federal Open Market Committee (FOMC) meeting and digested an updated set of policymakers’ projections, the attentions of market participants will return to the economic release calendar. This week’s soundings likely will be mixed with new home sales, durable goods orders, pending home sales and consumer spending in February all expected to improve, while consumer confidence and personal income ebb. Current-quarter real GDP tracking estimates have been gradually moving higher, with most projections registering near an above-trend 2% annualized clip, after the fall quarter’s 3.2% gain. As of this writing, there is just one policymaker, Atlanta Fed President and FOMC voter Raphael Bostic, slated to participate in a moderated conversation about equitable economic development at the University of Cincinnati Real Estate Center’s March roundtable.
New Home Sales: Weather-supported increases in single-family building permits and housing starts suggests that contract signings on newly constructed dwellings jumped by 8.2% to a seven-month high seasonally adjusted annual rate of 715K in February.
Durable Goods Orders: Hard-goods bookings probably edged .4% higher in February, reversing little of the commercial jetliner-led 6.2% drop witnessed in January. As always, pay attention to nondefense capital goods shipments excluding aircraft deliveries for clues to the strength of business equipment spending during the current quarter.
S&P CoreLogic Case-Shiller (SPCLCS) 20-City Home Price Index: Home price increases probably continued apace across the twenty major metropolitan areas canvassed by SPCLCS in January, edging .2% higher for a third straight month. That projection, if realized, would place the SPCLCS barometer 6.8% above the level posted at the beginning of 2023.
Conference Board Consumer Confidence: Early month soundings from the University of Michigan imply that the gauge dipped to 106 in March from the 106.7 reading recorded in February.
Jobless Claims: Initial claims for unemployment insurance benefits probably remained rangebound between 200-220K during filing period ended March 23. Continuing claims – the total number of persons collecting benefits – likely registered slightly above the 1.8mn mark during the week ended March 16 – a sign that the recently unemployed are having little problem finding work.
Real GDP Growth: Input data released after the Bureau of Economic Analysis’ preliminary report suggest that real GDP growth during the fall quarter likely will be boosted from the previously reported 3.2% annualized pace. This report will also include an initial Q4 estimate of real gross domestic income, or real GDI, an alternative measure of aggregate economic activity.
Pending Home Sales: Buoyed by a favorable swing in weather conditions, home-purchase contract signings probably rebounded in February, after the surprising 4.9% drop posted in January.
Personal Income & Spending: Capped by an anticipated slowdown in wage and salary disbursements, personal income likely rose by .2% in February, following the dividend and social security led 1% jump in January. By contrast, the pace of consumer spending probably quickened during the reference period, rising by .5% after a .2% prior-month gain. While hikes in core consumer prices ebbed slightly in February, the year-to-year growth in the Federal Reserve’s preferred inflation metric probably held steady at 2.8%.
Federal Reserve Appearances: Mar. 25 Atlanta Fed President Bostic to discuss equitable economic development at the University of Cincinnati.
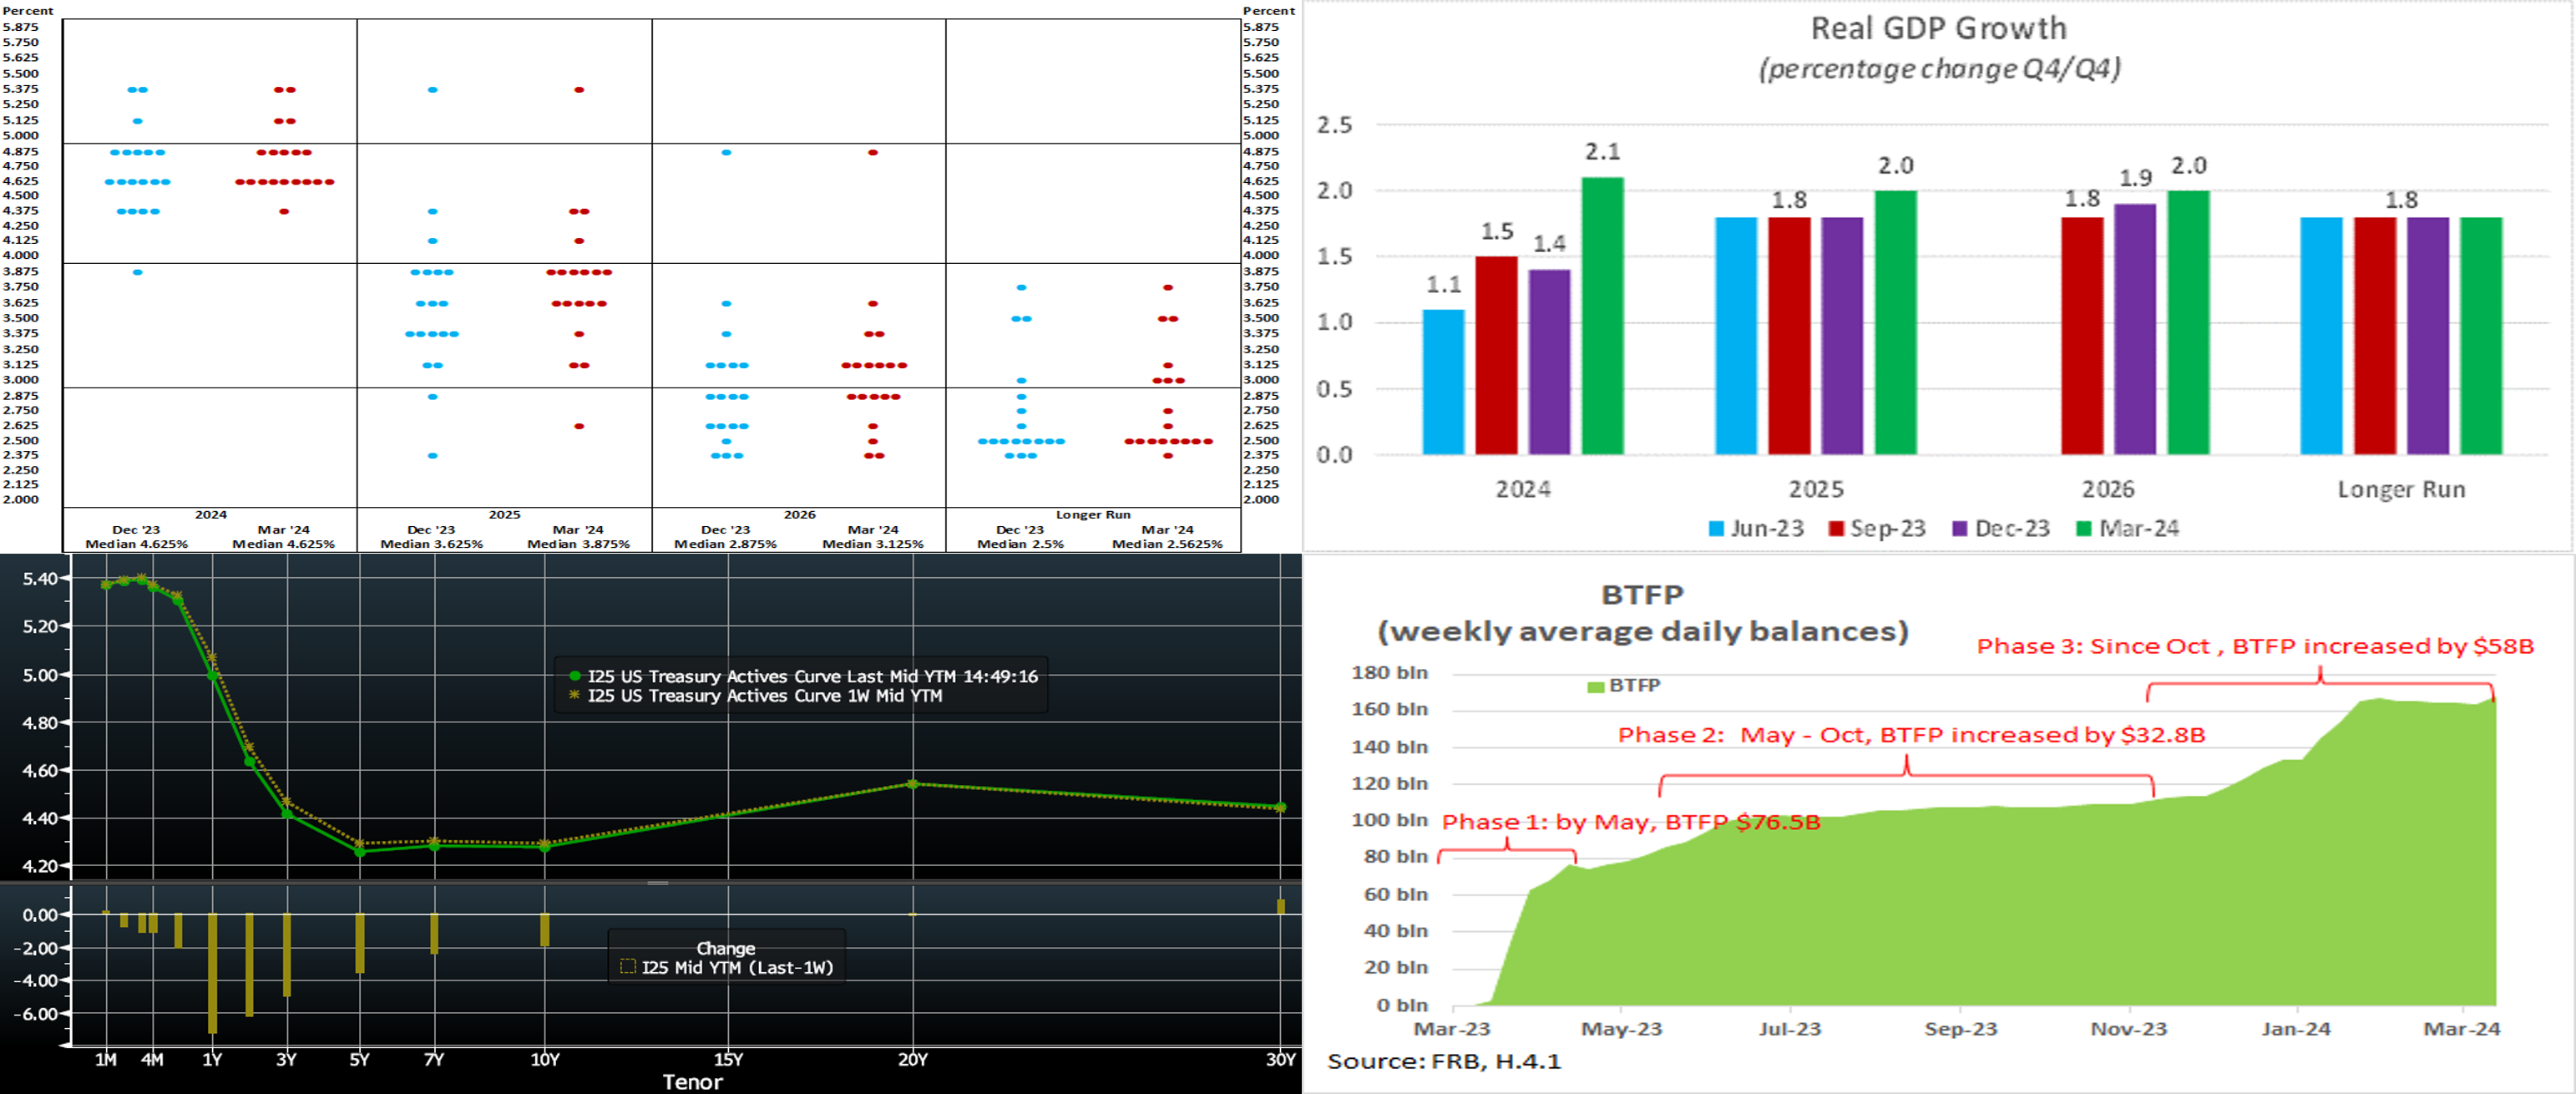
CHART 1 UPPER LEFT
Source: Board of Governors of Federal Reserve; FHLB-NY. As widely anticipated, the FOMC decided unanimously to leave the fed funds rate target range unaltered at 5¼% to 5½% at this week’s meeting. Per convention, the Fed also released an updated Summary of Economic Projections (SEP). The so-called “dot plot” contained updates to expectations for the yearend rate target over the next three years, as seen here. Fed officials continue to anticipate three 25 bps cuts over the course of 2024, thereby leaving the target range at 4½% to 4¾% at yearend. The range of projections, however, was narrower than those of the December SEP. The dot plot shows a slight paring back of future cuts, however. The median call for end-2025 is now a further 75 bps, compared to December’s 100 bps, of cuts to 3¾% to 4%. The median forecast for year-end 2026 continues to anticipate an additional 75-bps reduction to 3% to 3¼%. With the dots shifting from those of the December SEP, the median expectation for the fed funds rate over the longer term was marked marginally higher to 2.5625% from 2.50%.
CHART 2 UPPER RIGHT
Source: Board of Governors of Federal Reserve; FHLB-NY. Likely one of the reasons for the slight uptick in the end-2025 dot was the FOMC updates of economic variables. For instance, as seen here, Fed officials now expect real GDP growth over the course of this year to register at an above-trend (trend being 1.8%) 2.1%, up markedly from 1.4% at the December FOMC meeting. Real GDP over calendar-year 2025 is expected to then moderate to 2.0%, compared to December’s 1.8% projection, and this 2% pace is expected to persist in 2026. Market participants’ median estimate of trend real GDP growth over the longer run remained unchanged at 1.8%. In a nutshell, the Fed marked up real GDP growth over the next three years to above-trend levels. Meanwhile, it slightly marked higher its 2024 inflation expectation and edged lower than its unemployment projections. In this light, the decision to keep rates unchanged for now and “wait and see” was unsurprising.
CHART 3 LOWER LEFT
Source: Bloomberg. Bloomberg. Top pane is yield (LHS, %), bottom pane is change (LHS, bps). From last Thursday afternoon to this one, the UST curve moved slightly lower (except 30-year) and steeper. The 2-year was ~6 bps lower, while the 10-year was ~ 2 bps lower. It was literally a down-and-up week for yields, as they began the week moving higher only to reverse course post-FOMC. The market appears to have taken solace in the FOMC’s tone and Chair Powell’s acknowledgement that rate cuts are likely in 2024. Moreover, Chair Powell noted that a slowing of the Fed’s bond portfolio runoff should be “fairly soon”. In terms of market-implied pricing of the Fed, a full 100% probability of a 25 bps cut is still August 1st, with the June 13th FOMC priced at ~75% chance, up from 62% last week. The year-end 2024 forward is ~4.525%, roughly 6.5 bps lower than last week. Therefore, the market prices for a cumulative total of ~80.5 bps of cuts by the end of 2024, or ~6.5 bps more than a week ago.
CHART 4 LOWER RIGHT
Source: Federal Reserve H.4.1, FHLB-NY. It was good for banks while it lasted, but the Fed’s Bank Term Funding Program (BTFP), launched in March 2023 as a special liquidity outlet, ended last week. Shown here is the trend in BTFP balances (LHS, $bn) over the program’s life, with notable increases at program inception and, owing to being priced off the 1-year curve point, during periods that its rate fell well below other market short-term rates. For members who partook in the BTFP, we encourage you to engage with us on replacement funding ideas and timing. Also, we remind members to consider the impact of the FHLB-NY dividend in their assessment of replacement funding options; please contact us for a copy of our “All-in” Pricing Tool for help in this regard.
FHLBNY Advance Rates Observations
Front-End Rates
- Short-end rates were mildly mixed week-over-week, with the 2-month-and-in zone a bp or two higher but 3-month-and-out lower by two to three bps. Net T-bill supply, after a long spell in positive territory, is now expected to decrease and eventually turn negative next month. This development, all else equal, may help tighten spreads on FHLB paper. Moreover, short-end supply continues to be absorbed well, as Money Market Funds (MMFs) currently stand at or near all-time high AUM levels.
- With the FOMC now in the rearview mirror, the market will focus on economic data in the upcoming week.
Term Rates
- The longer-term curve, generally mirroring moves in USTs and swaps, was a bit lower and steeper week-on-week. While the 2-year fell ~6 bps, the 5-year and 10-year were ~4 and 3 bps lower, respectively. Please refer to the previous section for color.
- On the UST term supply front, the upcoming week serves 2/5/7-year auctions. Note that UST auctions usually occur at 1pm and can occasionally cause volatility around that time. Please contact the Member Services Desk for further information on market dynamics, rate levels, or products.
The FHLBNY is pleased to announce the 2024 0% Development Advance (ZDA) Program, now available with a new streamlined submission process. This program provides members with subsidized funding in the form of interest rate credits to assist in originating loans or purchasing loans/investments that meet the eligibility criteria under the Business Development Advance (BDA), Climate Development Advance (CDA), Infrastructure Development Advance (IDA), or Tribal Development Advance (TDA). Please contact the Member Service Desk for information and/or visit our ZDA information page.
Price Incentives for Advances Executed Before Noon: In effect as of Tuesday, September 5, 2023, the FHLBNY is pleased to now offer price incentives for advances executed before Noon each business day. These pricing incentives offer an opportunity to provide economic value to our members, while improving cash and liquidity management for the FHLBNY. For further details, kindly refer to the Bulletin.
The Symmetrical Prepayment Advance Feature
For those anticipating term funding needs, and with rates on an uptrend, it can be an appropriate juncture to consider our SPA feature. This feature allows the member to capture, at prepayment, changes in the fair value of the advance which are favorable to the member. Contact Member Services Desk to discuss.
Looking for more information on the above topics? We’d love to speak with you!
Questions?
If you wish to receive the MSD Weekly Market Update in .pdf format (includes FHLBNY rate charts) or to discuss this content further, please email the MSD Team.