Member Services Desk
Weekly Market Update
This MSD Weekly Market Update reflects information for the week of September 6, 2021.
Economist Views
Click to expand the below image.
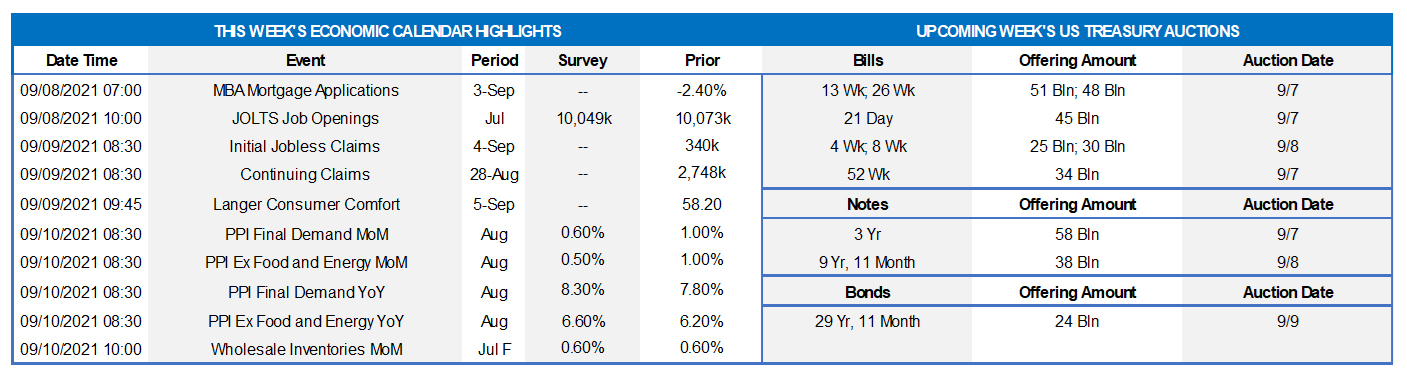
Having weathered the normal data deluge at the beginning of the month, market participants will have to contend with a very light economic release calendar after the extended Labor Day weekend. Labor demand likely strengthened in July, with job openings climbing to yet another new peak. Unemployment insurance soundings probably improved further over their latest reporting periods. Producer prices are expected to have slowed from July’s hectic pace. The Federal Reserve’s Beige Book will provide useful color on developments in the FHLB-NY district. Federal Reserve officials will make several public appearances over the course of this week to discuss a variety of timely topics.
JOLTS Job Openings:
A surge in online help-wanted postings suggests that total job openings jumped by 380K to a record-high 1.045 million in July. That projection, if realized, would widen the gap between available positions and the jobless to an all-time high of 1.45 million two months ago.
Jobless Claims:
Initial and continuing claims under regular state unemployment insurance programs likely retreated during their latest respective reporting periods. Those figures continue to overstate the improvement in the labor market from the worst of the pandemic, however. Indeed, as of the week ended August 14, 12.2 million persons were receiving some sort of unemployment assistance, down from the pandemic peak of 32.4 million reached a year ago but still well above the 2.1 million prevailing before the shuttering of the economy. Using August’s level as a base, 7.5% of the civilian labor force were receiving some form of unemployment insurance payments three weeks ago.
Producer Price Index:
Anticipated slowdowns in core goods and services costs likely capped the rise of the Producer Price Index for final demand at 0.6% in August, following a 1.0% prior-month increase. That projection, if realized, would place the headline PPI 8.3% above the level recorded 12 months earlier.
Federal Reserve:
- Sept. 8 New York Fed President Williams to discuss the economic outlook at a virtual event host by St. Lawrence Univ.
- Sept. 8 Federal Reserve to release Beige Book Summary of Regional Economic Conditions.
- Sept. 8 Dallas Fed President Kaplan to hold a virtual townhall discussion.
- Sept. 9 San Francisco Fed President Daly to take part in a Brookings panel discussion The Economic Gains from Equity.
- Sept. 9 Chicago Fed President Evans to make opening remarks at a virtual event exploring career pathways in economics.
- Sept. 9 Fed Governor Bowman to discuss community bank access to innovation at an American Bankers Assn meeting.
- Sept. 9 Regional Fed Presidents Kaplan, Kashkari, Rosengren and Williams to discuss racism and the economy.
- Sept. 10 Cleveland Fed President Mester to speak at a Bank of Finland Conference.
Click to expand the below images.
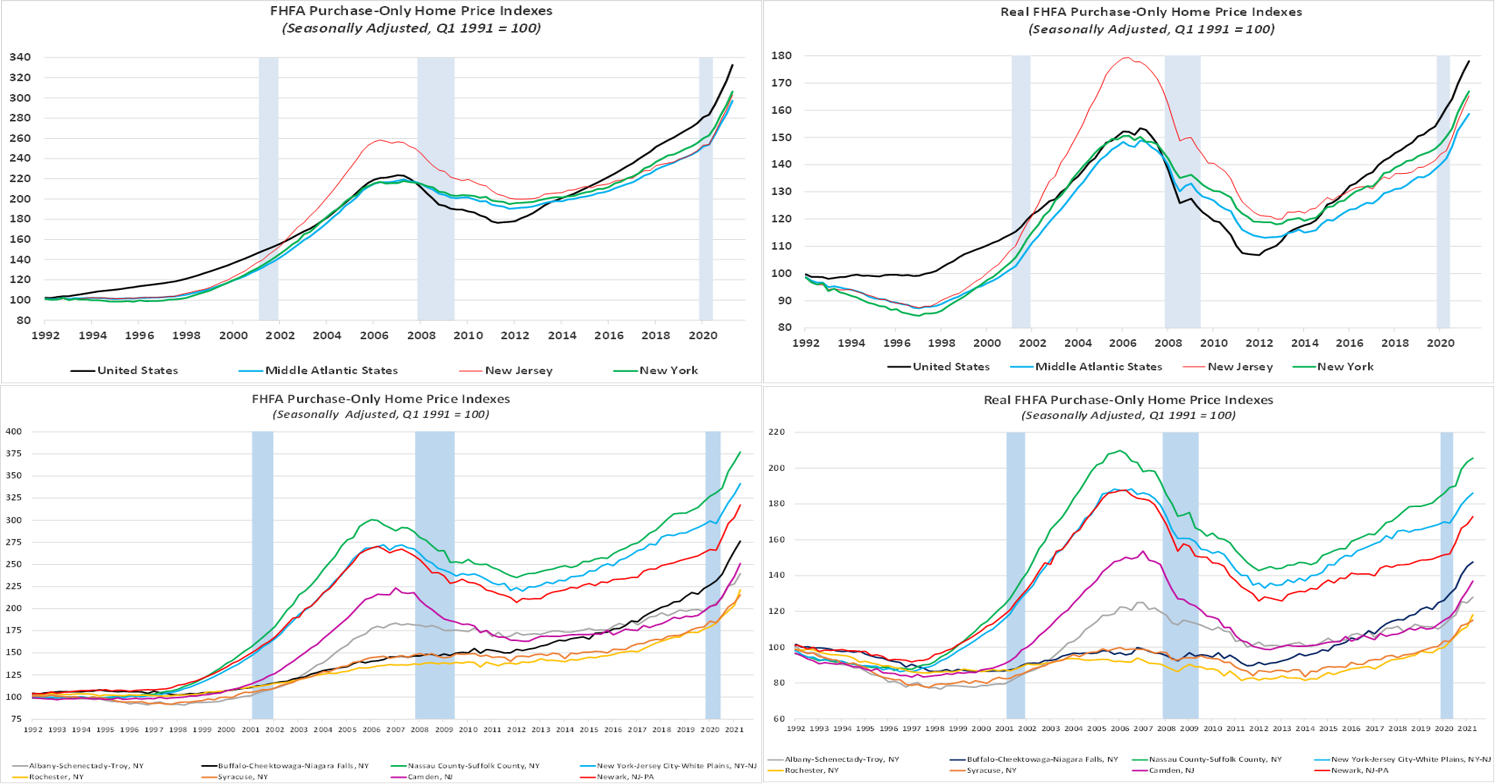
CHART 1 UPPER LEFT
Source: Federal Housing Finance Agency, Bureau of Labor Statistics, National Bureau of Economic Research, and FHLBNY estimates.
Solid demand amidst historically low inventory levels continues to propel home prices sharply higher across the country and within the FHLB-NY district. Indeed, during Q2, the average nominal cost of a home nationwide stood 48.8% above its pre-Great Recession peak, with those in New York and New Jersey changing hands at 40.6% and 17.4% above their respective levels at that time.
CHART 2 UPPER RIGHT
Source: Federal Housing Finance Agency, Bureau of Labor Statistics, National Bureau of Economic Research, and FHLBNY estimates.
The picture is dramatically different when inflation is taken into account. Real home prices across the U.S. stood a less frothy 16.1% above their Fall 2006 level, while those in the Empire State were 10.9% above the previous housing-cycle top. By contrast, home prices in the Garden State remain almost 8% shy of their all-time inflation-adjusted peak.
CHART 3 LOWER LEFT
Source: Federal Housing Finance Agency, Bureau of Labor Statistics, National Bureau of Economic Research, and FHLBNY estimates.
Aggregate state figures mask considerable differences in home-price performance across the FHLB-NY coverage area. Over the latest four quarters, nominal home cost increases have ranged from a 14% gain in Nassau and Suffolk, NY counties to a 22.8% jump in the Camden, NJ area.
CHART 4 LOWER RIGHT
Source: Federal Housing Finance Agency, Bureau of Labor Statistics, National Bureau of Economic Research, and FHLBNY estimates.
In real terms, home price gains in the Buffalo, Rochester, and Syracuse, NY metropolitan areas have been especially impressive.
FHLBNY Advance Rates Observations
Front-End Rates
Short-end advance rates finished unchanged out to 2-month and a bp lower thereafter on the week. Money Market Funds’ AUM decreased by ~$17.3bn this past week, but demand for short paper and the Fed’s RRP, which still stands well over $1.0 trillion, remains strong. The overall supply/demand paradigm persists in suppressing rate levels, as the GSEs continue to invest large sums into money markets, the TGA continues its decline, and the short-maturity paper is in short supply.
UST issuance overall is now net positive supply in that more is being issued than what the Fed is buying in its programs. However, with short UST rates at rock-bottom levels and the Fed on hold, rates are likely to persist in a near-term sideways pattern. Importantly, weekly net T-bill issuance has been lower since 2020 and negative in recent months, and Treasury intends to shift issuance out the curve. Moreover, the looming federal debt ceiling may further constrain issuance. Further legislative packages and related borrowing may lead to an eventual increase of T-bill auction sizes and positive net supply, but for now, overall market supply/demand dynamics should keep short rates in check from large moves to the upside.
Term Rates
The Advance rate curve was relatively unchanged from a week prior. 1-year rates were flat week over week, 3-year lower by 2-3 bps and 5-year were 1-2 bps lower. On the longer end the 6 to 10-year sector closed 1-2bps lower as well.
On the UST supply front, this week brings a $120 bln in auctions across the curve – 3s/10s/30s. The market will monitor economic data and any additional Fed officials’ pronouncements regarding the taper of bond purchases. September is the second most active month for Corporate issuance, so we could see significant flows in the treasury market throughout the month.
Product Enhancement Alert: FHLBNY, this past week announced an enhancement to the Callable Adjustable Rate Credit Advance (“Callable ARC”). The product features a 1-time call/cancel option (member’s option) to extinguish funding early at no cost via two distinct option structures, thereby giving members flexibility in meeting the demands of a fluctuating balance sheet. Given the shorter-term nature of the current borrowing environment, the minimum term for the Callable ARC has been lowered to 4-month (from the previous 7-month) for our 1-month-left-to-maturity call option (SOFR or 1-month Libor index available) to better meet our members’ needs. Meanwhile, the 3-year Non-Call 2-year product for SOFR continues to be offered to members for their longer-term needs.
New Product Alert: In order to satisfy member needs and provide greater product flexibility to match bond and derivative market conventions, FHLB-NY now offers SOFR-linked advances based on SOFR-index compounding. Note that this product is in addition to SOFR-linked advances based on SOFR-index averaging which have been offered since November 2018.
The Symmetrical Prepayment Advance Feature
With rates at or near multi-year lows, it is a compelling juncture to use the SPA feature on term advances. This feature allows member to capture, at prepayment, changes in the Fair Value of the advance which are favorable to the member. Contact us to discuss.
Looking for more information on the above topics? We’d love to speak with you!
Questions?
If you wish to receive the MSD Weekly Market Update in .pdf format (includes FHLBNY rate charts) or to discuss this content further, please email the MSD Team.
Special Member Alert
The FHLBNY recently announced a newly expanded and flexible Disaster Relief Funding (DRF) advance program which offers discounted rate advances with maturities 1-mo and greater. Additionally, we have announced that PPP loans will be accepted as eligible collateral. Please contact us with any questions.