Member Services Desk
Weekly Market Update
This MSD Weekly Market Update reflects information for the week of May 10, 2021.
Economist Views
Click to expand the below image.
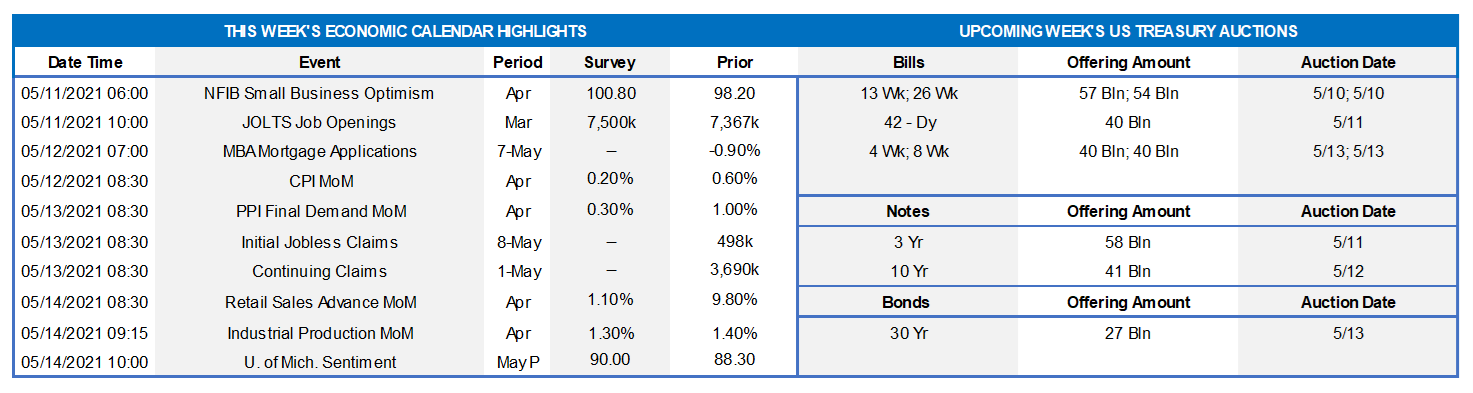
NFIB Small Business Optimism: Small business sentiment probably improved further in April, lifting the gauge to 101.0 – the rosiest reading since November.
JOLTS Job Openings: A reported jump in online postings hints that the BLS’ count of openings climbed by 193K to 7.56mn in March – the highest level since the series’ inception in December 2000.
Consumer Price Index: Lower retail energy costs probably capped the rise of the CPI at .2% in April, after a .6% increase in March. Excluding anticipated movements in food and energy costs, the so-called core CPI likely moved .3% higher, matching the previous month’s gain. The median Street projections, if realized, would place the overall and core CPIs 3.6% and 2.3% above their respective year-ago levels.
Jobless Claims: Initial and continuing claims under regular state unemployment insurance programs probably moved lower during their respective reporting periods. While encouraging, those figures continue to understate the adverse impact of the pandemic and the slow healing of the domestic labor market, however. Indeed, as of April 17, an estimated 16.1mn persons were receiving some sort of unemployment assistance, down from the pandemic peak of 32.4mn reached last June but still well above the 2.1mn prevailing before COVID-19 struck in March 2020.
Retail & Food Services Sales: The Census Bureau’s update on retail activity in April will provide valuable information on consumer spending growth. Powered by a sharp rise in motor vehicle purchases, retail and food services sales likely climbed by 1%, after a 9.7% leap in March. As always, market participants will pay particular attention to control sales excluding auto, building materials and gasoline purchases. Barring any prior-month revisions, the 0.3% dip anticipated by the Street would still place core purchases a solid 12.5% annualized above their Q-1 average.
Industrial Production: Output of the nation’s factories, mines, and utilities is expected to have risen by 1.2% in April, almost matching the 1.4% jump recorded in March. With production expected to eclipse additions to productive capacity by a wide margin during the reference period, the overall operating rate probably climbed to 75.2% from 74.4% in the preceding month.
Michigan Consumer Sentiment Index: Upbeat appraisals of current and future conditions probably propelled this consumer confidence gauge to 92.5 – the highest reading since March 2020.
Federal Reserve Appearances:
May 10: Chicago Fed President Evans to speak about the economic outlook at a virtual event.
May 11: New York Fed President Williams to speak at event hosted by the Alternative Reference Rate Committee.
May 11: Federal Reserve Governor Brainard to take part in a virtual moderated Q&A sponsored by SABEW.
May 12: Federal Reserve Vice Chair Clarida to give virtual speech to the National Association for Business Economics.
May 12: Philadelphia Fed President Harker to speak at event hosted by the Institutions of Higher Education.
May 13: St. Louis Fed President Bullard to discuss the U.S. economic and monetary policy outlook.
Click to expand the below images.
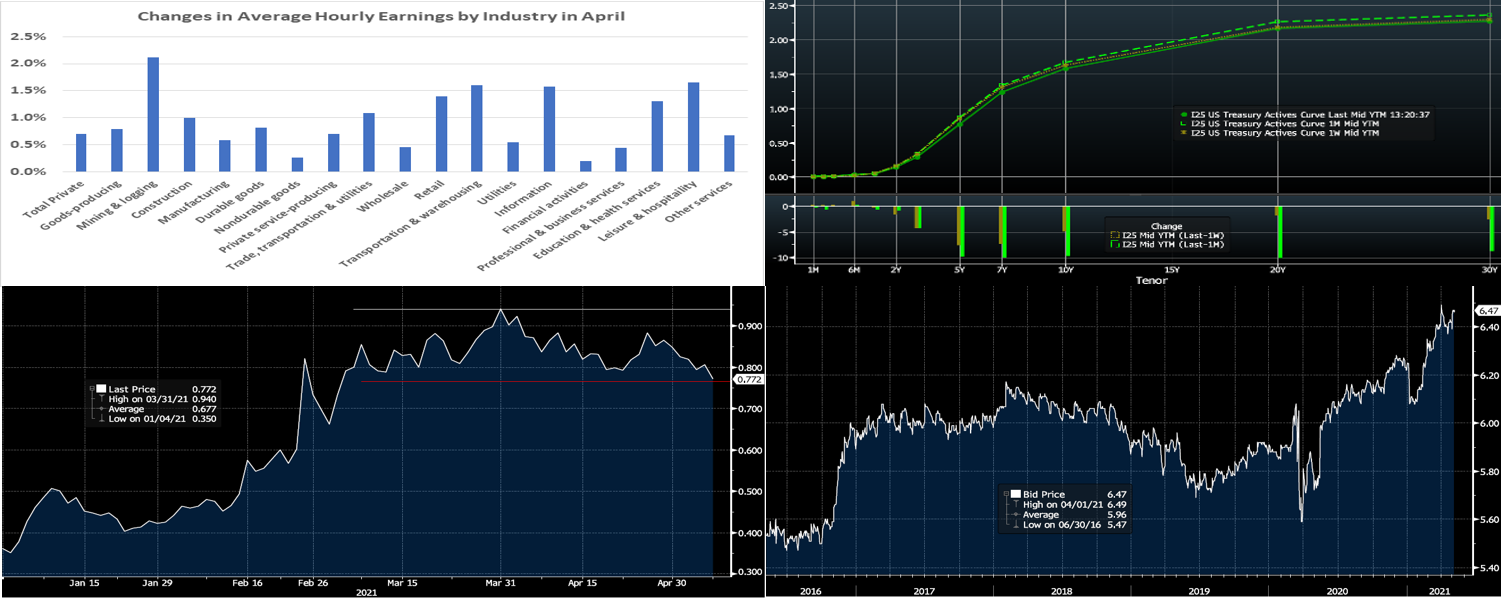
CHART 1 – UPPER LEFT
Source: BLS, FHLBNY. Nominal compensation was a bright spot in a generally disappointing April employment report. Average hourly earnings jumped by .7%, or by 21 cents, to $30.17 in April, after a .1% dip in March. Completely at variance with the .4% decline anticipated by the Street, the reported increase was widespread across major industry segments and not attributable to shifts in the composition of employment during the reference period. Reflecting base effects, the latest figure represented a modest .3% increase from the $30.70 paid to workers 12 months earlier.
CHART 2 – UPPER RIGHT
Source: Bloomberg. Note: top pane is yield (%), bottom pane is change (bps). UST yields declined over the past week, with much of the move precipitated by the weaker-than-consensus employment report on Friday morning. The belly of the curve, namely the 5 to 10-year sector, led the move. The 5-year finished ~8bps lower on the week, with the 10-year ~5 bps lower. The disappointing jobs report was at odds with generally positive data during the week. The market reaction to the release was to reprice slightly lower the chances and degree of Fed hikes in 2023 and beyond. Meanwhile, the Fed as well as foreign and real-money investor buying, continues to provide a steady demand backdrop for bonds. Notably on Friday, however, yields quickly bounced higher from even lower levels; for instance, the 5-year hit .713% but then retraced ~5-6bps higher during the morning. These data reports can be “noisy” and subject to revision, especially as the economy recovers from the pandemic and its impacts. This week the market will further digest/dissect the jobs report while also facing a deluge of UST supply in the form of 3/10/30-year auctions.
CHART 3 – LOWER LEFT
Source: Bloomberg. Portrayed here is the year-to-date trend of the 5-year UST yield (RHS, %). Since early March post the winter selloff and ramp-up of vaccinations and subsequent better economic data, the yield has traded in relatively range-bound fashion. After this past Friday’s move, driven by the jobs report, the yield resides at the low end of the past two-month range and could represent an opportune zone for those with any term funding needs. As a reminder, until May 28 we are conducting a special offering on Symmetrical Prepayment Advances (“SPA”) in which members can receive prepayment “Symmetry” at no additional coupon cost when booking regular fixed-rate, non-amortizing advances with terms of 2-year or longer. This feature is compelling in a rising rate environment, as it allows the member to capture, at prepayment, changes in the Fair Value of the advance which are favorable to the member. Please call the desk to inquire on further specifics.
CHART 4 – LOWER RIGHT
Source: Bloomberg. Depicted here is the estimated modified duration (RHS, years) of the Bloomberg Barclays US Aggregate Bond Index. This index includes UST’s, corporates, MBS, ABS, and Municipals, in order to simulate the universe of bonds in the market. The duration is at a notably high level which means, simply and plainly, that there is a lofty degree of price risk in bond markets and that the impacts of an eventual and/or sudden rise in yields could be notable. The benefits of the aforementioned “SPA” could be helpful in such a scenario by providing some protection to securities portfolios and/or economic value of equity measures while also providing overall greater flexibility in balance sheet management.
FHLBNY Advance Rates Observations
Front-End Rates
Short-end advance rates finished flat to a bp higher week-over-week. Money Market Funds’ AUM decreased by ~$17bn on the week, led by a $11.9bn decrease in Government-Only funds, thereby providing some relief from the recent relentless demand. But the GSEs are placing larger sums into money markets, and the US TGA continues its decline. From a bigger-picture vantage point, the overall moderation in the supply of short paper, relative to high cash levels in the market, is expected to keep short-end rates relatively steady and under downward pressure in the year’s first half.
UST issuance overall is now net positive supply in that more is being issued than what the Fed is buying in its programs. However, with short UST rates at rock-bottom levels and the Fed on hold for a long period, rates are likely to persist in a near-term sideways to softer pattern. Importantly, weekly net T-bill issuance has been lower since 2020 and even negative in recent months (see last week’s edition for further information), and Treasury has announced plans to shift issuance out the curve. The latest relief package and related borrowing may lead to an eventual increase of T-bill auction sizes and positive net supply, but overall market supply/demand dynamics should keep short rates in check on the upside.
Term Rates
On the week, medium and longer-term Advance rates were lower, led by the 5 to 7-year zone. The 5-year was ~9 bps lower, while the 2-year was ~3 bps lower and the 10-year ~4bps lower. Kindly refer to the previous section for further color on relevant market dynamics.
On the UST supply front, this week brings a hefty UST calendar in the form of 3/10/30-year auctions. The market will maintain its attention on any Covid-19 and legislative developments this week, while also paying a close mind to follow-up information and data from the past week’s surprisingly tame jobs report.
Advance Special Offering: Symmetrical Prepayment Advance feature —Please contact your Relationship Manager at
212-441-6700 or the Member Services Desk at 212-441-6600 for information.
New Product Alert: In order to satisfy member needs and provide greater product flexibility to match bond and derivative market conventions, FHLB-NY now offers SOFR-linked advances based on SOFR-index compounding. Note that this product is in addition to SOFR-linked advances based on SOFR-index averaging which have been offered since November 2018.
The Symmetrical Prepayment Advance Feature
With rates at or near multi-year lows, it is a compelling juncture to use the SPA feature on term advances. This feature allows member to capture, at prepayment, changes in the Fair Value of the advance which are favorable to the member. Contact us to discuss.
Looking for more information on the above topics? We’d love to speak with you!
Questions?
If you wish to receive the MSD Weekly Market Update in .pdf format (includes FHLBNY rate charts) or to discuss this content further, please email the
MSD Team.
Special Member Alert
The FHLBNY recently announced a newly expanded and flexible Disaster Relief Funding (DRF) advance program which offers discounted rate advances with maturities 1-mo and greater. Additionally, we have announced that PPP loans will be accepted as eligible collateral. Please contact us with any questions.