Member Services Desk
Weekly Market Update
This MSD Weekly Market Update reflects information for the week ending January 26, 2024.
Economist Views
Click to expand the below image.
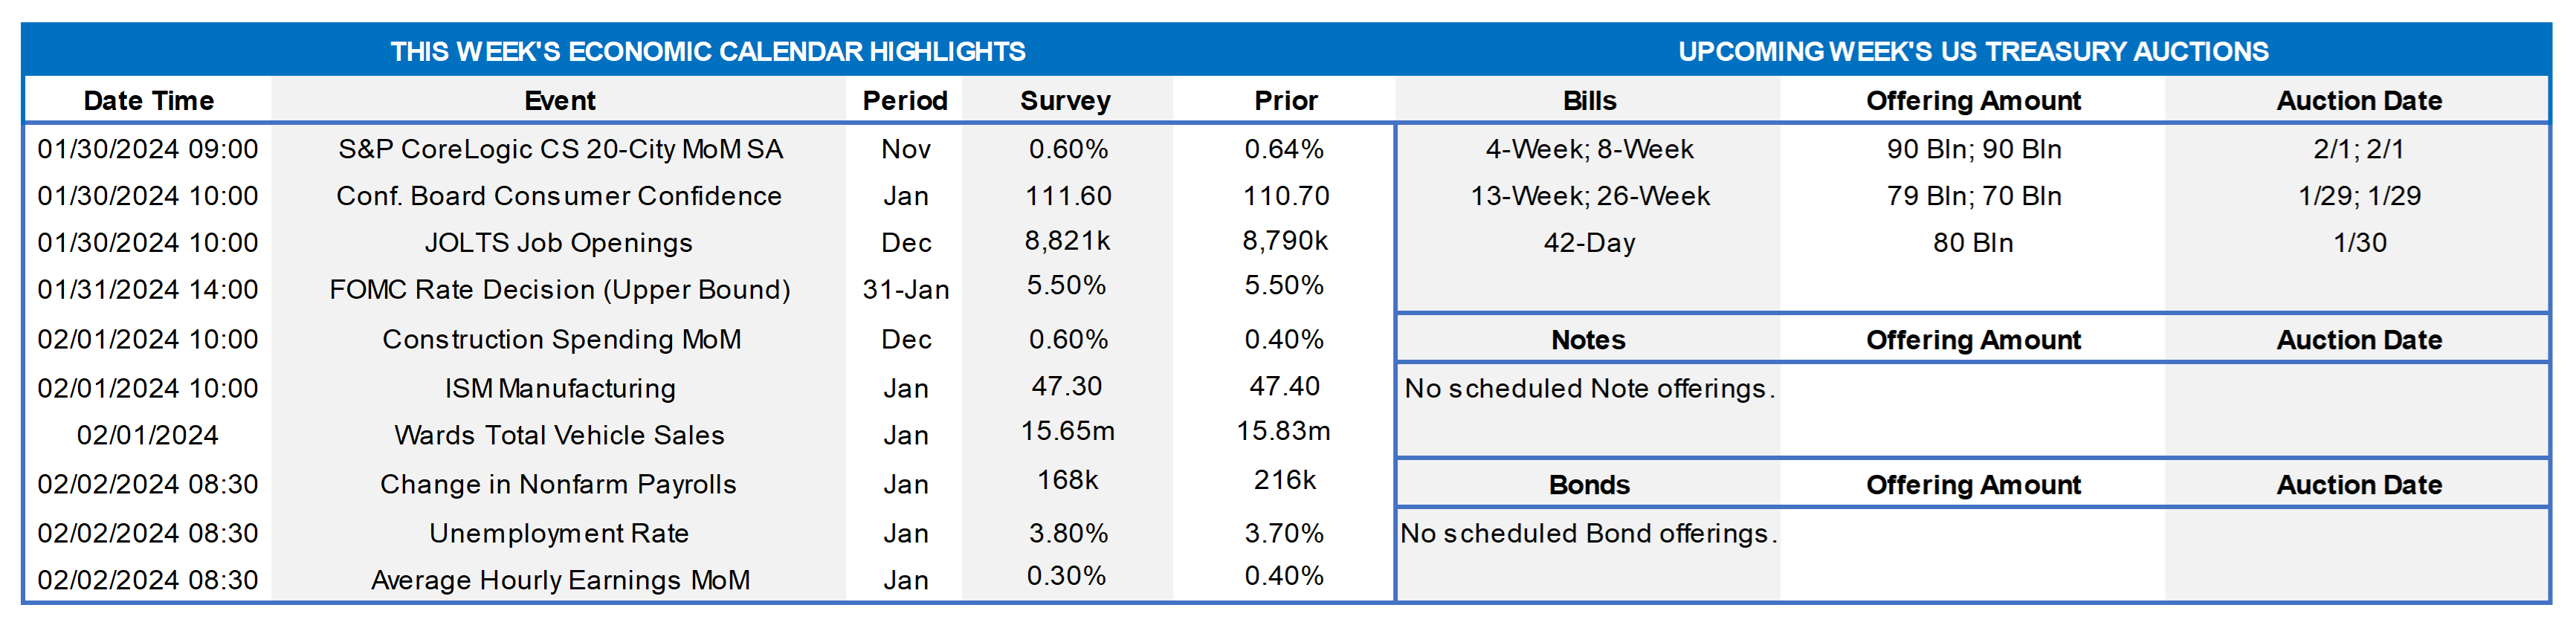
The Federal Open Market Committee (FOMC) meeting will be the main event this week. Policymakers are expected to leave the rate target range unaltered at 5¼% to 5½%. The post-meeting communiqué likely will repeat that recent indicators suggest that economic activity has slowed from its strong Q3 pace and reiterate that job gains have moderated since earlier in the year but remain strong and that the unemployment rate has remained low. Acknowledging ongoing progress, policymakers probably will note once again that inflation has eased over the past year yet remains elevated. Echoing the statement issued after their mid-December gathering, policymakers likely will remark that the banking system is sound and resilient, although tighter financial and credit conditions for households and businesses may weigh on future economic activity, hiring, and inflation. Also likely to be repeated is that in assessing the appropriate stance of monetary policy, the FOMC will continue to monitor the implications of incoming data for the outlook and would be prepared to adjust as appropriate if risks emerge that could impede the attainment of its goals. The FOMC’s assessments will consider a range of information, including readings on the labor market, inflation pressures and inflation expectations, and financial and international dynamics. The FOMC will continue reducing its holdings of UST, agency debt, and agency MBS. To date, runoffs of maturing securities have pared the SOMA to $7.19trn from the $8.5trn peak reached in July 2022.
S&P CoreLogic Case-Shiller (SPCLCS) 20-City Home Price Index: Home prices probably edged .56% higher in November across the twenty major metropolitan areas canvassed by SPCLCS, boosting the cumulative rise since January to 6.7%. That gain, if realized, would propel the 12-month growth rate of the SPCLCS barometer to 6% from 4.9% in October.
Conference Board Consumer Confidence: The upbeat canvass from the University of Michigan suggests that this gauge soared to a 2½-year high of 119.5 in January from 110.7 in the prior month.
JOLTS Job Openings: A reported dip in online help-wanted postings suggests that nationwide job openings declined by 40K to 8.75mn – the fewest vacant positions since the 8.4mn posted in March 2021. At an estimated 2.48mn, the excess of vacant positions nationwide would represent 1.4 jobs per unemployed person.
Construction Spending: Expected to have risen by .6% in December, thereby boosting the cumulative increase over the course of last year to 12%, besting the 4.9% gain recorded in 2022.
ISM Manufacturing Index: The manufacturing downturn likely marked its 16th month in January, with the ISM’s Purchasing Managers Index remaining near the 47.2% reading recorded in December.
Unit Motor Vehicle Sales: Expected to clock in at a seasonally adjusted annual rate of 15.65mn in January, down from 15.83mn in December but a touch above Q4’s 15.55mn pace.
Employment Situation Report: Labor market conditions probably remained tight at the beginning of 2024. Nonagricultural businesses likely added 225K net new workers in January, marginally eclipsing the 216K gain witnessed in December. Weekly jobless claims reports and consumer-sentiment soundings hint that the civilian unemployment rate may have dipped to a six-month low of 3.6% from 3.7% in the preceding month. With the establishment survey period terminating before the 15th of the month, average hourly earnings probably edged just .2% higher during the reference period after the surprisingly large .4% prior-month gain. If realized, that result would place nominal compensation 4% above the $33.02 per hour received at the beginning of 2023. The January report will include annual benchmark revisions of the establishment survey series on payrolls, earnings, and hours. Seasonally adjusted data from January 2019 forward will be subject to alteration.
Federal Reserve Appearances:
Jan. 31 Federal Open Market Committee monetary policy decision.
Jan. 31 Federal Reserve Chair Powell to hold post-FOMC meeting press conference.
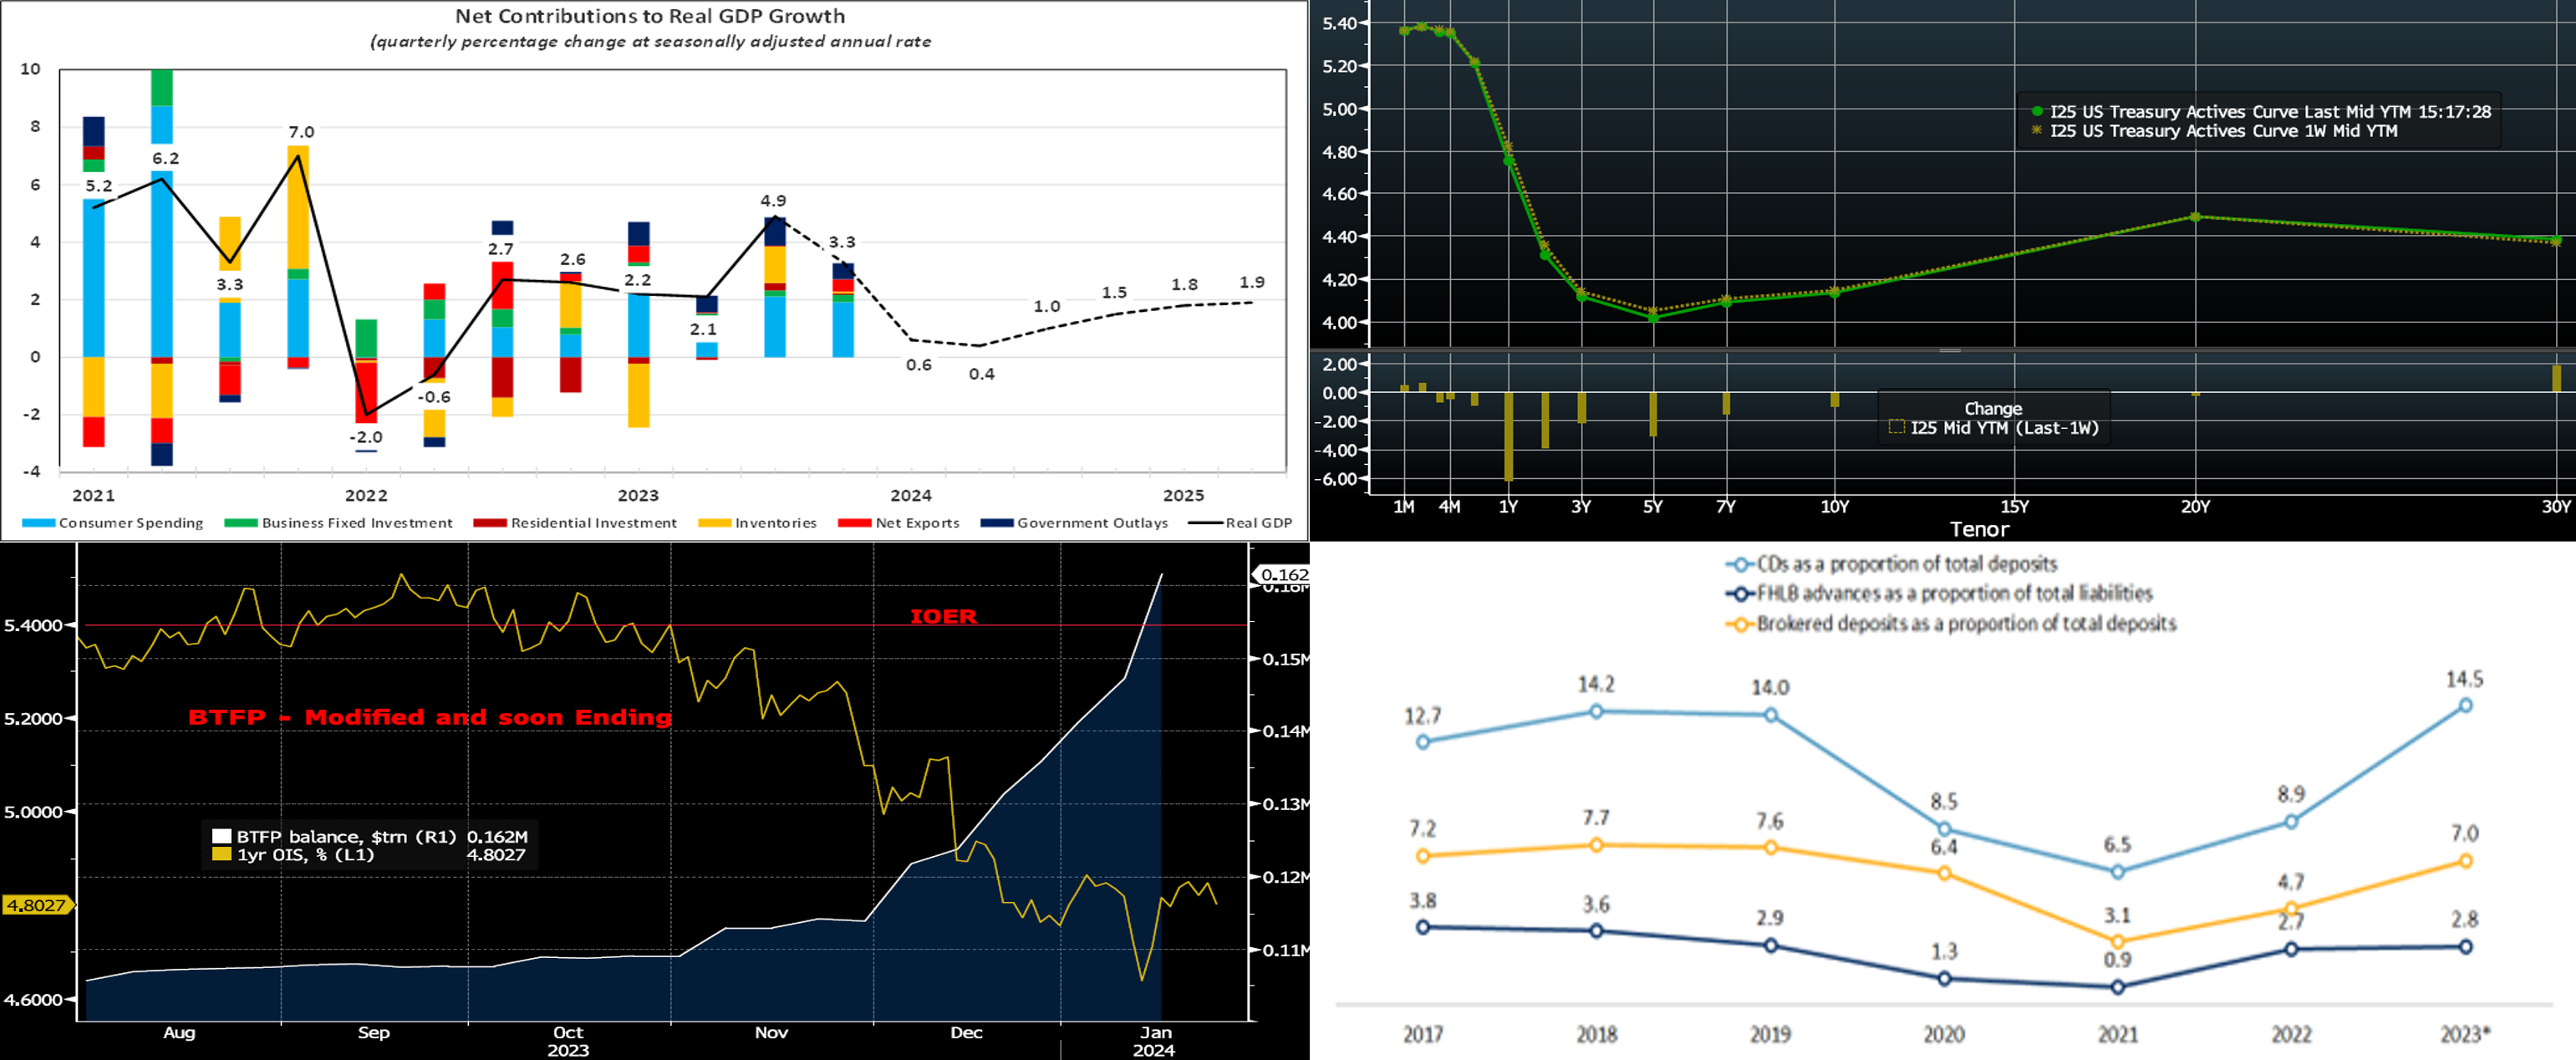
CHART 1 UPPER LEFT
Source: Bloomberg; Bureau of Economic Analysis (BEA); FHLB-NY. The BEA reported that real GDP expanded at an annual rate of 3.3% during Q4 2023. While down from the breakneck 4.9% annualized clip witnessed during the summer, the advance estimate eclipsed all available forecasts by a wide margin and marked the sixth consecutive quarter of above-trend – i.e., greater than 1.8% — growth. All segments of the economy made positive contributions. Excluding inventory building over the October-December span, real final sales grew by 3.2% annualized, almost matching the prior quarter’s 3.6% pace. Further reversing the signs on exports and imports, real final sales to domestic purchasers, i.e., real domestic demand, rose by 2.7% annualized, following a 3.5% increase in Q3. Inflation soundings were positive. The overall GDP price index rose by just 1.5% in Q4, less than half the 3.3% increase recorded in Q3 and well below the 2.2% anticipated by the consensus. Looking ahead, available projections anticipate a marked deceleration in real GDP growth during the first half of this year, with a gradual return to trend by the winter of 2025.
CHART 2 UPPER RIGHT
Source: Bloomberg. Top pane is yield (LHS, %), bottom pane is change (LHS, bps). From last Thursday afternoon to this one, the UST curve was minimally changed, with the 10-year-and-under sector a few bps lower. While Thursday’s GDP came in stronger than expected, the tamer inflation readings in the report prodded yields to retrace lower from levels of days prior. In addition to the FOMC meeting, the upcoming week serves a few other potentially impactful events, namely Wednesday’s UST refunding announcement and Friday’s jobs report. In terms of market-implied pricing of the Fed, the chance of a 25p cut in March is ~48%, down slightly from ~54% last week. The year-end 2024 forward is ~3.935%, roughly the same as last week.
CHART 3 LOWER LEFT
Source: Bloomberg. The Fed took definitive action this week on its Bank Term Funding Program (BTFP), a special program introduced last March to help address funding stresses in the banking system. While adding stability to the system, the mechanics of the program have led to some perhaps unintended effects. The program’s rate had been based on market 1-year OIS. But, owing to the market pricing rate cuts into the curve, this rate has moved well below other short-term rates. Moreover, BTFP-users owned a free option, namely the ability to prepay at any time without a fee. As seen here, BTFP usage (RHS, $trn) increased notably in the last three months to currently stand at ~$162bn as of January 18th and will surely be higher when this past week’s fresh balance is released. The Fed, on Wednesday evening, addressed this pricing inconsistency and provided guidance on the program. The rate applicable to new BTFP loans has been adjusted such that the rate on new loans extended from now through program expiration will be no lower than the interest rate on reserve balances (IOER) in effect on the day of the loan. The program will also terminate for new loans on March 11. As a reminder, always compare our FHLB-NY to alternatives using our dividend-adjusted or “All-in” rate; please contact the Member Services Desk for our “All-in” Pricing tool.
CHART 4 LOWER RIGHT
Source: S&P Global Intelligence. Shown here is the term funding concentration for the US banking industry since 2017. Data is through Q3 2023, so it may have shifted somewhat since then. But it nonetheless encapsulates the typical 2023 funding and liquidity story for banks that has been revealed in earnings reports. Both CD’s and brokered deposits have grown notably as a proportion of total deposits. Meanwhile, FHLB advances, as a proportion of total liabilities, have also grown. These higher-cost dynamics, in turn, have led to net interest margin and income challenges. These trends are unlikely to reverse in a big way until the Fed is well into an easing cycle. For perspective, however, we can see here that the funding types have essentially reverted to the levels of pre-pandemic years.
FHLBNY Advance Rates Observations
Front-End Rates
- Short-end rates were relatively unchanged week-over-week. Net T-bill supply remains positive, given announcements from the Treasury regarding upsized auctions and issuance needs. But the supply continues to be absorbed well as Money Market Funds (MMFs) switch from the Fed’s RRP to T-bills with competitive yields. Moreover, MMFs currently stand at or near all-time high AUM levels.
- The key event of the upcoming week will be Wednesday’s FOMC result.
Term Rates
- The longer-term curve, generally mirroring moves in USTs and swaps, moved modestly lower by a few bps. Please refer to the previous section for color.
- On the UST term supply front, the upcoming week serves as a reprieve from auctions. Note that UST auctions usually occur at 1pm and can occasionally cause volatility around that time. The recent heavy January corporate bond issuance calendar should slow directly ahead of the FOMC outcome. Please contact the Member Services Desk for further information on market dynamics, rate levels, or products.
Price Incentives for Advances Executed Before Noon: In effect as of Tuesday, September 5, 2023, the FHLBNY is pleased to now offer price incentives for advances executed before Noon each business day. These pricing incentives offer an opportunity to provide economic value to our members, while improving cash and liquidity management for the FHLBNY. For further details, kindly refer to the Bulletin.
The Symmetrical Prepayment Advance Feature
For those anticipating term funding needs, and with rates on an uptrend, it can be an appropriate juncture to consider our SPA feature. This feature allows the member to capture, at prepayment, changes in the fair value of the advance which are favorable to the member. Contact Member Services Desk to discuss.
Looking for more information on the above topics? We’d love to speak with you!
Questions?
If you wish to receive the MSD Weekly Market Update in .pdf format (includes FHLBNY rate charts) or to discuss this content further, please email the MSD Team.