Member Services Desk
Weekly Market Update
This MSD Weekly Market Update reflects information for the week ending September 8, 2023.
Economist Views
Click to expand the below image.
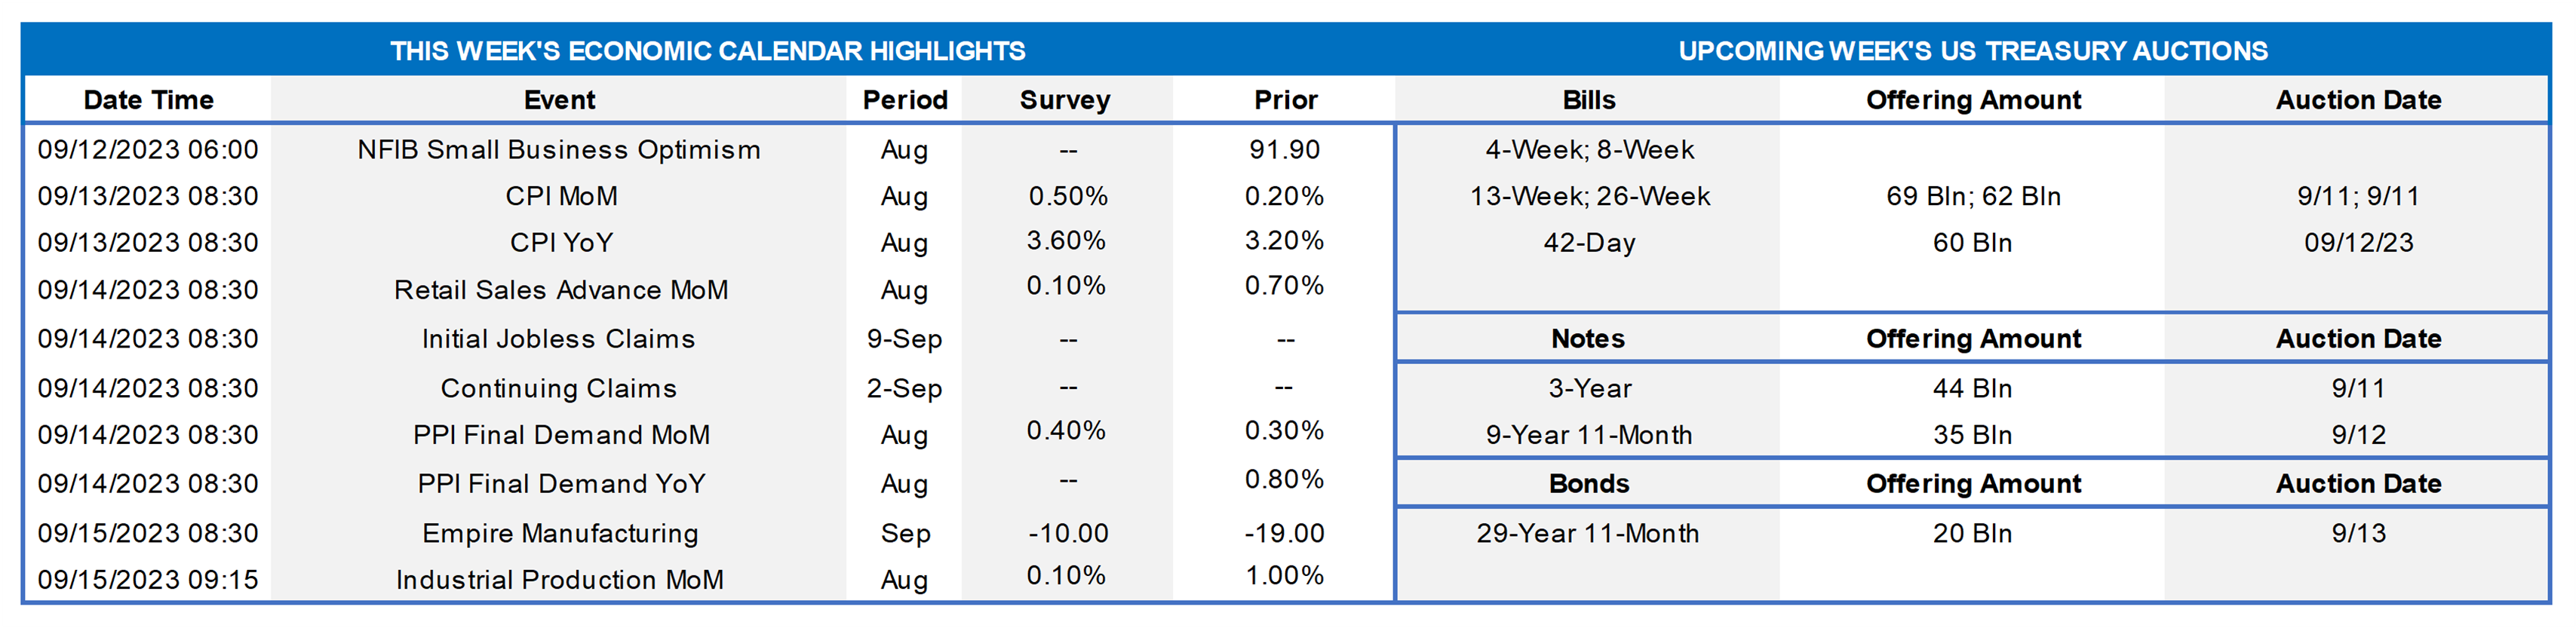
With Federal Reserve officials observing the traditional blackout period ahead of the September 19-20 FOMC meeting, market focus will be on the data calendar this week. August updates on consumer prices likely will be mixed. A nearly 12% pop in seasonally adjusted gas prices likely fueled the largest increase in the Consumer Price Index (CPI) since January, yet ongoing declines in used auto costs hint at the potential for a below-consensus uptick in the core subindex excluding volatile food and energy components last month. Retail sales figures for August will allow economists to refine their projections for consumer goods purchases during the summer. Reflecting ongoing upside surprises in input-data reports, projections for Q3 real GDP growth have been increasing. While the median Street forecast calls for a 2% annualized advance, the range of projections remains wide. Of note, the FRB Atlanta’s tracking estimate, which accurately predicted the Bureau of Economic Analysis’ advance estimates for Q1 and Q2, stands at a whopping 5.6% annualized, roughly triple what is considered trend growth for the U.S. economy.
NFIB Small Business Optimism Index: Echoing reported improvements in other surveys, this sentiment gauge likely climbed to a 15-month high of 93 in August from 91.9 in the preceding month.
Consumer Prices: Powered by a seasonally adjusted surge in gas prices, the CPI likely jumped by .5% in August, following a pair of .2% upticks in June and July. Excluding volatile food and energy costs, the core CPI is expected to have risen .2% for a third straight month. Those projections, if realized, would place the overall and core CPIs 3.6% and 4.3% above their respective year-ago levels.
Retail & Food Services Sales: Retail and food services sales probably took a breather in August, edging just .2% higher after the .7% gain posted in July. Excluding an anticipated pullback in auto-dealer revenues, retail purchases are expected to have climbed by .4% during the reference period, following a 1% prior-month jump. As always, market participants pay attention to so-called “control” sales excluding auto, building materials and gasoline purchases in this week’s report for clues to the pace of consumer spending during Q3. Barring any prior-month revisions, the .2% decline in control projected by the Street would still leave core purchases 5.7% annualized above their April-June average, following a comparatively modest 2.3% annualized spring-quarter gain.
Jobless Claims: Initial claims for unemployment benefits likely returned to a 230K-250K range during the filing period ended September 9, following the seven-month low of 216K posted in the prior week. Keep an eye on continuing claims for signs that furloughed employees may be having a more challenging time finding work.
Producer Prices: Producer prices are expected to have risen by .4% last month, after a .3% increase in July.
Empire State Manufacturing Survey: Manufacturing activity in New York State likely contracted in early September, although the gap between respondents experiencing a pickup less those witnessing a decline probably improved from the prior month’s -19% result.
Industrial Production & Capacity Utilization: Capped by a projected slowdown in nationwide factory output, industrial production probably edged .2% higher in August, following the surprising 1% jump posted in July. With additions to productive capacity expected to match those of output during the reference period, the overall operating rate likely held steady at 79.3%.
University of Michigan Sentiment Index: Consumers’ appraisals of current and prospective economic conditions probably deteriorated in early September, leaving this confidence gauge at a three-month low of 68.
Federal Reserve Appearances: Federal Reserve officials to observe the blackout period on public appearances ahead of the September 20 FOMC meeting.
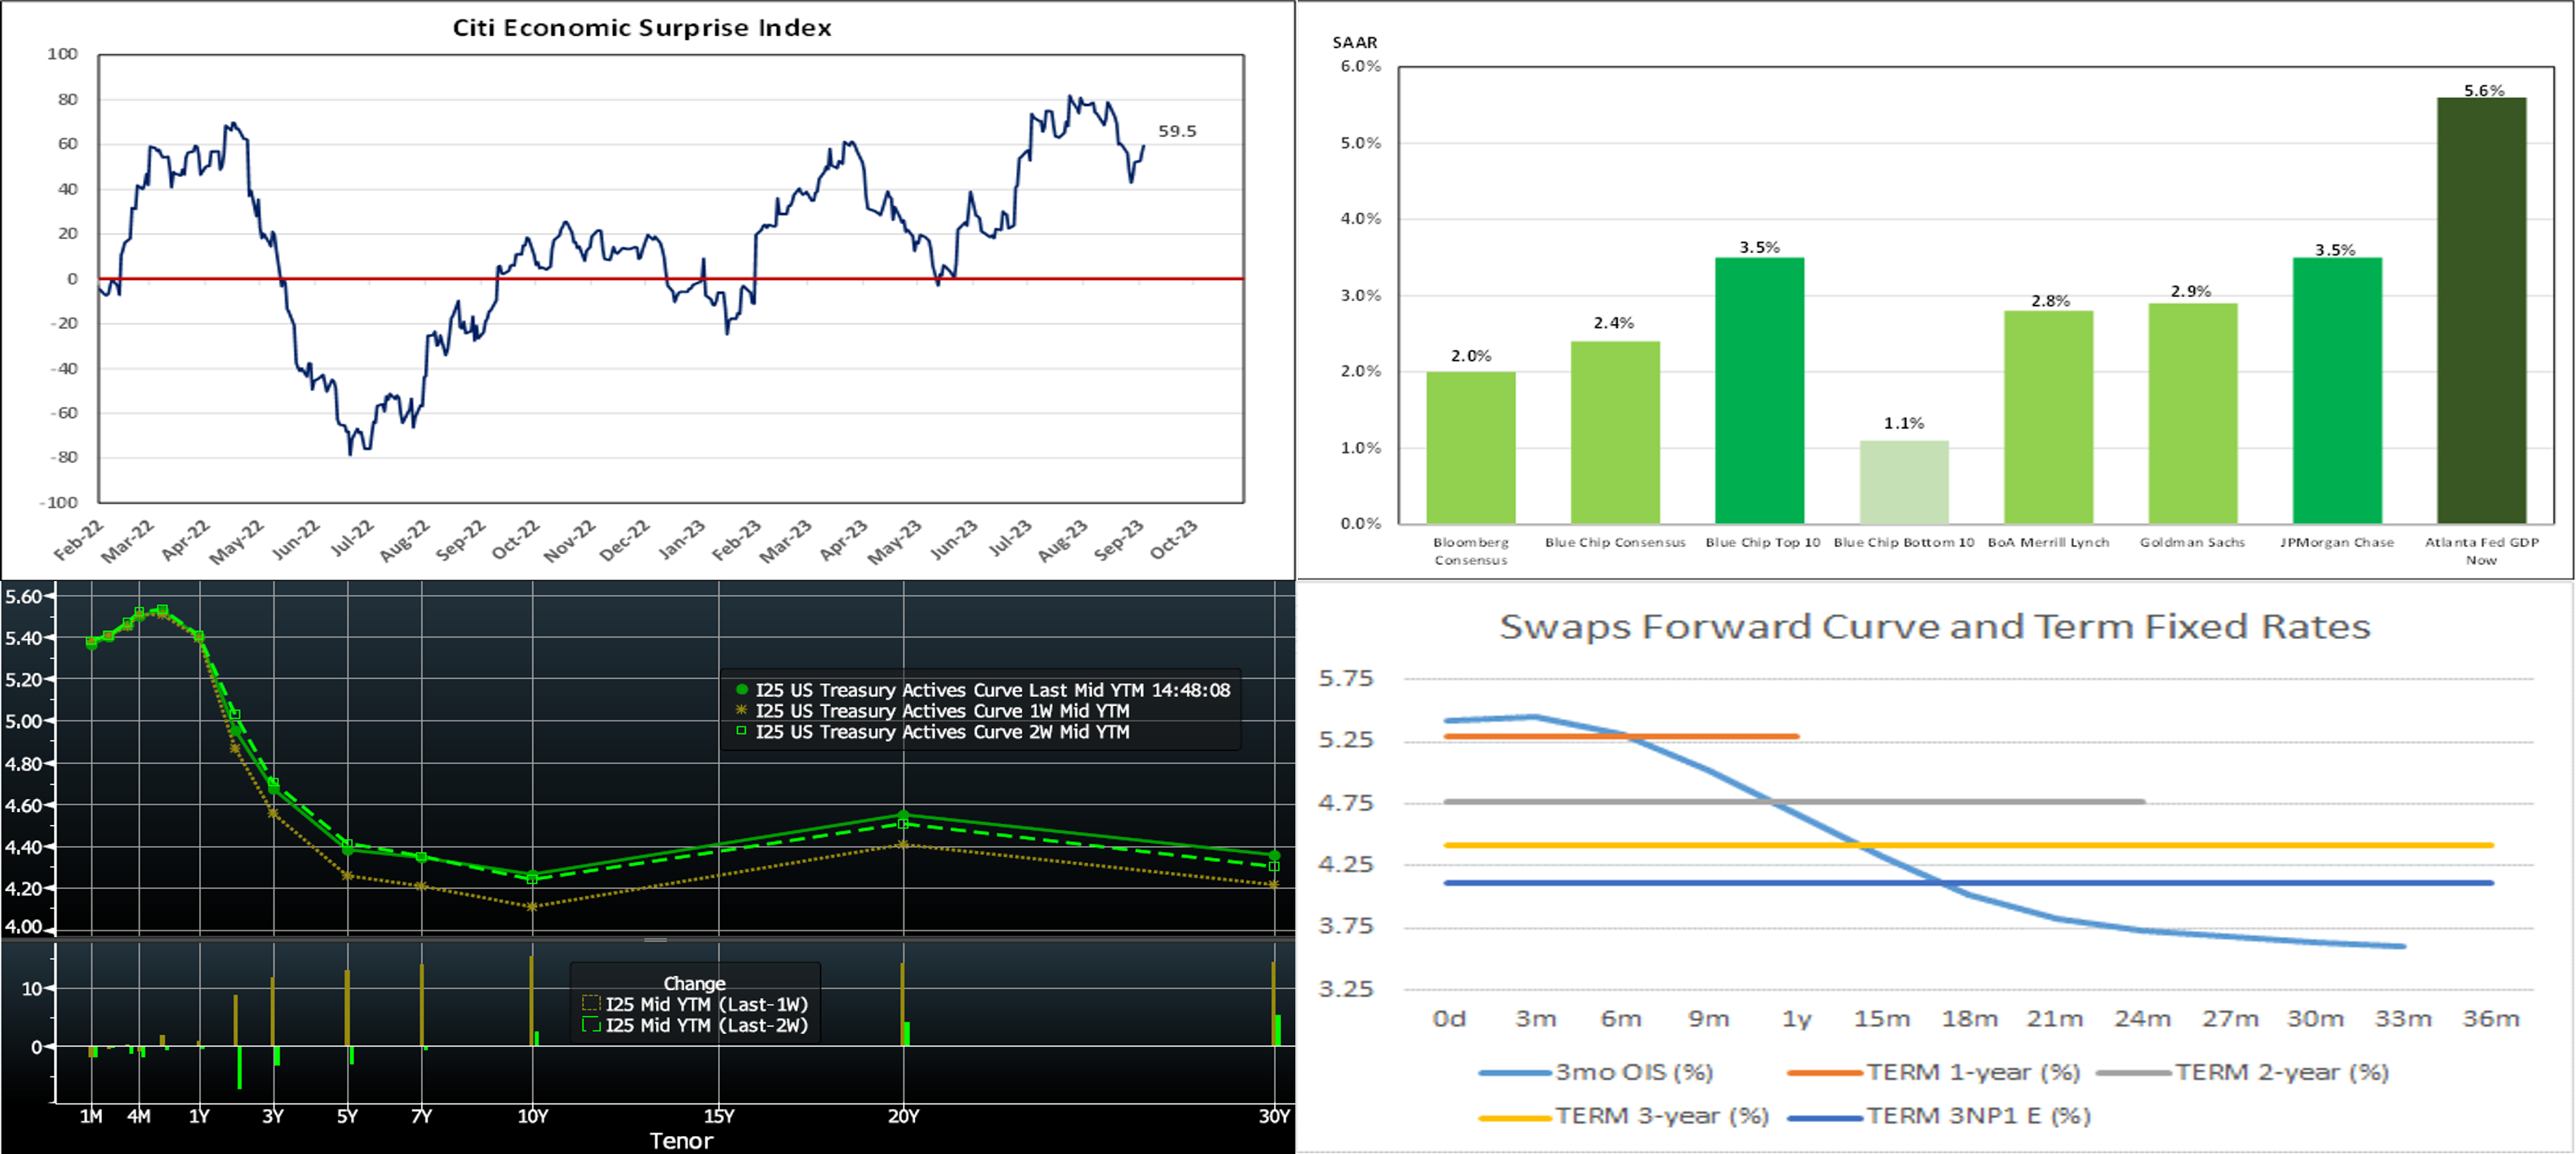
CHART 1 UPPER LEFT AND CHART 2 UPPER RIGHT
Source: Bloomberg; Blue Chip Financial Forecasts; FHLB-NY. Notes: The Citi Economic Surprise Index measures data surprises relative to consensus market expectations; a positive reading means that data releases have been stronger than expected, and a negative reading signifies data have been weaker than expected. High-frequency economic soundings have been considerably better than market expectations over the course of the summer, prompting economists to boost their projections for Q3 real GDP growth, per the upper right-side chart. While median forecasts expect the pace of current-quarter activity to register near the 2% annualized clip witnessed over the first half of the year, the range of projections remains quite wide. Of particular note, the Federal Reserve Bank of Atlanta’s GDPNow tracking estimate, which accurately anticipated the Bureau of Economic Analysis’ advance estimates for both Q1 and Q2, currently calls for a steamy 5.6% annualized gain, triple what is considered trend growth for the U.S.
CHART 3 LOWER LEFT
Source: Bloomberg. Top pane is yield (LHS, %), bottom pane is change (LHS, bps). From our last edition two Thursday afternoons ago to this one, the UST curve, adjusted for the new on-the-run notes, is modestly changed. After declining last week, yields rebounded higher in the past week nearer to but below the multi-year highs reached in early August. Economic data, per above, generally has been better than expected, thereby underpinning rates. In terms of market-implied pricing of the Fed, the 2023 peak Fed Funds rate in November now stands at ~5.465%. Essentially, the market is pricing ~54% chance of another 25 bp hike this year. The year-end forward is ~5.452%, roughly the same as two weeks ago. The years 2024 and 2025 edged a tad higher from two week ago, with the year-end 2024 forward ~2 bps higher, at 4.33%. Please call the desk for further information on market dynamics and/or products.
CHART 4 LOWER RIGHT
Source: FHLB-NY. Here, we take a look at the current forwards curve and term rates. Shown is the 3-month OIS forwards curve (inverted light blue line) as well as SOFR-swap fixed rates (horizontal lines, Quarterly Act/360) for 1 to 3-year tenors. All levels herein are indicative and for illustrative/discussion purposes. With uncertainty on the Fed nearing the end of its hiking path and any potential turn in the rate cycle, we are at an interesting point in time. Some institutions may find that their ALM modeling still reflects a liability sensitive position (greater risk to higher rates), but hesitancy to hedge and/or extend liability duration could arise because of this uncertainty. Given the above color on GDP projections, it is plausible that the Fed, even if they do not hike again, could remain on hold for a protracted period. As seen here in the forwards, the market still prices for Fed cuts in the two years ahead. In this respect, there can still be value in term-fixed rate, assuming these cuts do not come to fruition or are delayed. If one is flexible on the maturity of a term-fixed hedge and would like to save on current interest costs, an idea to consider could be a putable (selling the right to have the trade canceled) term trade; the lower rate of the putable swap is shown in the chart (navy blue, 3-year No-Put 1-year European one-time right to cancel). Note that the putable trade can be canceled at year-1, thereby leaving potential rate risk at that point in time. As a reminder, FHLB-NY offers putable advances and can provide various structures to those with interest to explore further. Please call the desk to learn more.
FHLBNY Advance Rates Observations
Front-End Rates
- Short-end rates were relatively sedate and modestly changed from two weeks ago, mostly moving lower by 1 to 3 bps on account of and using our new pre-noon incentive pricing rates (see below note for further information). Net T-bill supply remains robust, given the recent announcements from Treasury regarding upsized auctions and issuance needs. But the supply continues to be absorbed well, as Money Market Funds (MMFs) switch from the Fed’s RRP to T-bills with competitive yields. Moreover, FHLB supply has subsided from peak levels of spring, further assisting T-bill interest from investors and thereby containing any severe upward pressure on rates from T-bill supply. MMFs currently stand at all-time high AUM levels.
- With the Fed in blackout mode, economic data, especially Wednesday’s CPI release, should drive direction this upcoming week.
Term Rates
- The longer-term curve, generally mirroring the moves in USTs and swaps, was modestly changed from two weeks ago, with tenors 5-year-and-in lower by 3 to 6 bps. The advance curve remains inverted out to 5-year, thereby offering opportunities to extend in advance duration at lower coupon cost. Kindly refer to the previous section for relevant market color.
- On the UST term supply front, the upcoming week serves 3/10/30-year auctions early in the week. Note that UST auctions usually occur at 1 p.m. and can cause volatility near that time. Please contact the desk for further information on market dynamics, rate levels, or products.
Price Incentives for Advances Executed Before Noon – In effect as of Tuesday, September 5, 2023 – The FHLB-NY is pleased to now offer price incentives for advances executed before Noon each business day. These pricing incentives offer an opportunity to provide economic value to our Members, while improving cash and liquidity management for the FHLBNY. For further details, kindly refer to the bulletin.
Forward Start Advance (FSA): For members with upcoming borrowing or refunding plans, consider the FSA as a method to opportunistically “lock in” rates before advance settlement date. Please contact the Member Services Desk at (212) 441-6600 for more information.
The Symmetrical Prepayment Advance Feature
For those anticipating term funding needs, and with rates on an uptrend, it can be an appropriate juncture to consider our SPA feature. This feature allows the member to capture, at prepayment, changes in the fair value of the advance which are favorable to the member. Contact Member Services Desk to discuss.
Looking for more information on the above topics? We’d love to speak with you!
Questions?
If you wish to receive the MSD Weekly Market Update in .pdf format (includes FHLBNY rate charts) or to discuss this content further, please email the MSD Team.