Member Services Desk
Weekly Market Update
This MSD Weekly Market Update reflects information for the week of August 15, 2022.
Economist Views
Click to expand the below image.
Having weathered the employment and consumer price reports for July, the attentions of market participants will turn to key data inputs into Q3 real GDP growth projections. While the Street is currently calling for a 1.7% annualized rise in inflation-adjusted economic activity during the summer quarter, the tracking model produced by the Federal Reserve Bank of Atlanta is estimating an even-stronger 2.5% gain, after the modest .9% contraction witnessed in Q2. With only two district bank presidents making public appearances, the Fed-speak calendar will be light. The minutes of the July 26-27 FOMC, to be released on the 17th, will be watched closely for clues to policymakers’ thoughts on the prospective pace of federal funds rate increases over the remainder of the year.
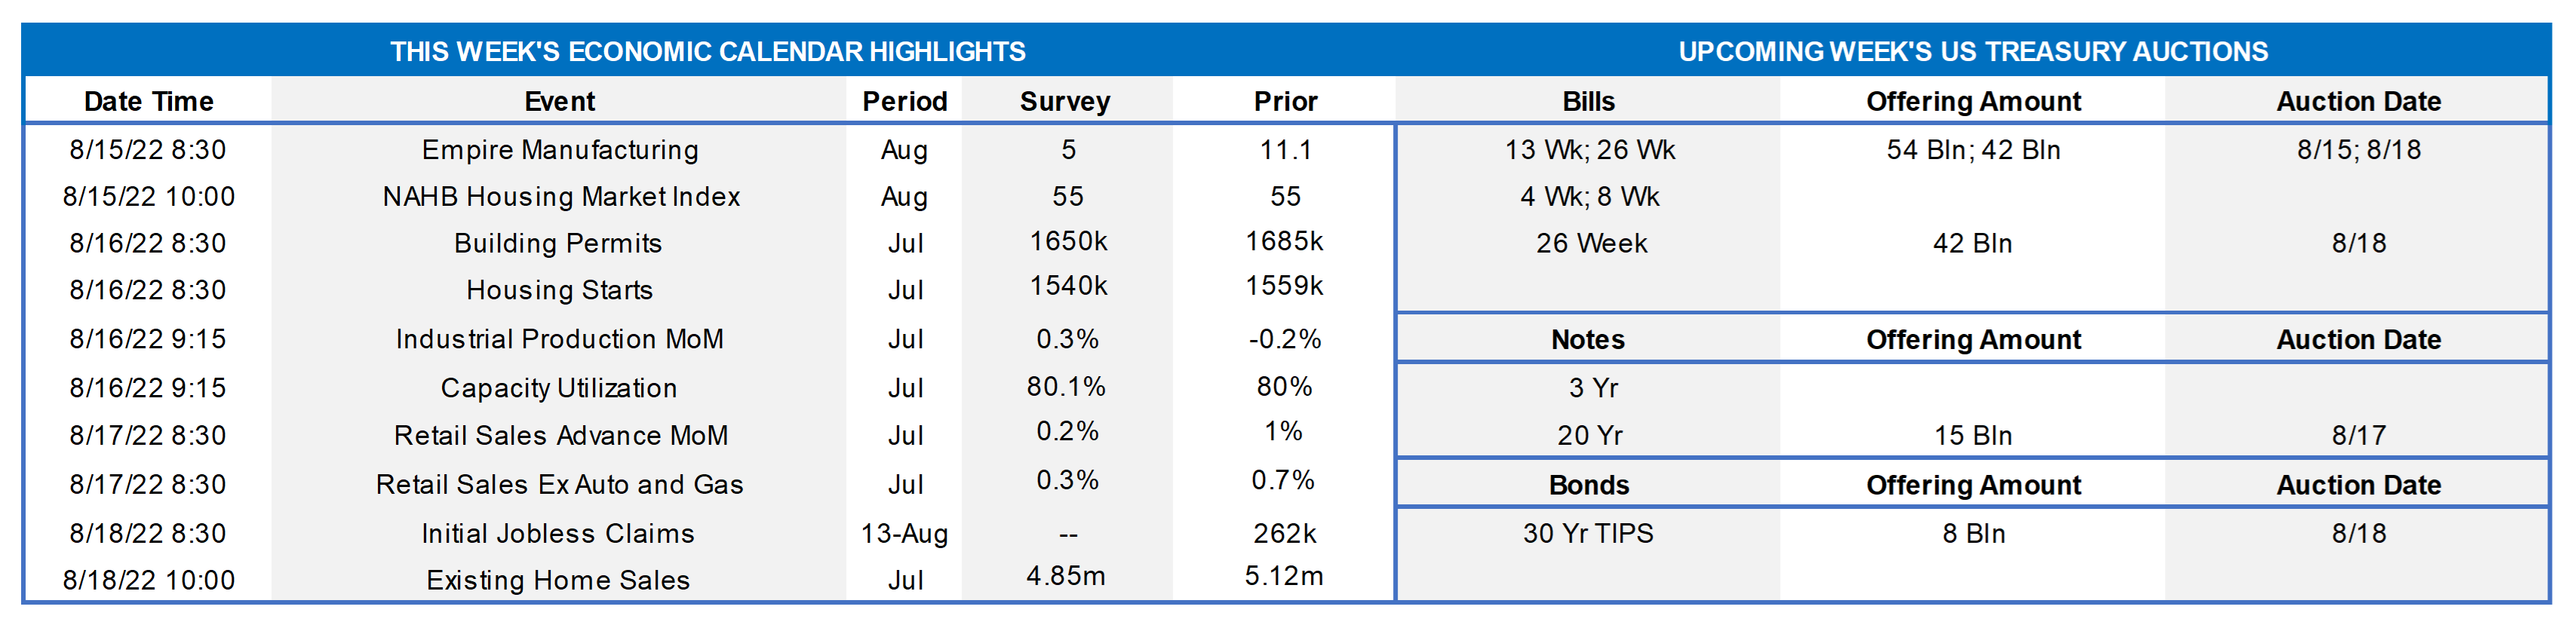
Empire State Manufacturing Index: Manufacturing activity in New York State probably expanded further in August, albeit at a slower clip than in July. The net percentage of firms experiencing an improvement in general business conditions is expected to decline to 5% from 11.1% in the preceding month.
NAHB Housing Market Index: Demand and supply-side challenges probably continued to weigh on home-builder sentiment in August. The Street expects the NAHB Housing Market Index to dip by one point to 54 – the lowest reading since the 37 posted in May 2020. However, press reports of widespread home-purchase cancellations hint that a move below the critical 50-point mark could be in store.
Housing Starts & Building Permits: Residential building activity likely ebbed in response to weaker demand during July. The consensus expects groundbreakings to decline by 1.9% to a 15-month low seasonally adjusted annual rate of 1.53mn and new permits issued to slide by 3.3% to a seasonally adjusted annual rate of 1.64mn – the lowest tally since last September.
Industrial Production & Capacity Utilization: Powered by a projected rebound in factory output, industrial production probably edged .2% higher last month, erasing the surprising dip recorded in June. With output expected to marginally eclipse additions to productive capacity during the reference period, the overall operating rate likely edged one tick higher to 80.1%.
Retail & Food Services Sales: Buoyed by an expected rise in motor vehicle purchases, retail and food services sales likely edged .2% higher in July, after a 1% prior-month jump. Net of a projected 1.1% increase in auto-dealership revenues, retail sales are expected to have remained unchanged, following a 1% gain in June. As always, market participants will pay particular attention to so-called control sales excluding auto, building materials and gasoline purchases. Barring any prior-month revisions, the .3% increase anticipated by the Street would leave core purchases during the reference period 2.9% annualized above their April-June average, after a 3.9% annualized spring-quarter advance.
Jobless Claims: Initial claims for unemployment insurance benefits likely remained in the recent 235-265K range during the period ended August 12. Pay particular attention to continuing claims under regular state programs for signs that recently laid off employees may be encountering more difficulty in finding work.
Existing Home Sales: The falloff in home-purchase contract signings over the May-June span suggests that closings dropped by 4.4% to a two-year low seasonally adjusted annual rate of 4.89mn in July. With the number of homes on the market expected to rise by an estimated 2.3% to 1.29mn during the reference period, the stock of available dwellings likely posted at 3.2 months’ supply.
Federal Reserve Appearances:
- Aug. 17 Minutes of July 26-27 Federal Open Market Committee to be released.
- Aug. 18 Kansas City Fed President George to speak on the economic outlook at an event in Independence, Missouri.
- Aug. 18 Minneapolis Fed President Kashkari to take part in a Q&A session with local Young Presidents Organization chapter.
Click to expand the below image.
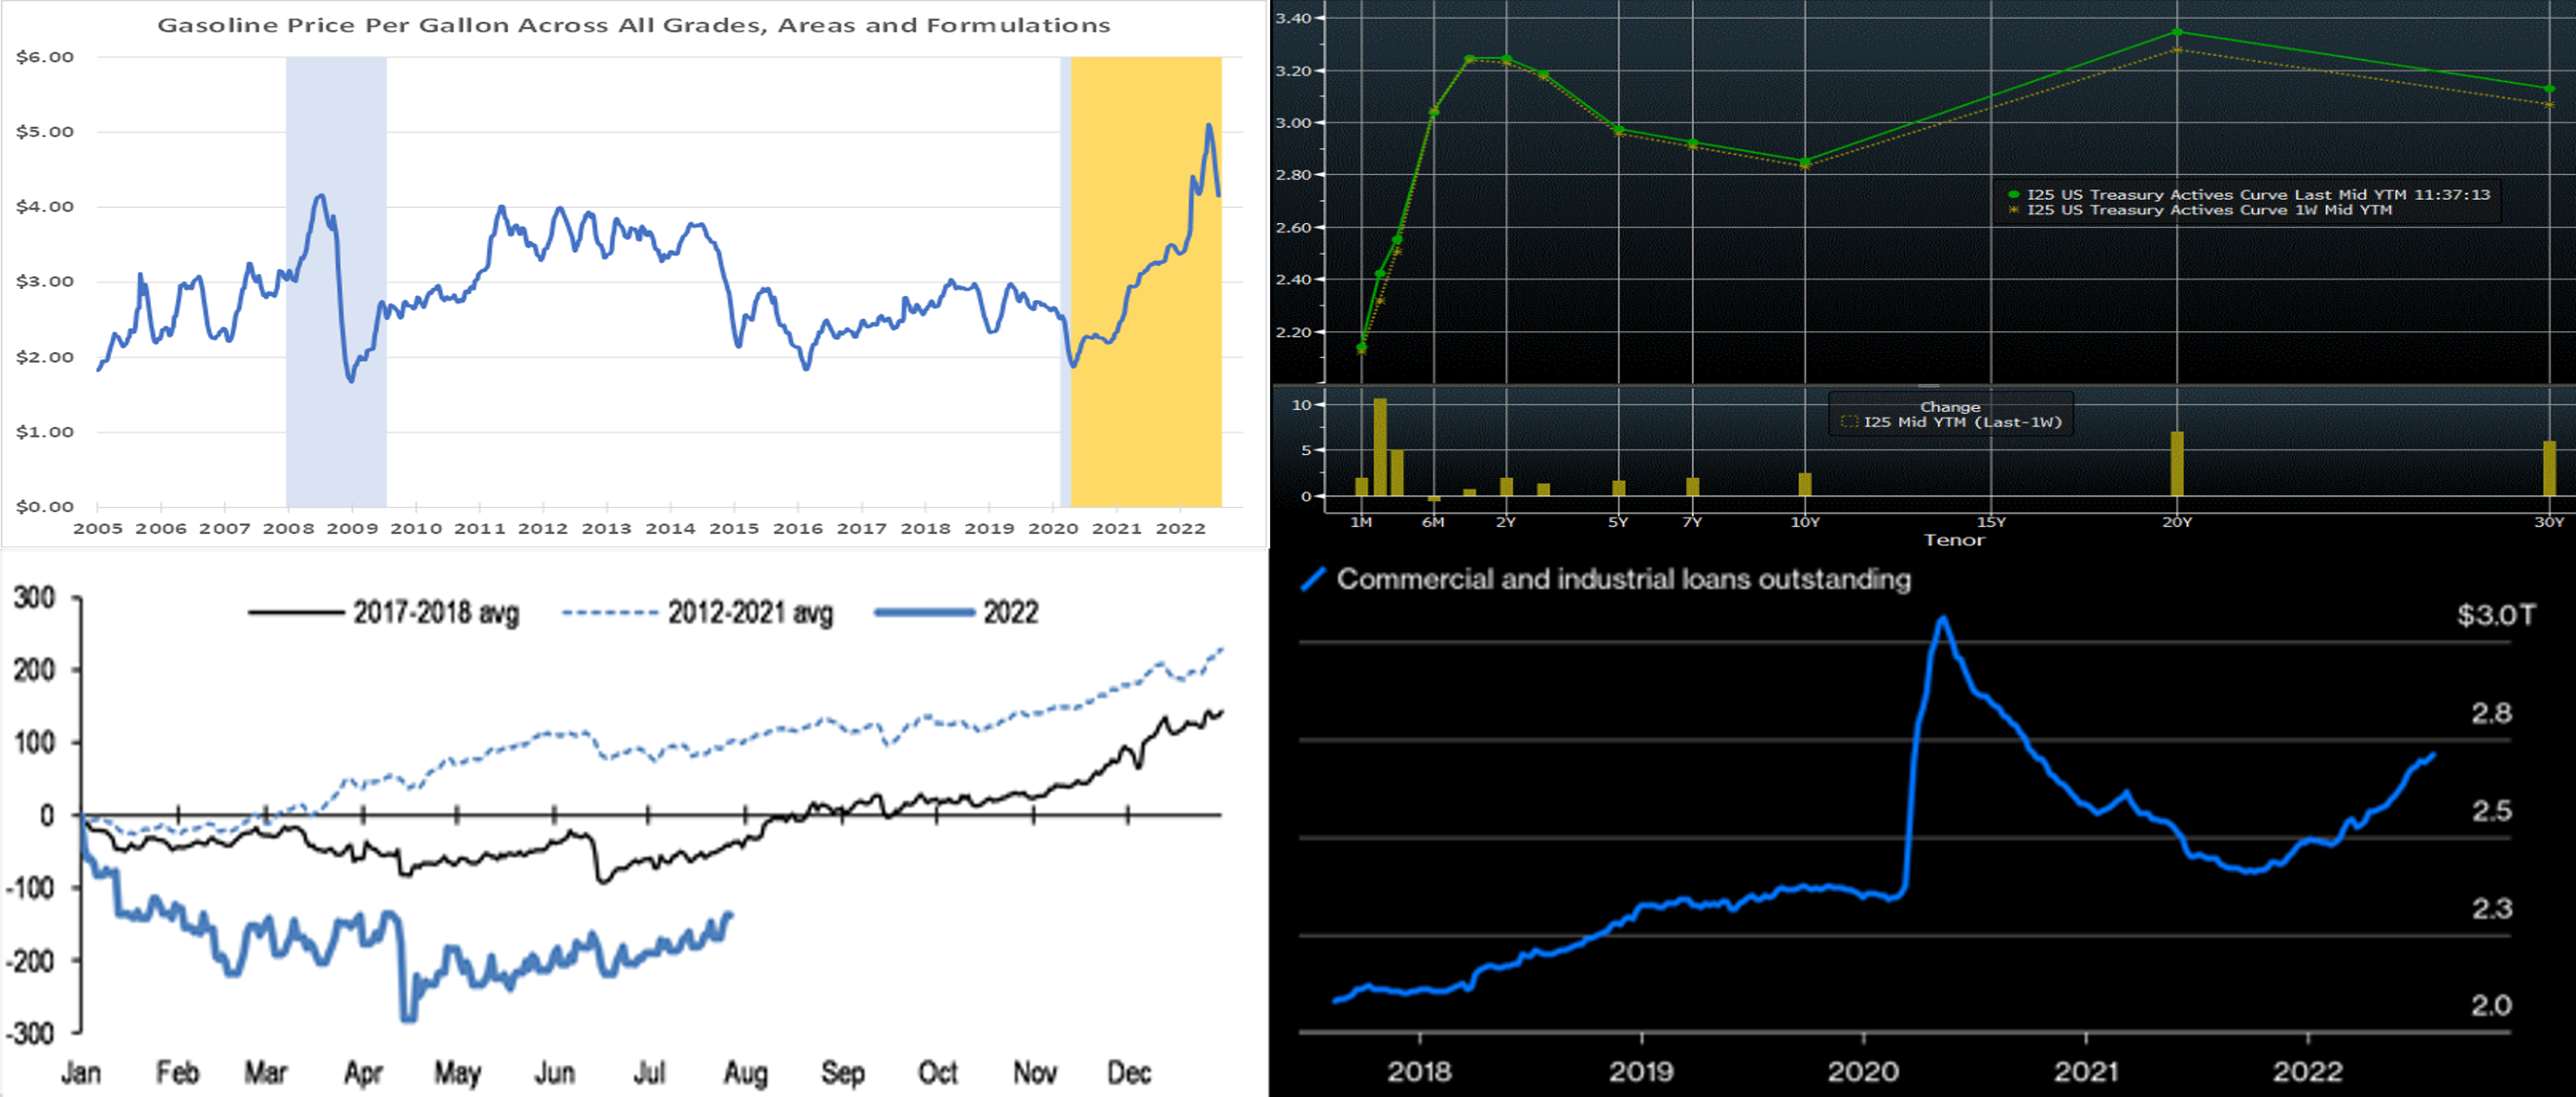
CHART 1 UPPER LEFT
Source: U.S. Energy Information Administration; National Bureau of Economic Research; FHLBNY. Notes: Light blue areas denote recessions; light orange area highlights current economic expansion. Lower energy costs capped the rise of the Consumer Price Index (CPI) in July. Data released by the U.S.E.I.A. point to further significant relief on headline inflation in the August report. As of the period ended August 8, the average price of gasoline across all grades, regions, and formulations already stands 8.3% below the July average after seasonal adjustment. Given gasoline’s 5.2% relative importance in the CPI, reductions to date will pare .43 percentage point off the headline measure in next month’s report.
CHART 2 UPPER RIGHT
Source: Bloomberg. Note: Top pane is yield (%), bottom pane is change (bps). The UST curve mildly “bear steepened” week-over-week. As of midday Friday, 2 to 10-year yields were a few bps higher, while the very long end increased by ~6-7 bps; a new 30-year bond auction this past week contributed to the upward move in the long sector. The 1-year-and-under zone was generally little changed from the week prior (note that the upward changes in the 2 to 3-month sector of the chart are mostly owing to new T-bill references which mature further past the next FOMC’s expected rate hike). The past week’s inflation data (CPI and PPI) were lower than market consensus. While this news initially prompted a move lower in rates, various Fed speakers offset that sentiment with surprisingly hawkish comments seemingly designed to “push back” against both market expectations of the Fed “stepping off the pedal” in early-2023 and the recent improvement in financial condition measures (higher stock prices, tighter credit spreads). Fed governor Kashkari, for instance, mentioned support for a Fed Funds rate of 3.90% at end-2022 and 4.40% for end-2023. The former is ~40 bps higher than current market pricing, and the latter is ~75 bps higher than the market’s current “high-point” for spring of next year! Please contact the desk for further information and color.
CHART 3 LOWER LEFT
Source: Crane Data; JP Morgan. Shown here is the year-to-date cumulative change in taxable Money Market Fund (MMF) assets under management (AUM, LHS, $bn). As is evident, there is a seasonal tendency for AUM to rise in the second half of the year. Why is this relevant? It may have some impact on short term rates, at least in terms of boosting demand and helping offset the now increasing net issuance of T-bills. But, perhaps more importantly, MMFs may experience more inflows at the expense of bank deposit levels. Resulting from the Fed hikes of this year and now higher investment yields, MMFs are now able to both “pass along” higher rates to investors and earn management fees. While bank deposit “betas” to Fed hikes have remained relatively low, perhaps this dynamic will be challenged in the months ahead. This will especially be the case if markets are volatile, Fed hikes persist, and investors steer funds to the relative safety of short-term maturities.
CHART 4 LOWER RIGHT
Source: Bloomberg. Last week we noted that the July 2022 Senior Loan Officer Survey revealed stronger demand for commercial and industrial (C&I) loans to firms of all sizes over the second quarter. Here can be seen evidence of that trend, as there has been a notable climb higher in C&I loans (RHS, $trn) thus far in 2022. To reiterate, given the decline in mortgage activity in recent months, the boost in C&I loan demand is surely a welcome development and bolsters the case that the economy is not currently in recessionary mode.
FHLBNY Advance Rates Observations
Front-End Rates
- Short-end Advance rates finished mixed to lower week-on-week. While 1-month-and-in rates dipped 4-5 bps, 3-month was unchanged and 4 to 6-month terms were a few bps lower. Volatility in short-end markets has tempered in recent weeks, but the chance remains of dynamic moves both day-to-day and intraday, a situation likely to persist while the Fed embraces a “data-dependent” posture regarding rate hikes. As of this past Friday midday, the market priced for a 100% chance of a 50 bps hike at the Sept.21st FOMC, with ~44% chance (down from ~72% last week) of a 75 bps hike. For 2022 cumulatively from here, the market fully prices 100 bps of hikes, with ~74% chance of 125 bps.
- Given the Fed’s tightening and data-dependent posture, rates will remain highly responsive to economic data and Fed-speak.
Term Rates
- The longer-term curve finished a few bps higher and steeper week-over-week, generally mirroring the move in UST and swaps markets. Kindly refer to the previous section for relevant market color. The advance curve is extremely flat overall and inverted out to 5-year, thereby offering opportunities to extend in advance duration for minimal or lower coupon cost.
- On the UST term supply front, this upcoming week carries a 20-year nominal and a 30-year TIPS auction. Market focus will remain on economic data and Fed-speak. Please call the desk for information on market dynamics, rate levels, or products.
Product Alert: FHLBNY is pleased to announce enhancements to our Advance Rebate Program, which provides members an opportunity to receive a cash rebate when prepaying an eligible advance and rebooking a new advance within a 30-day period. Rebate-eligible advances now must have a minimum of 6-months (reduced from 1-year) remaining. Moreover, the potential cash rebate has been increased. This program can be suitable for those wishing to extend their liability duration and/or potentially improve net interest margin. Please call the Member Service Desk at (212) 441-6600 for more information.
Forward Start Advance (FSA): For members with upcoming borrowing or refunding plans, consider the FSA as a method to opportunistically “lock in” rates before advance settlement date. Please call the Member Service Desk at (212) 441-6600 for more information.
The Symmetrical Prepayment Advance Feature
With rates at or near multi-year lows, it is a compelling juncture to use the SPA feature on term advances. This feature allows member to capture, at prepayment, changes in the Fair Value of the advance which are favorable to the member. Contact us to discuss.
Looking for more information on the above topics? We’d love to speak with you!
Questions?
If you wish to receive the MSD Weekly Market Update in .pdf format (includes FHLBNY rate charts) or to discuss this content further, please email the MSD Team.