Member Services Desk
Weekly Market Update
This MSD Weekly Market Update reflects information for the week of August 29, 2022.
Economist Views
Click to expand the below image.
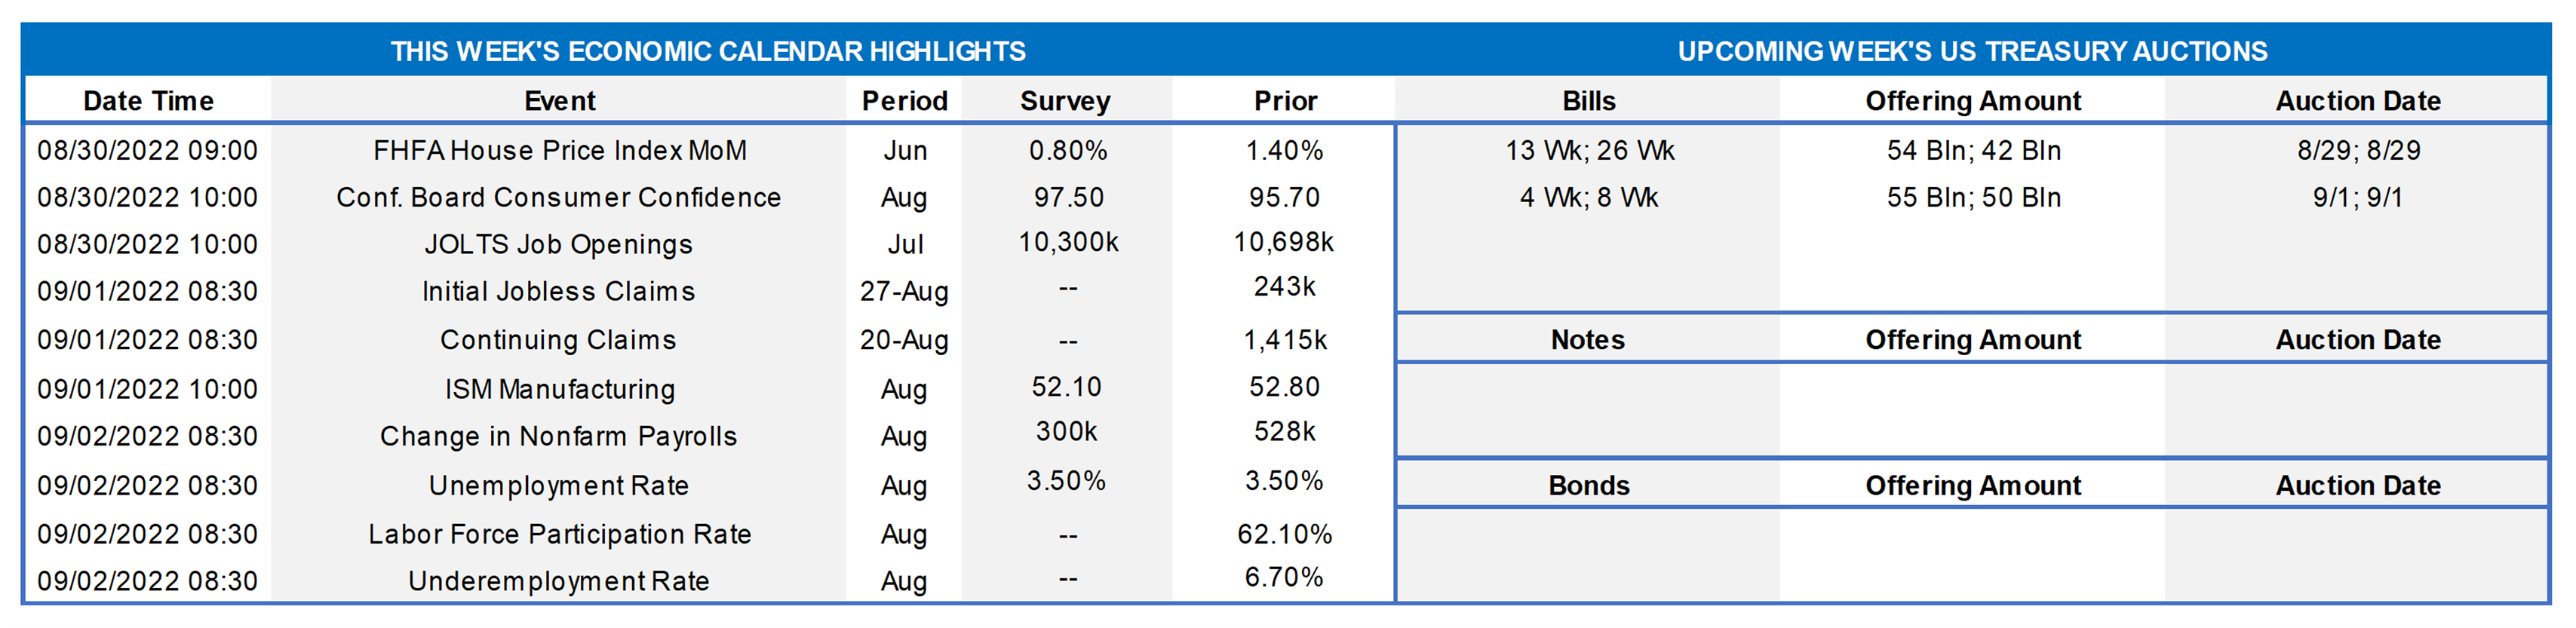
With the FRB Kansas City’s annual monetary policy symposium at Jackson Hole in the rear-view mirror, the attentions of market participants will return to the economic release calendar ahead of the September 20-21 FOMC meeting. Labor-market soundings probably will reveal that the hiring environment remains extremely tight. Consumer sentiment likely rebounded sharply in August. Home prices and manufacturing activity are expected to have slowed from their respective prior-period readings. Looking further out, lower gasoline pump prices, combined with lower used vehicle costs and airline fares, point to further relief on the consumer inflation front in the Bureau of Labor Statistics’ August report. FOMC voters John Williams (New York) and Loretta Mester (Cleveland) will provide their current thinking on the economic outlook and monetary policy.
S&P CoreLogic Case-Shiller (SPCLCS) 20-City Home Price Index: Home prices probably climbed at a slower pace across the twenty major metropolitan areas canvassed by SPCLCS in June. The .8% rise anticipated by the Street, after a 1.3% gain in May, would still place home selling prices a hefty 19.4% above those recorded 12 months earlier.
Conference Board Consumer Confidence: Solid labor market conditions, combined with early signs that the worst of the recent inflation surge might be behind them, probably buoyed consumers’ appraisals of current and prospective economic conditions in August, propelling the Conference Board’s sentiment gauge to a four-month high of 105.5.
JOLTS Job Openings: A reported snapback in online help-wanted postings suggests that total job openings rebounded by 300K to 11mn in July, 855K shy of the 11.9mn all-time high set in March. Given the dip in civilian unemployment last month, that result would leave the gap between available positions and the jobless at 5.3mn. Put another way, there was an estimated 1.9 jobs available per unemployed person in July.
Jobless Claims: Initial claims for unemployment insurance benefits likely remained in the recent 235-255K range during the period ended August 26. Pay particular attention to continuing claims under regular state programs for signs that laid off employees may be having a more difficult experience in finding work.
ISM Manufacturing Index: The nationwide manufacturing expansion likely continued as the summer progressed, albeit at a slower pace than in July. District Federal Reserve Bank canvasses and other surveys hint that the Purchasing Managers Index moved a 2.1 percentage point lower to 50.7% in August – the lowest reading since the pickup began in June 2020.
Employment Situation Report: Recent soundings on initial and continuing jobless claims suggest that payroll employment growth slowed marginally from the 528K net hiring recorded in July. The uptick in the state insured unemployment rate between canvassing periods points to a modest rise in the national jobless rate to 3.6% from the half-century low of 3.5% witnessed in the prior month. An early August survey period probably capped average hourly earnings growth, following a .5% gain in July.
Federal Reserve Appearances:
- Aug. 30 Richmond Fed President Barkin to discuss the outlook with a regional chamber of commerce in West Virginia.
- Aug. 30 New York Fed President Williams to answer questions about the outlook in an online interview with the WSJ.
- Aug. 31 Cleveland Fed President Mester to discuss the economic outlook with Dayton Area Chamber of Commerce.
- Aug. 31 Atlanta Federal Reserve Bank President Bostic to participate in a moderated discussion at Georgia Fintech Academy.
- Sept. 1 Atlanta Federal Reserve Bank President Bostic to give a presentation to students at Georgia Fintech Academy event.
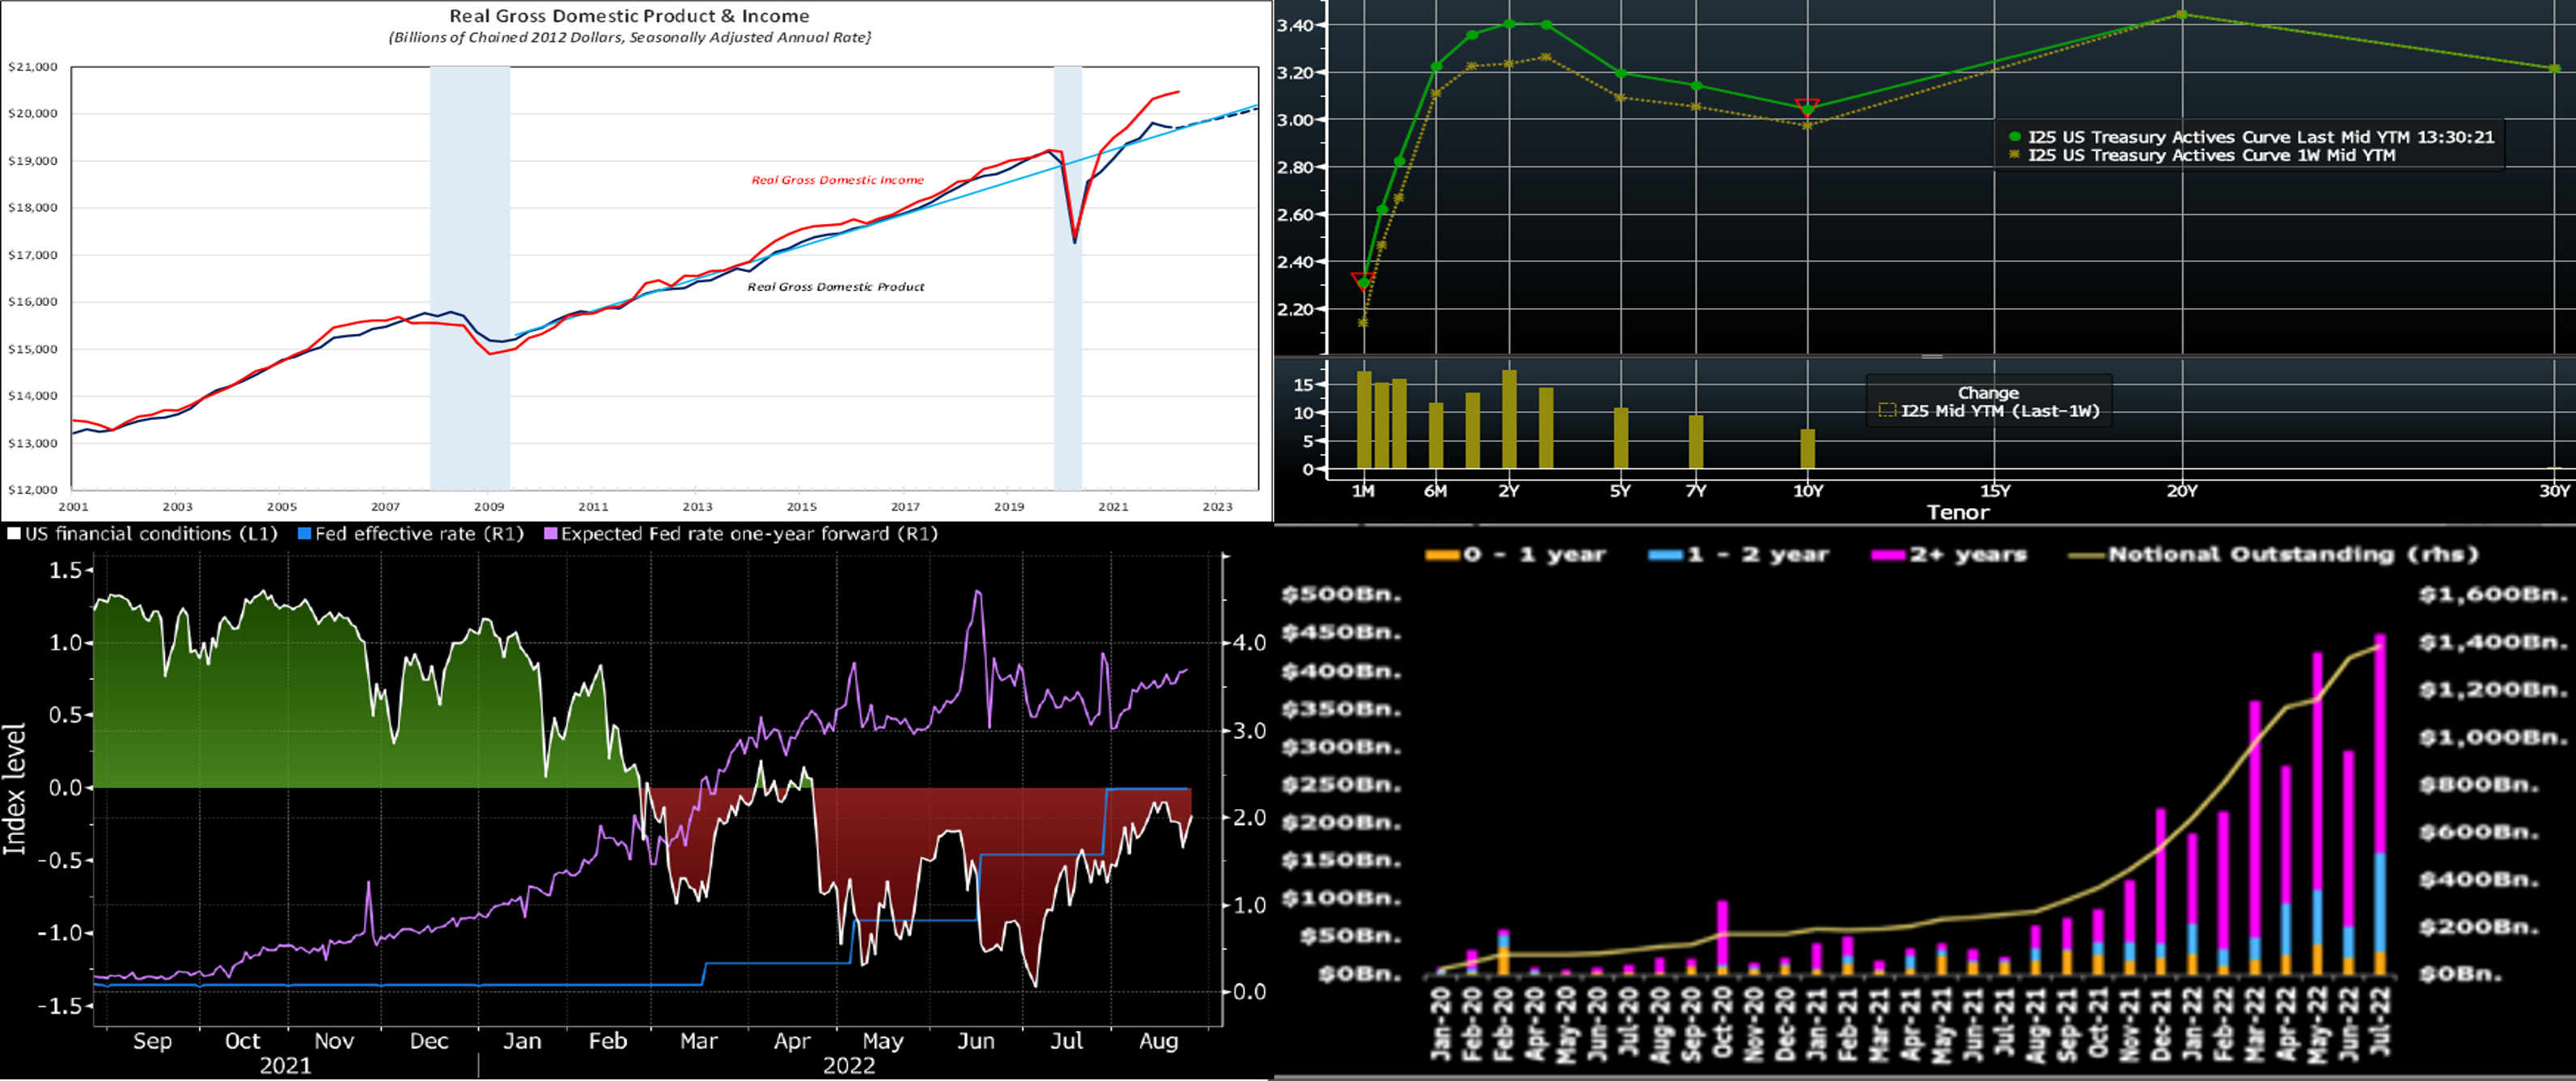
CHART 1 UPPER LEFT
Source: Bureau of Economic Analysis; NBER; Bloomberg. Notes: Blue shaded areas denote recessions; dotted line current consensus forecasts. The BEA, after the accumulation of more complete data, reported that real GDP shrank by .6% annualized during Q2, a touch better than the previously posted .9% dip. The key takeaway from the report was that real gross domestic income (GDI) – the sum of all wages, profits, and taxes, minus subsidies – continued to rise during the spring, climbing by 1.4% annualized, following a 1.8% gain in Q1. Since all income is derived from production, real GDI should exactly equal real GDP. The difference, known as the statistical discrepancy, expanded to a record-wide $773.6bn in 2012 dollar-equivalent during Q2. On September 29th, the BEA will release its annual revisions to the National Economic Accounts which cover the period from 2017-forward. Historically, the BEA has adjusted real GDP closer to real GDI upon revision.
CHART 2 UPPER RIGHT
Source: Bloomberg. Note: Top pane is yield (%), bottom pane is change (bps). The UST curve finished higher and flatter week-over-week, led by the 2-year point which was ~15 bps higher (adjusted 2 bps for the yield roll to a new on-the-run security). Despite a lower-than-expected inflation data reading on Friday, Fed-speak continued to reinforce that it will act with resolve to quell inflationary forces which remain decidedly too strong. This dynamic led the market to price more aggressive forthcoming hikes and to further pare back pricing of a prospective Fed easing cycle in late-2023. Read below for further color, and please contact the desk for further information.
CHART 3 LOWER LEFT
Source: Bloomberg. Why has recent Fed-speak been so “hawkish”, with multiple members citing the need to raise rates further and for a longer period than what the market has been pricing? For instance, this past week, Fed member Esther George cited that perhaps the policy rate needed to be “4% for a time”. A main reason resides in this chart of the Bloomberg U.S. Financial Conditions Index (LHS). This index tracks the overall level of financial stress in the money, bond, and equity markets to help assess the availability and cost of credit. A positive value indicates accommodative financial conditions, while a negative value indicates tighter financial conditions. Despite aggressive Fed rate hikes (RHS, %) this year, the index now sits near its level of March when the Fed began its hiking cycle. This improvement of the index has been partly instigated by the recovery in stock prices and credit spreads from their lower and wider levels of early July. The market has adjusted its Fed pricing somewhat from a few weeks ago, as it now prices a fed funds effective of ~3.81% in spring-2023. And it has pushed back the timing of potential Fed easing to late-2023. Nonetheless, the Fed is likely to continue its hawkish pushback; indeed, Chair Powell issued on Friday a direct warning about the perils of “premature loosening” and cited the potential need to be “restrictive for some time”.
CHART 4 LOWER RIGHT
Source: Bloomberg, CME. As seen here, cleared SOFR interest rate swap market activity (LHS monthly activity; RHS notional outstanding) has risen meaningfully in 2022, with the notional amount outstanding increasing 159% year-to-date to $1.39trn. Of the notional volume cleared this year, 73.7% had a tenor greater than 2-year, 18.2% has been between 1 to 2-year, and 8.1% was less than one year, according to the CME Group. Similarly, our SOFR advance product has enjoyed a notable rise in activity over this time period. Note that our SOFR advance can be an optimal funding vehicle vs. SOFR-based swaps. Also, for smaller-sized members, note that we offer SOFR swaps to help in your ALM-hedging needs. Please call the desk for further information.
FHLBNY Advance Rates Observations
Front-End Rates
-
Short-end Advance rates finished higher by 10 to 18 bps week-on-week. Maturities now cross further into potential upcoming Fed hikes, and the market boosted the odds of more aggressive near-term hikes. Volatility in short-end markets has tempered in recent weeks, but the chance remains of dynamic moves both day-to-day and intraday, a situation likely to persist while the Fed embraces a “data-dependent” posture regarding rate hikes. As of this past Friday midday, the market priced for a 100% chance of a 50 bps hike at the Sept.21st FOMC, with ~62% chance (up from ~48% last week) of a 75 bps hike. For 2022 cumulatively from here and notably higher from the week prior, the market fully prices 125 bps of hikes, with ~32% chance of 150 bps.
-
Given the Fed’s tightening and data-dependent posture, rates will remain highly responsive to economic data and Fed-speak.
Term Rates
- The longer-term curve finished higher and flatter week-over-week, generally mirroring the move in UST and swaps markets. Whereas 2-year was ~15 bps higher, 5-year was ~12 bps and 10-year ~7 bps higher. Kindly refer to the previous section for relevant market color. The advance curve is extremely flat overall and inverted at various points, thereby offering opportunities to extend in advance duration for minimal or lower coupon cost.
- On the UST term supply front, this upcoming week serves a reprieve in auctions. Market focus will remain on economic data, particularly this Friday’s job data, as well as Fed-speak. Please call the desk for information on market dynamics, rate levels, or products.
Product Alert: FHLBNY is pleased to announce enhancements to our Advance Rebate Program, which provides members an opportunity to receive a cash rebate when prepaying an eligible advance and rebooking a new advance within a 30-day period. Rebate-eligible advances now must have a minimum of 6-months (reduced from 1-year) remaining. Moreover, the potential cash rebate has been increased. This program can be suitable for those wishing to extend their liability duration and/or potentially improve net interest margin. Please call the Member Service Desk at (212) 441-6600 for more information.
Forward Start Advance (FSA): For members with upcoming borrowing or refunding plans, consider the FSA as a method to opportunistically “lock in” rates before advance settlement date. Please call the Member Service Desk at (212) 441-6600 for more information.
The Symmetrical Prepayment Advance Feature
With rates at or near multi-year lows, it is a compelling juncture to use the SPA feature on term advances. This feature allows member to capture, at prepayment, changes in the Fair Value of the advance which are favorable to the member. Contact us to discuss.
Looking for more information on the above topics? We’d love to speak with you!
Questions?
If you wish to receive the MSD Weekly Market Update in .pdf format (includes FHLBNY rate charts) or to discuss this content further, please email the MSD Team.