Member Services Desk
Weekly Market Update
This MSD Weekly Market Update reflects information for the week of November 16, 2020.
Economist Views
Click to expand the below image.
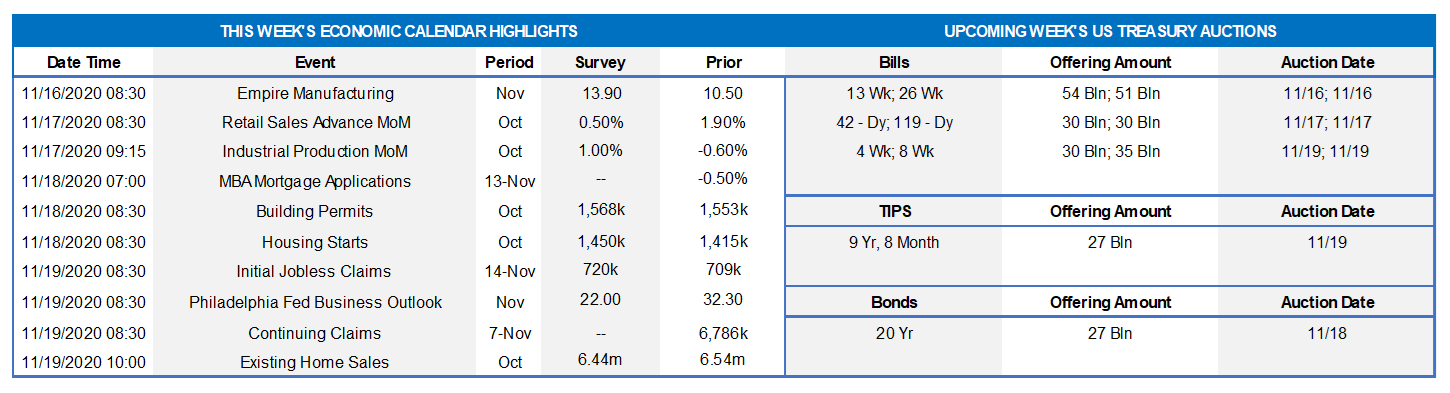
With COVID-19 infections rising nationwide, market participants will keep one eye on the latest virus figures and the other on economic data. Upcoming reports on retail sales, industrial production, and new home building activity will allow economists to update their tracking estimates of current-quarter real GDP growth which are currently centered on an annualized rise of 4.0%. Federal Reserve officials will make eight public appearances this week on a variety of topics. Senate Majority Leader Mitch McConnell has scheduled a vote this Tuesday before the full body for Judy Shelton to fill one of two vacant seats on the Fed’s Board of Governors. Press reports suggest that a vote would not be scheduled if Mr. McConnell expected it to fail. A vote on President Trump’s other nominee, Chris Waller, has yet to be scheduled.
Retail and Food Services Sales: Retail and food services sales likely slowed in October, climbing by a comparatively modest 0.5% after the 1.9% jump posted in September. Pay close attention to “control” sales excluding automotive, building materials and gasoline purchases that are used to estimate nominal consumer goods spending in the upcoming report. The median 0.5% rise projected by the consensus in October would place the key spending metric 5.5% annualized above the July-September average, following a 39.9% annualized Q3 surge.
Industrial Production: Powered by an anticipated snapback in factory output, industrial production is expected to have risen by 1.0% last month, more than offsetting September’s surprising 0.6% decline.
NAHB Housing Market Index: Upbeat appraisals of current and future sales, together with a further pickup in prospective buyer traffic, likely propelled the National Association of Home Builders’ sentiment gauge to a new all-time high in November.
Housing Starts & Building Permits: Residential building activity probably started the fall quarter on a high note, with both groundbreakings and permit applications rising from their respective September levels. Solid demand for new dwellings likely boosted new starts by 2.5% to a SAAR of 1.45mn in October. Building permits – a leading indicator of prospective construction activity – are projected to climb by 1.5% to 1.57mn annualized – the highest level since March 2007.
Jobless Claims: Initial and continuing jobless claims probably remained on downtrends in their respective reporting periods but remain well above the levels prevailing before the COVID-19-induced shuttering of the economy in mid-March.
Existing Home Sales: Lagged home-purchase contract signings suggest that existing home sales climbed by 1.4% to a SAAR of 6.63mn in October – the highest level since the 6.7mn closings posted in April 2006. With the number of homes on the market likely to contract by 3.4% to 1.42mn during the reference period, the months’ supply of available dwellings probably dipped to a record low 2.6 months.
Federal Reserve Appearances:
Nov. 16: Fed Vice Chair Clarida to discuss the economic outlook.
Nov. 17: Four Fed Presidents to take part in conference on racism and the economy.
Nov. 18: New York Fed President Williams to participate in webinar on business writing.
Nov. 18: St. Louis Fed President Bullard to discuss the economic outlook.
Nov. 18: Dallas Fed President Kaplan to moderate panel discussion hosted by bank.
Nov. 18: Atlanta Fed President Bostic to host webinar on economic perspectives.
Nov. 20: Dallas Fed President Kaplan to give speech at Kansas City Fed conference.
Nov. 20: Kansas City Fed President George to give speech at Bank conference.
Click to expand the below images.
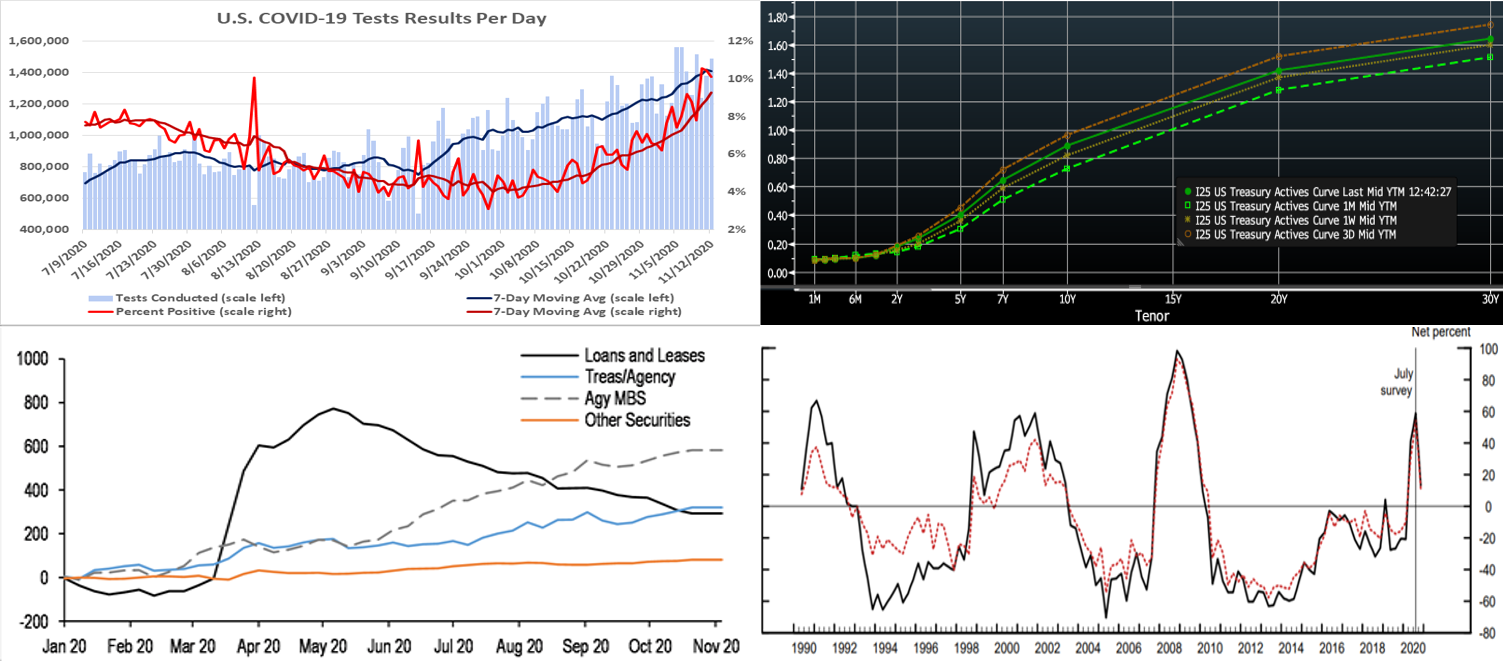
CHART 1 – UPPER LEFT
Source: COVID Tracking Project; FHLBNY. Amid widespread signs of a resurgence, economic data is taking a “back seat” to figures tracking the COVID-19 pandemic in the minds of market participants. The U.S. now conducts ~1.4mn tests for the virus daily. Unfortunately, since the end of September, positive tests have more than tripled to 130K per day, with the percentage of such results more than doubling to 9.3% over the latest seven days. In turn, hospitalizations and deaths have also trended notably higher. The percentage of positive results in New York State and New Jersey at 2.6% and 6.4%, respectively, remain well below the national average. However, the renewed uptrends in positive cases in both the Empire and Garden States raise the possibility that social-distancing measures will be reintroduced, and that outcome could dampen economic activity across most of the FHLB-NY coverage area.
CHART 2 – UPPER RIGHT
Source: Bloomberg. The UST curve “bear steepened” the past week and remains higher and steeper than a month ago. The curve hit higher and steeper levels, relative to the end of the week, on Monday/Tuesday in response to positive news of a COVID-19 vaccine. However, while this news may end the “pandemic in perpetuity” gloom, indications are that the vaccine process can last well into 2021 before there is mass vaccination or any “all-clear”. In the meantime, Covid-19 trends are very worrisome. Consequently, rates and the curve retraced some of the early-week move. To reiterate, the Fed’s guidance and programs have served to pin the shorter maturities, and so again maturities past 4-year led movements. It should be noted, however, that the market, in response to recent data and vaccine news, has pushed slightly earlier (end-2023) any probability of a Fed hike.
CHART 3 – LOWER LEFT
Source: Fed H.8; Bloomberg; JP Morgan. Pictured here is the YTD cumulative change in selected assets (in $bn) of U.S. commercial banks. US commercial banks continue to experience declines (post-Revolver and PPP loan period in the spring) in loan balances at a consistent pace and have primarily invested in UST/Agencies/Agency MBS to fill the gap.
CHART 4 – LOWER RIGHT
Source: Fed. Depicted here is the “Net Percent of Domestic Respondents Increasing Spreads of Loan Rates over Bank’s Cost of Funds”, from the Fed’s Senior Loan Officer Survey. Since July, banks have loosened loan standards and reduced spreads from the lofty levels of mid-summer. Perhaps this trend is in response to a recovering economy. But also it may reflect a desire for more yield on assets, since securities’ yields have been driven to historically low levels.
FHLBNY Advance Rates Observations
Front-End Rates
Short-end advance rates were generally unchanged week-over-week. Heavy T-bill issuance was a feature, as usual, but net supply has slowed and thereby allowed for easier market absorption. Continuing a recent trend, money market funds experienced ~$7.4bn of outflow on the week. Overall market supply of short paper has moderated in recent months, however, thereby blunting the impact of these investor outflows.
Heavy T-Bill issuance will remain a theme; UST issuance overall is now net positive supply in that more is being issued than what the Fed is buying in its programs, and so this scenario could prove a small challenge. However, with short UST rates at rock-bottom levels, and the Fed likely on hold for a long period, rates may trade in a sideways pattern. Net T-bill issuance has been lower since mid-summer and even negative in recent weeks, and Treasury has announced plans to shift issuance out the curve, but a new fiscal relief package may complicate/alter this forecast. Market sentiment thus far towards election outcomes is that the probability of very large fiscal legislation has been reduced, thereby leading to less T-bill supply.
Term Rates
Medium and longer-term advance rates were were 2 to 5 bps higher in progressive fashion out the curve, in a “bear steepener” move, on the week. Rates 4-year and shorter generally remain pinned in a narrow range, and so again it was the portion of the curve 5-year and out that led the week’s change. Please refer to the previous section for further color on the market moves.
Rates still trade at historically low levels across the yield curve, and the curve is priced for the Fed to be on hold for several years. If suitable or sensible from an ALM perspective, it may be worthwhile to consider extending liabilities and locking in term rates. Note that election outcomes still have the potential to spur further moves in the curve and rates. Please call the Member Services Desk to discuss rate levels and potential ideas.
On the UST supply front, this week brings only a 20-year nominal and a 10-year TIPS auction. The past week’s auctions met with some difficulty in demand, and so the lighter schedule will be welcome relief to dealers. Corporate issuance should add yet again to its historic record annual pace. Attention will remain on the prospect of further relief legislation and certainly also on COVID-19 developments which have been notably worsening.
The Symmetrical Prepayment Advance Feature
With rates at or near multi-year lows, it is a compelling juncture to use the SPA feature on term advances. This feature allows member to capture, at prepayment, changes in the Fair Value of the advance which are favorable to the member. Contact us to discuss.
Looking for more information on the above topics? We’d love to speak with you!
Questions?
If you wish to receive the MSD Weekly Market Update in .pdf format (includes FHLBNY rate charts) or to discuss this content further, please email the
MSD Team.
Special Member Alert
The FHLBNY recently announced a newly expanded and flexible Disaster Relief Funding (DRF) advance program which offers discounted rate advances with maturities 1-mo and greater. Additionally, we have announced that PPP loans will be accepted as eligible collateral. Please contact us with any questions.