Member Services Desk
Weekly Market Update
Economist Views
Click to expand the below image.
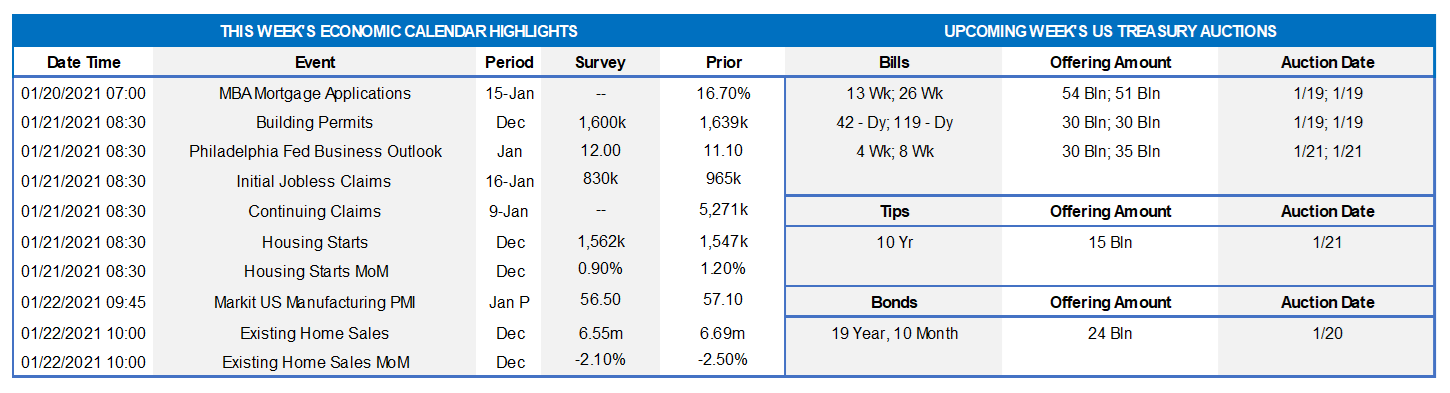
Market participants will undoubtedly have one eye on political developments and the other on the economic release calendar in the upcoming Martin Luther King Day-shortened week. The economic news is expected to be positive on balance. Home-builder sentiment likely clocked in near a record high this month, while new residential construction activity ended 2020 on a high note. Initial and continuing state jobless claims probably receded after surprising prior-week jumps. Nationwide manufacturing activity continued to expand at the beginning of this new year. Only one Federal Reserve official, Minneapolis President Neel Kashkari, is slated to speak on economic conditions.
NAHB Housing Market Index: Upbeat appraisals of current and prospective sales, along with an anticipated pickup in prospective buyer traffic, likely propelled home-builder sentiment closer to the record 90-point level posted in November.
Housing Starts & Building Permits: Reported increases in building materials sales and construction hours work suggest that the number of new housing units started likely rose for a fourth consecutive month in December. The seasonally adjusted annual rate (SAAR) of 1.56mn projected by the Street, if realized, this result would represent the highest level of groundbreakings since February 2020. The number of building permits issued probably declined by 2.1% to 1.6mn, thereby reversing a little over a third of November’s reported gain.
Initial Jobless Claims: Initial claims for regular state unemployment insurance benefits are expected to have retreated to 830K during the period ended January 16, following the elevated 965K prior-week tally. While the number of persons on regular state benefits rolls likely declined to 5mn over the January 2-9 span, the total count of persons receiving some sort of assistance during this trying period probably remained closer to 18mn.
Markit US Manufacturing PMI: The Markit Economics’ canvass will provide an early glimpse at nationwide manufacturing activity in January. The median consensus forecast of a pullback to 56.5, from 57.1 in December, would be consistent with a modest dip in the more closely followed Institute for Supply Management gauge this month.
Existing Home Sales: The pullback in home-purchase contract signings recorded over the October-November span suggests that existing home sales dipped by 1.9% to a SAAR of 6.56mn in December – 18.7% above the 5.53mn dwellings closed on a year ago. With the stock of homes on the market expected to retreat to a record low 1.08mn during the reference period, the inventory of available dwellings likely moved three ticks lower to just 1-months’ supply.
Upcoming Federal Reserve Appearance:
Jan. 15: Minneapolis Fed President Neel Kashkari to participate in virtual town hall discussion on the economy.
Click to expand the below images.
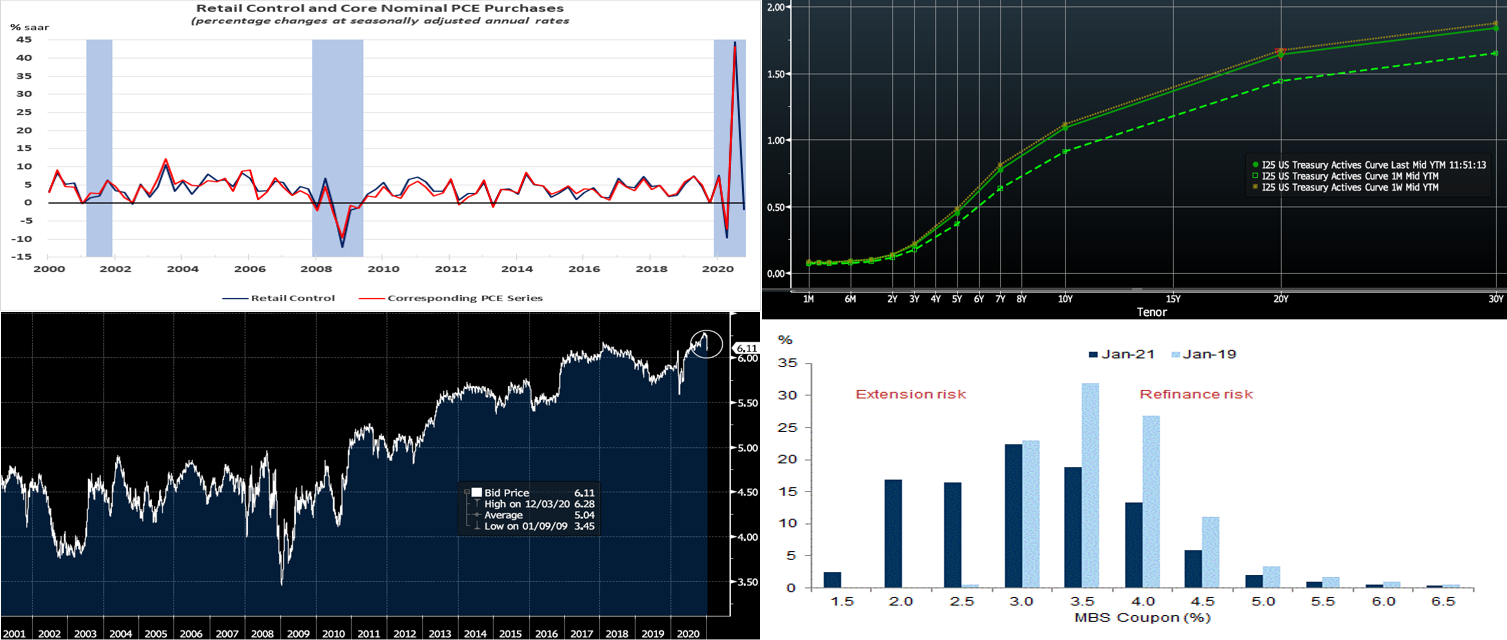
CHART 1 – UPPER LEFT
Source: BEA, Census Bureau, FHLBNY. The Census Bureau reported that retail and food services sales fell by .7% in December, following a downwardly revised 1.4% drop in November. Online retailers, restaurants, supermarkets and general merchandisers suffered sharp sales declines last month. Retail control – the portion of the report excluding auto, building materials, food and gas sales that is used to estimate nominal goods purchases in GDP – fell by 2% after a 1.1% decline in November and hints at a sharp slowdown in nominal consumer spending during the final stanza of 2020. On the heels of the retail sales report, the Federal Reserve Bank of Atlanta pared their tracking estimate for Q4 real GDP growth from 8.7% to a 7.4% SAAR.
CHART 2 – UPPER RIGHT
Source: Bloomberg. Week-over-week, the UST curve mildly “bull flattened”, as yields fell 2 to 5 bps in progressive fashion out the curve. The Fed’s guidance and programs continue to pin shorter-end yields, and so it was maturities 4-year and longer that led the move. Weaker economic data, a worsening Covid-19 situation, and Fed Chairman Powell’s comments that it is “too early” to talk of asset-purchase tapering all contributed to “take the wind out of the sails” of the recent “bear steepening”. The 10 and 30-year UST auctions were absorbed well, and even President-elect Biden’s Thursday fresh relief proposal failed to stir the market. Several dealers this past week slightly raised their yield forecasts for 2021; JP Morgan, for instance, now calls for a 1.45% year-end 10-year UST yield.
CHART 3 – LOWER LEFT
Source: Bloomberg. Depicted here is the modified duration of the Bloomberg Barclays Aggregate Bond index, a broad-based benchmark index of the US fixed-rate bond market, over the past 20 years. It is near its highest levels over this timespan, having retreated a bit in recent weeks when rates moved higher. Naturally, it makes intuitive sense that this price risk measure is near all-time highs, given that rates are near all-time lows and duration is greater at lower rate levels. A significant rise in rates from here, therefore, will result in significant securities’ price declines and should factor importantly into ALM scenario analyses and considerations.
CHART 4 – LOWER RIGHT
Source: eMBS, Goldman Sachs Research. Portrayed here is the distribution of outstanding conventional 30-year MBS coupons, January 2021 vs. January 2019. Over the past two years, and especially in 2020, a large share of mortgage borrowers in 3.5% and 4.0% coupon pools have refinanced into new 1.5% and 2.0% coupon MBS. As a result, a bifurcation of sorts has developed in the MBS market between extension and shortening risk. Put more simply, a large chunk of MBS is now susceptible to extension, while another large chunk is still susceptible to shortening risk. Members should review their bond portfolios and coupon allocations, in order to assess risks and any potential need to adjust and/or hedge ALM positioning.
FHLBNY Advance Rates Observations
Front-End Rates
Short-end advance rates finished mostly unchanged week-over-week. T-bill issuance was its usual market feature, but net supply has slowed and thereby allowed for easier market absorption. Money market funds’ AUM increased by ~$7bn this past week, led by a $10bn inflow to Government-Only funds. These developments should contain rates to the upside near-term. From a bigger-picture vantage point for 2021, an overall moderation in market supply of short paper is expected to help keep short-end rates relatively steady.
Heavy T-Bill issuance will remain a theme; UST issuance overall is now net positive supply in that more is being issued than what the Fed is buying in its programs. However, with short UST rates at rock-bottom levels, and the Fed likely on hold for a long period, rates may trade in a near-term sideways pattern. Importantly, net T-bill issuance has been lower since last summer and even negative in recent months, and Treasury has announced plans to shift issuance out the curve. Even with a new relief package and related borrowing, these supply/demand and Treasury issuance dynamics should keep short rates in check on the upside.
Term Rates
Medium and longer-term advance rates mildly “bull flattened” on the week by 2 to 5 bps out the curve. Please refer to the previous section for further color on market dynamics.
Rates still trade at historically low levels across the yield curve. If suitable or sensible from an ALM perspective, it may be worthwhile to consider extending liabilities and locking in term rates. If not in need of funding now but anticipating future needs, a Forward Start Advance can be an appropriate solution. Per the previous slide, the risks of an eventual higher rate regime may warrant attention; Advance and/or derivative products may be appropriate to hedge such risk. Please call the Member Services Desk to discuss rate levels and potential ideas.
On the UST supply front, next week brings a 10-year TIPS and a nominal 20-year auction. And corporate issuance should accelerate further post its usual strong start-of-the-year pattern. Indeed, watch for a slate of bank issuance after the recent Q-4 2020 earnings releases. Attention will also remain on Covid-19 and fiscal legislation developments.
The Symmetrical Prepayment Advance Feature
With rates at or near multi-year lows, it is a compelling juncture to use the SPA feature on term advances. This feature allows member to capture, at prepayment, changes in the Fair Value of the advance which are favorable to the member. Contact us to discuss.
Looking for more information on the above topics? We’d love to speak with you!
Questions?
If you wish to receive the MSD Weekly Market Update in .pdf format (includes FHLBNY rate charts) or to discuss this content further, please email the
MSD Team.
Special Member Alert
The FHLBNY recently announced a newly expanded and flexible Disaster Relief Funding (DRF) advance program which offers discounted rate advances with maturities 1-mo and greater. Additionally, we have announced that PPP loans will be accepted as eligible collateral. Please contact us with any questions.