Member Services Desk
Weekly Market Update
This MSD Weekly Market Update reflects information for the week of November 22, 2021.
Economist Views
Click to expand the below image.
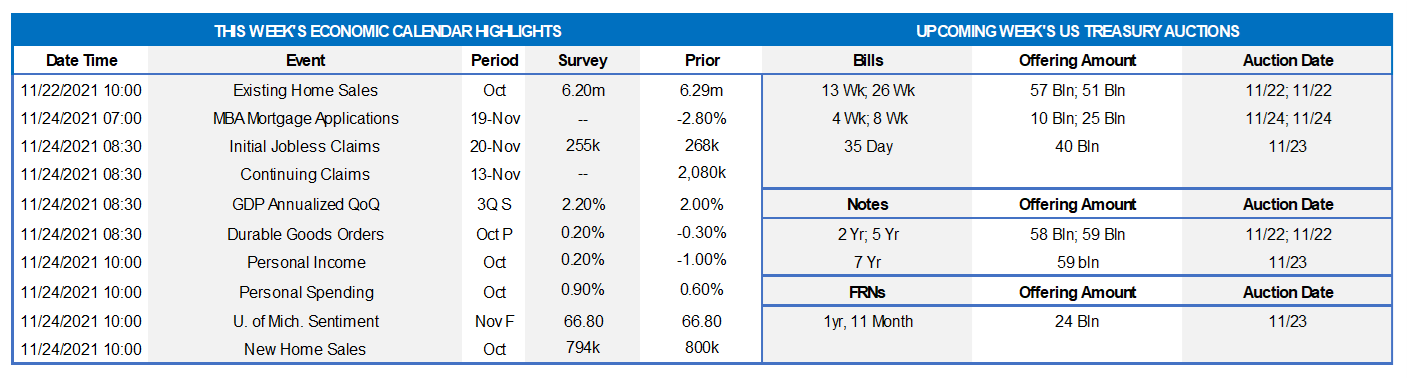
With the House of Representatives passing the Build Back Better Act, the attentions of market participants will now turn to the $1.75-trillion spending package’s progress through the Senate, where Majority Leader Schumer hopes to pass the legislation by Christmas. Key soundings on economic activity in October have generally beaten Street expectations. The median projection for current-quarter real GDP growth stands slightly shy of 5% annualized, following the summer’s 2% gain, with some prognosticators anticipating an even-sharper pickup. Indeed, based on data released to date, the Federal Reserve Bank of Atlanta’s latest tracking estimate stands at a steamy 8.2%. This week’s economic release calendar will be fairly crowded ahead of the Thanksgiving holiday. Government statisticians are expected to boost their estimate of Q3 growth slightly. Reports on existing home purchases, durable goods bookings and personal spending will provide important information on activity at the beginning of Q4. While Federal Reserve officials will take a break from the speaking circuit, the minutes of the November 2-3 Federal Open Market Committee meeting may provide some insight on the timing of an initial hike in administered rates.
Existing Home Sales: The pickup in purchase-contract signings posted over the August-September span suggests that existing homes sales rose by 1% to a ten-month high seasonally adjusted annual rate of 6.35mn in October. With available dwellings on the market likely dipping by 30K to 1.24mn during the reference period, the stock of unsold homes likely moved one tick lower to 2.4 months’ supply.
Jobless Claims: Initial and continuing claims under regular state unemployment insurance programs probably remained on downtrends over their latest respective reporting periods. The termination of pandemic-related jobless benefits suggests that the total number of persons receiving assistance will also decline further during the week ended November 6 from the 3.18mn, or 2% of the civilian labor force, recorded in the prior week.
Durable Goods Orders: Capped by a pullback in transportation equipment bookings, durable goods orders likely edged .2% higher in October, after a .3% dip in September. Excluding the anticipated decline in transport requisitions, “hard goods” bookings are expected to have climbed by .4%, almost matching their prior-month .5% gain. Last month’s nondefense capital goods shipments excluding commercial jetliner deliveries will allow economists to mark-to-market their estimates for the contribution of business equipment spending to Q4 real GDP growth.
Real GDP: Data released since the Bureau of Economic Analysis’ advance report suggest that summer-quarter growth may be boosted slightly from the initially reported 2.0% annualized pace.
Personal Income & Consumer Spending: Sans a significant drag from the termination of pandemic-related unemployment insurance programs, personal income likely rose by .2% last month, reversing a portion of September’s 1% decline. Broad-based increases in goods purchases, combined with an anticipated pickup in services outlays, probably propelled consumer spending 1% higher in October, building on September’s .6% gain.
New Home Sales: The reported rebound in single-family building permits in October suggests that contracts to buy a newly constructed dwelling likely rose to a seven-month high seasonally adjusted annual rate of 825K.
Federal Reserve:
Nov. 24 Minutes of November 2-3 Federal Open Market Committee meeting to be released.
Click to expand the below images.
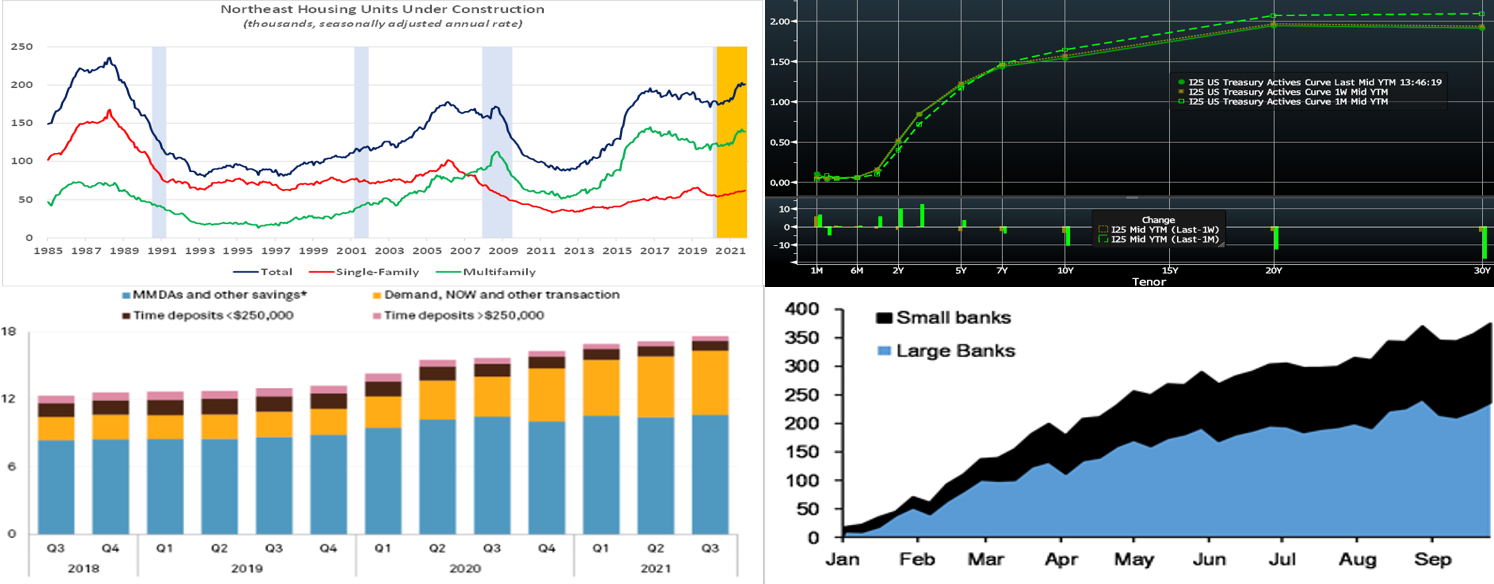
CHART 1 UPPER LEFT
Source: Census Bureau; NBEA; FHLBNY. Blue-shaded areas denote recessions; orange-shaded area highlights current economic expansion. Amid widespread reports of a housing shortage in our region, last week’s update on residential construction activity in October suggests that some relief may be in the offing. The total number of housing units under construction in the Northeast edged slightly higher to a seasonally adjusted annual rate of 201K during the reference period. Over the past three months, the number of dwellings being built has approached levels last witnessed at the beginning of 1989. In contrast to the even split across the Nation as a whole, multifamily structures account for over two-thirds of the units under construction in our area. Data collected by the Census Bureau revealed that it took 6.8 months to build a single-family home in 2020, while multifamily structures took an estimated 15.4 months to complete. Given shortages of available workers, building materials, and supplies such as appliances, the time between breaking ground and a finished structure is undoubtedly longer this year.
CHART 2 UPPER RIGHT
Source: Bloomberg. Note: Top pane is yield (%), bottom pane is change (bps). As of midday Friday, yields had retraced a bit of the prior week’s notable rise. Yields below 2-year were generally unchanged, with the notable exception of 1-month T-bills which were ~5 bps higher owing to crossing the new debt ceiling limit timeframe. The rest of the curve was ~2 to 4 bps lower, led by the 10-year point. Economic data mostly beat expectations to the strong side. With the January 2023 Fed Funds future trading at .685%, the curve currently prices for slightly under 2.5 Fed hikes by the end of 2022. Inflation remains on the market’s mind; indeed the 10-year TIPS auction this past Thursday resulted in a record low yield. Although a bit less so this week, the markets have exhibited intraday volatility which may present opportunities to borrow advances at more advantageous rates. Please engage with the desk to monitor rate levels. Meanwhile, on the asset side, higher implied volatility in market-pricing can offer an opportunity (higher implied volatility increases a security’s yield, all else equal) to consider callable and MBS purchases.
CHART 3 LOWER LEFT
Source: S&P Global Market Intelligence. Shown here is deposit composition (LHS, $trn) at US banks. From the end of the third quarter through early November, banks added an additional $163.5bn of deposits, according to seasonally adjusted, weekly data from the Federal Reserve. But many banks and analysts expect the heady pace of deposit growth to simmer, now that the Fed has begun the removal of accommodation via the initial step of tapering its securities purchases. As noted here in previous editions, the taper will be a gradual process. Financial institutions, therefore, should closely analyze and scenario-test their deposit profiles, in order to gauge the extent and timing of potential outflows.
CHART 4 LOWER RIGHT
Source: JP Morgan; Federal Reserve. Depicted here is the year-to-date change in MBS holdings (LHS, $bn) for small and large banks. While both types have notably increased holdings, smaller banks have driven the recent buying trend. Higher yields, relative to a few months ago, have certainly attracted demand. Moreover, referring again to the previous chart, high deposit levels are tactically being deployed into securities to improve net interest margins.
FHLBNY Advance Rates Observations
Front-End Rates
- Short-end Advance rates finished a bp lower through 4-month, and unchanged thereafter, on the week. The debt ceiling issue has sparked a notable increase in 1-month T-bill yields, but this dynamic has not impacted our rates. Demand for short paper and the Fed’s RRP, which stands last at ~$1.58trn, near the record high of $1.6trn, remains strong. The Fed acknowledged this dynamic at the last FOMC, as they raised the RRP counterparty limit to $160bn from $80bn. The overall supply/demand paradigm persists in suppressing rate levels, as the GSEs continue to invest large sums into money markets, the TGA has declined, Fed purchases instill funds to the banking system, and short-maturity paper is in low supply.
- UST issuance overall is now net positive supply in that more is being issued than what the Fed is buying in its programs. However, with short UST rates at rock-bottom levels and the Fed on hold, rates are likely to persist in a near-term sideways pattern. Importantly, weekly net T-bill issuance has been lower and often negative since 2020, and Treasury intends to shift issuance out the curve. T-bills have experienced a near-term issuance uptick on some “catch-up” issuance from September’s debt ceiling issue slowdown, but this uptick should not alter the overall money markets picture. Further legislative packages and related borrowing may lead to an eventual increase of T-bill auction sizes and positive net supply, but for now overall market supply/demand dynamics should keep short rates in check from large moves to the upside. As time ensues and maturities cross into summer 2022, a timeframe that the market is pricing some probability of rate hikes, these maturities’ rates are likely to experience some upward drift.
Term Rates
- Week-over-week, the advance curve was roughly unchanged out to 3-year and 2 to 6 bps lower, led by the 10-year, thereafter. Kindly refer to the previous section for further color on relevant market dynamics.
- On the UST supply front, this holiday-shortened week will bring 2/5/7-year auctions. The market will closely monitor this week’s legislative developments, namely the Senate follow-up on the Build Back Better Act, and economic data. For any borrowers wishing to settle on the post-holiday Friday but potentially away or shorthanded, note that a forward start advance can be executed prior to close of business on Wednesday. We wish our readers a Happy Thanksgiving!
New Product Alert: FHLBNY is pleased to announce the launch of the Business Development Advance (BDA) on Thursday, November 4, 2021. The BDA is a 0% advance to help our members provide funding to qualifying small businesses to promote community & economic growth. The BDA is subsidized funding in the form of interest-rate credits. There is a total of $3 million of interest-rate credits available in 2021. Members can request to reserve their interest-rate credits up to $50,000 on a first-come/first-served basis. For further details, please view our BDA overview page and watch this past Thursday’s BDA webinar, and/or contact the Member Service Desk at 1-800-546-5101 option 1.
The Symmetrical Prepayment Advance Feature
With rates at or near multi-year lows, it is a compelling juncture to use the SPA feature on term advances. This feature allows member to capture, at prepayment, changes in the Fair Value of the advance which are favorable to the member. Contact us to discuss.
Looking for more information on the above topics? We’d love to speak with you!
Questions?
If you wish to receive the MSD Weekly Market Update in .pdf format (includes FHLBNY rate charts) or to discuss this content further, please email the MSD Team.
Special Member Alert
The FHLBNY recently announced a newly expanded and flexible Disaster Relief Funding (DRF) advance program which offers discounted rate advances with maturities 1-mo and greater. Additionally, we have announced that PPP loans will be accepted as eligible collateral. Please contact us with any questions.