Member Services Desk
Weekly Market Update
This MSD Weekly Market Update reflects information for the week of January 31, 2022.
Economist Views
Click to expand the below image.
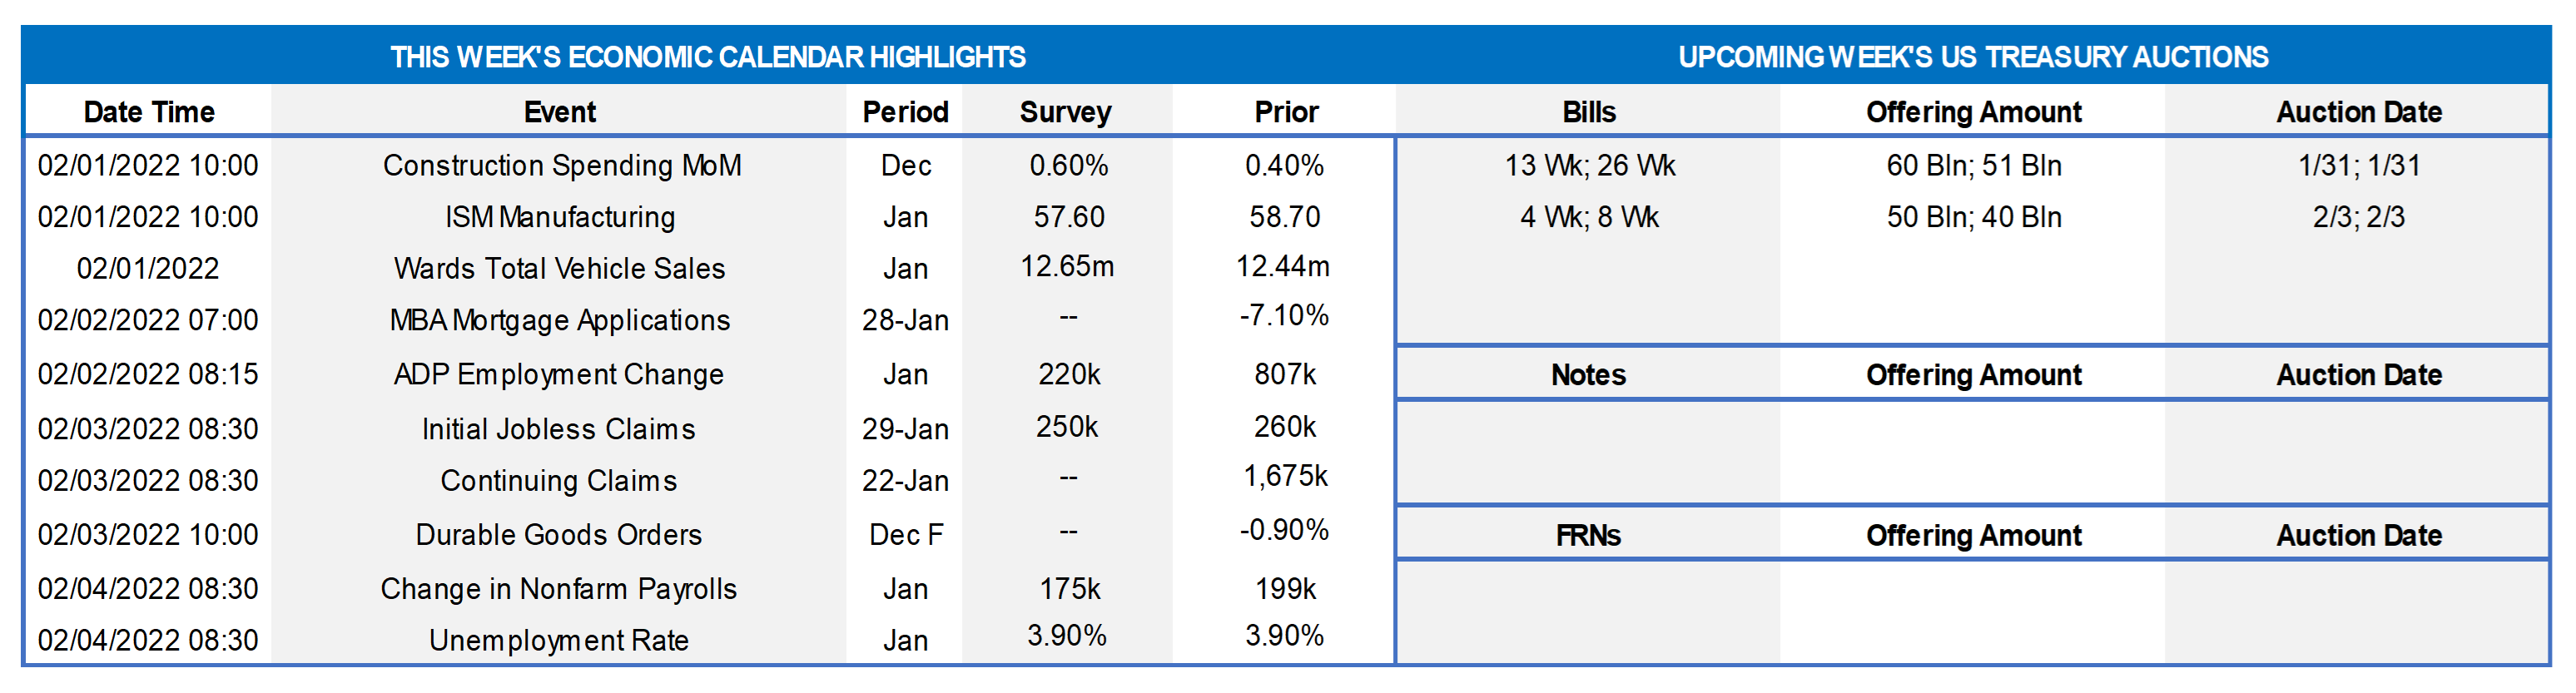
Having weathered the Federal Open Market Committee’s (FOMC) updates on prospective changes to monetary policy, the attentions of market participants will return to economic data. Manufacturing and service-producing activity likely expanded in January, albeit at a slower pace than in December. Despite ongoing inventory shortages, auto sales probably rebounded sharply last month. Productivity growth is expected to have resumed in Q4, following a summer-quarter decline. Labor demand likely surged at the end of 2021. Payroll employment growth is expected to have been little changed in January. The Senate Banking Committee will hold confirmation hearings for President Biden’s trio of nominees to the Board of Governors of the Federal Reserve System.
Construction Spending: The nominal value of construction put-in-place is expected to have risen by .6% in December, after a pair of .4% increases in October and November.
ISM Manufacturing Index: The nationwide manufacturing expansion probably marked its 20th month in January, though the pace of activity likely slowed from December’s reported clip. District Federal Reserve Bank canvasses suggest that the Purchasing Managers Index slipped to 56.5 from 58.8 in the preceding month.
JOLTS Job Openings: To be released Feb. 1 — A sharp rebound in online help-wanted postings suggests that job openings nationwide swelled by whopping 663K to a record high 11.23mn in December. If that projection is on the mark, the gap between available positions and the unemployed widened to an all-time high of 4.9mn at the end of last year.
Motor Vehicle Sales: Industry watchers expect auto sales to rebound sharply to a 7-month high seasonally adjusted annual rate of 15.1mn in January from 12.4mn in the preceding month.
ADP National Employment Report: Consensus expects an estimated 220K private-sector jobs were added at the beginning of the New Year, after the 807K leap posted in December. Given the massive overshoot from the 211K net positions added in the Bureau of Labor Statistics’ December establishment survey, a sizable downward prior-month revision is likely.
Nonfarm Productivity & Costs: The sharp reacceleration in real GDP growth in Q4, combined with a reported slowdown in total hours worked, suggests that nonfarm productivity rebounded, after a 5.2% annualized decline last summer. The pace of unit labor costs is expected to have slowed markedly over the final three months of 2021, following a 9.6% annualized jump in Q3.
ISM Services Index: To be released Feb. 3 — Service-producing activity probably expanded at a slower pace at the beginning of the New Year due to the Omicron variant outbreak, with the Institute for Supply Management’s barometer retreating to 56.0 from a lofty 62.3 in December.
Employment Situation Report: Recent increases in initial and continuing claims have clouded assessments of hiring conditions in January. The Street expects nonfarm payroll growth to slow to 175K in December. The upcoming report will include annual benchmark revisions to the BLS establishment data on payrolls, earnings and hours going back to January 2017. While net job creation may clock in well below the 365K average posted over the October-December span, solid increases in labor demand at yearend hint that positive surprises may be in store once again on average hourly earnings and the unemployment rate.
Federal Reserve Appearances:
- Jan. 31 San Francisco Fed President Mary Daly to be interviewed by Reuters.
- Feb. 3 Senate Banking Committee to hold confirmation hearing for Federal Reserve Board nominees Sarah Bloom Raskin, Lisa Cook and Philip Jefferson.
Click to expand the below image.
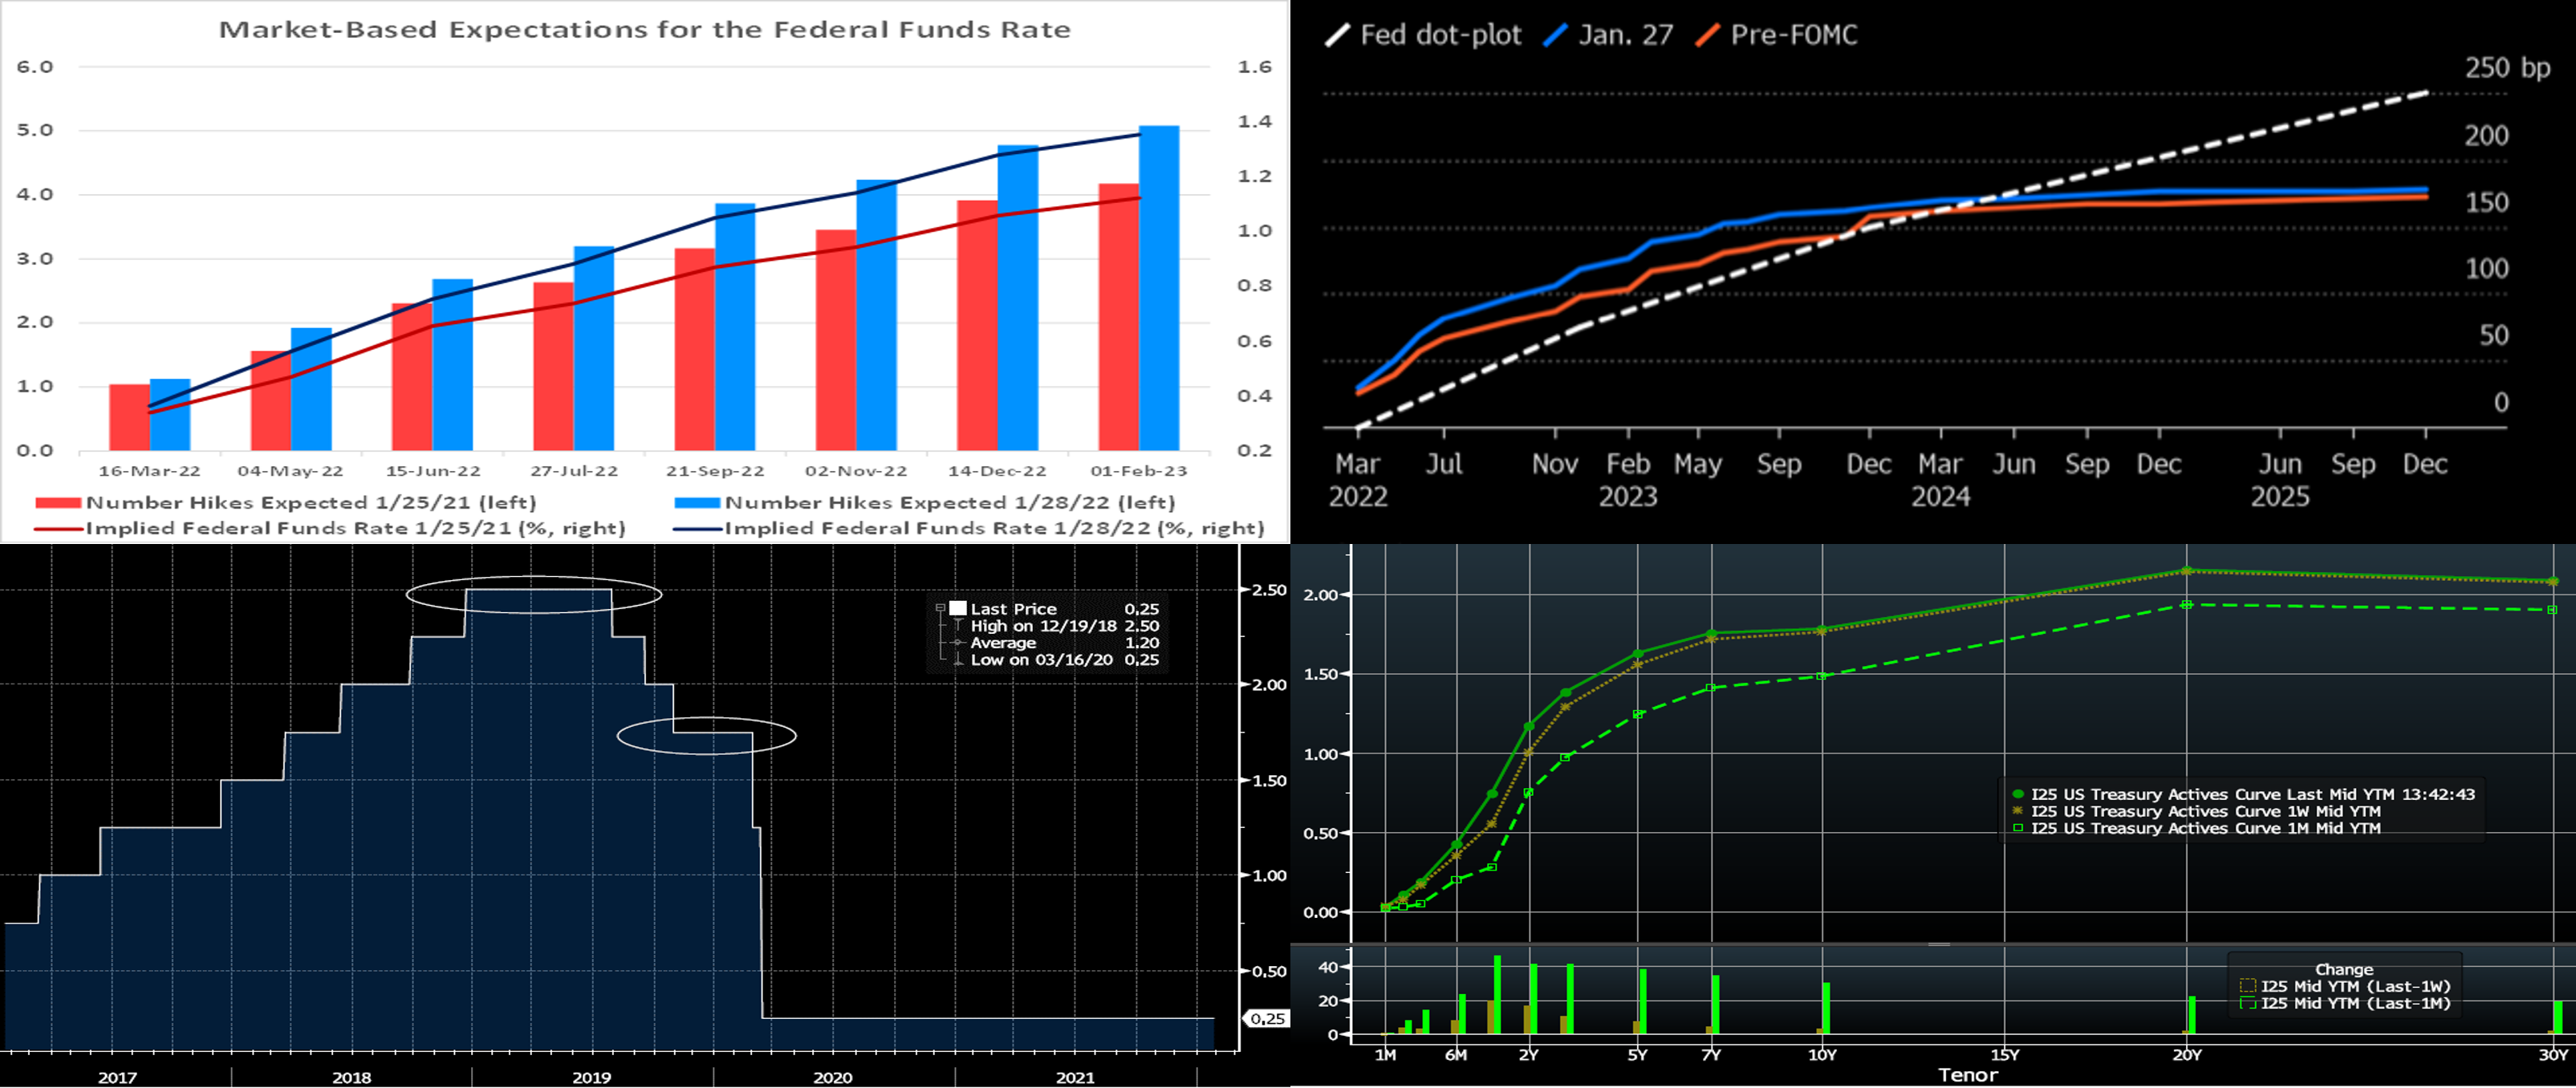
CHART 1 UPPER LEFT
Source: Bloomberg; FHLBNY. Owing to the past week’s notable FOMC meeting and a “Fed in play”, we again revisit a series of charts on the Fed’s rate projections (“dot plot”) and market pricing of policy rates. While the FOMC decision to leave the federal funds rate target range unaltered was no surprise, indications that policymakers anticipate liftoff in the soon future, to be followed thereafter by reductions in the size of the Central Bank’s balance sheet, appear to have caught market participants off guard. Indeed, the market has marked their expectations for the number of hikes and the level of the fed funds rate significantly higher in the wake of recent Fed communications. Market-based expectations now price for 25 bps increases at both the March 16 and May 4 FOMC meetings, with three additional similarly-sized hikes priced in the curve which will lift the fed funds target range to approximately 1.25% to 1.5% by February 1, 2023. The market prices a roughly 20% probability of a 50 bps hike at the March meeting, in a further reflection of the FOMC’s “hawkish” outcome.
CHART 2 UPPER RIGHT
Source: Bloomberg. This chart reflects the change in the Fed’s target funds rate now implied by the yield curve (futures and Overnight Index Swaps). As mentioned above, the market has re-priced higher the chance and extent of rate hikes for this year and next. As seen here, the market prices more aggressively than the last set of policymakers’ projections (“dot plot”) from the December meeting. Granted, Fed member projections may have increased since then, and so this differential may not be as stark as portrayed here. Notably, however, the market prices for a much lower policy rate in the “out-years” in 2024 and beyond. While the Fed median projection was 2.5% for the “longer-run” policy rate in the last dot plot, the market is well below that at ~1.80%.
CHART 3 LOWER LEFT
Source: Bloomberg. Continuing the above topic, there is certainly recent past precedent for a fed funds upper bound target of 2.5%. As seen here, the policy rate resided at this level throughout the first half of 2019. In this light, could the market be underpricing the longer-run rate? If so, then the 3 to 5-year sector of the curve could be at risk of further upward moves. Note, however, that the Fed lowered the target rate in the back half of 2019 to 1.75%, the level it stood immediately pre-pandemic. The market appears to be of the mindset that the Fed will again risk “overdoing it” and/or that the economy and inflation will slow in response to the Fed’s initial series of hikes and thereby lead to the target rate stalling at or near its pre-pandemic level.
CHART 4 LOWER RIGHT
Source: Bloomberg. Note: Top pane is yield (%), bottom pane is change (bps). As of midday Friday, the UST yield curve flattened week-over-week, as the FOMC result drove yields higher most significantly in the 1 to 5-year sector. The 1-year finished ~20 bps higher, with the 2-year up ~15 bps (roll-adjusted for the new on-the-run security), 3-year ~10 bps higher, and 5-year ~6 bps higher (roll-adjusted). Yields remain notably higher than a month ago, in reaction to data and Fed-related dynamics. Volatility, both day-to-day and intraday, in bond and stock markets has markedly risen in the past month. Members should monitor conditions for potentially more optimal entry points on funding or securities purchases. Market focus this upcoming week may focus on Friday’s jobs report, as Fed Chair Powell commented this past week that, paraphrasing, “there is plenty of room to increase rates without threatening the labor market”.
FHLBNY Advance Rates Observations
Front-End Rates
- Short-end Advances are again higher from the prior week, as the market prices for Fed tightening and maturities cross into the timeframe of hikes. Net T-bill issuance has turned positive, as Treasury aims to rebuild their TGA cash balances, a trend that somewhat impacts the short-end’s supply/demand dynamic. There remains still high cash levels in the short-end, as demand for the Fed’s RRP, which stands last at ~$1.61trn, remains strong. And money market funds’ AUM rose ~29bn the past week. However, with more than a 100% probability of a Fed hike now priced into the curve for the mid-March FOMC meeting and then again for the May FOMC, investors demand abhigher yield. While 3-month was only 1 bp higher from a week prior, the 4 to 6-month sector, given that it crosses over the May FOMC meeting too, was 7 to 9 bps higher.
- To reiterate, as time ensues and maturities cross into or further past upcoming FOMC meetings, these maturities’ rates are likely to experience further upward drift.
Term Rates
- The advance rates curve generally mimicked the UST curve week-over-week, with shorter maturities notably higher. The 1-year finished ~16 bps higher, 3-year ~11 bps higher, 5-year ~6 bps higher, and 10-year ~4 bps higher. Kindly refer to the previous section for further color on relevant market dynamics.
-
On the UST supply front, this week brings a reprieve from auctions. Given market volatility, members should monitor conditions for potentially more optimal entry points on funding or securities purchases. Please call the desk for information on market dynamics and/or rate levels.
FHLBNY is pleased to announce enhancements to our Advance Rebate Program, which provides members an opportunity to receive a cash rebate when prepaying an eligible advance and rebooking a new advance within a 30-day period. Rebate-eligible advances now must have a minimum of 6-months (reduced from 1-year) remaining. Moreover, the potential cash rebate has been increased. This program can be suitable for those wishing to extend their liability duration and/or potentially improve net interest margin. Please call the Member Service Desk at (212) 441-6600 for more information.
The Symmetrical Prepayment Advance Feature
For those anticipating term funding needs, and with rates on an uptrend, it can be an appropriate juncture to consider our Symmetrical-feature advance. This feature allows the member to capture, at prepayment, changes in the fair value of the advance which are favorable to the member. Please contact our Member Service Desk to discuss.
Looking for more information on the above topics? We’d love to speak with you!
Questions?
If you wish to receive the MSD Weekly Market Update in .pdf format (includes FHLBNY rate charts) or to discuss this content further, please email the MSD Team.