Member Services Desk
Weekly Market Update
Economist Views
Click to expand the below image.
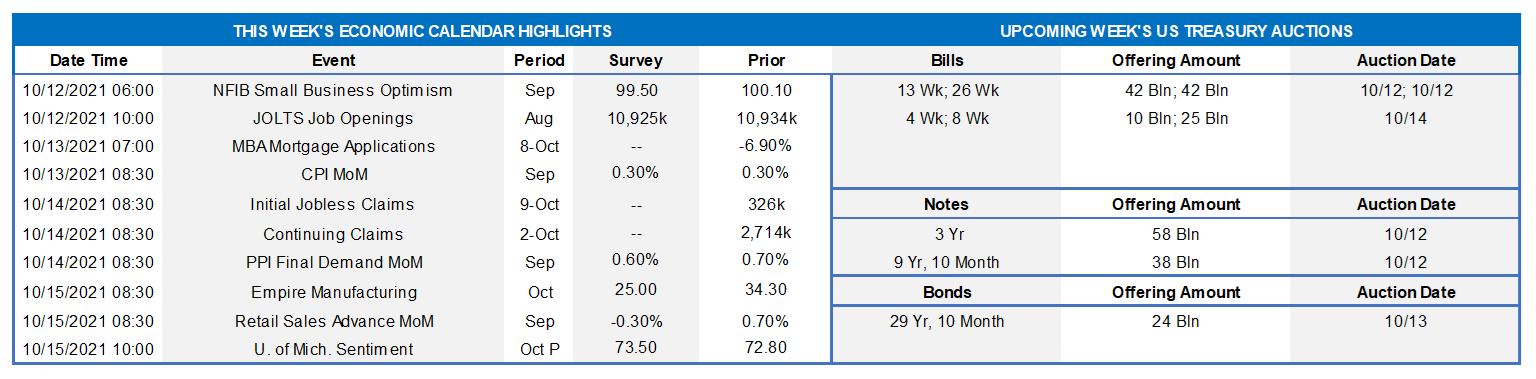
Congress remains front and center over the market and they will continue to grapple with the size and scope of President Biden’s proposed spending plans in the near term. Though a temporary reprieve to the debt ceiling expiration was agreed upon until December – how will it get resolved? The September employment report disappointed the market as payrolls only increased by 194k compared to the survey estimate of 500k. This week we will see the release of CPI, Empire Manufacturing as well as Retail Sales for September.
NFIB Small Business Optimism: After July’s decline and August’s bounce back to over 100, the market expects a slight pullback for this index to 99.5. The mixed bag of slow hiring with higher wages from last week’s employment report is expected to play a role.
Consumer Price Index: Following a 0.30% gain in August, market surveys expect the same for September. Excluding the volatile Food and Energy components the rise is expected to be a bit lower at 0.20%. The year-over-year CPI is expected to remain well above 5%.
Empire Manufacturing Survey: Manufacturers in NYS are expected to report that general business activity expanded for a 16th consecutive month in October, albeit at a slightly slower pace than in August.
Initial and Continuing Claims: New jobless claims are expected to remain elevated, though this week’s initial claims are expected to remain above 300k. In a notably positive sign, Continuing Claims have declined in the past few weeks.
Retail Sales: The survey for September for Retail Sales is expecting a decline of 0.30%. Following the increase in August of 0.70%, the September figure represents a full 1.00% decline over 2 months.
Michigan Sentiment Index: Weekly data suggest that the U of M’s barometer probably rose by less than 1 point to 73.50 from the last reading of 72.80.
Federal Reserve:
- Oct 12 Fed Governor Bostic speaks on inflation at Peterson Institute
- Oct 13 FOMC Meeting Minutes released
- Oct 13 Fed Governor Brainard at the Oklahoma Tribal Leaders virtual conference
- Oct 13 Fed Governor Bowman in South Dakota at Monetary Policy Making and the Economic Outlook
Click to expand the below images.
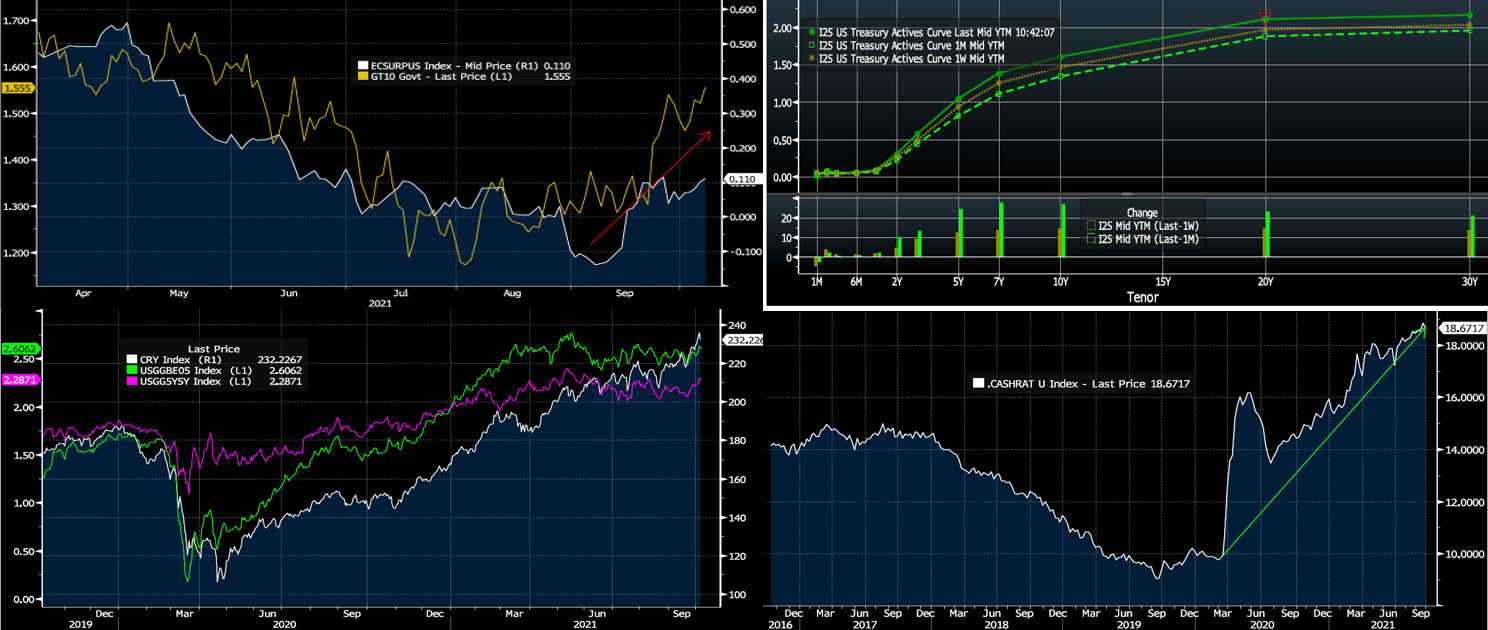
CHART 1 UPPER LEFT
Source: Bloomberg. In addition to inflation concerns and the likely soon-to-come Fed securities purchases taper, rates have been driven higher as well by better-than-expected economic releases since the summer. Shown here is the Bloomberg Economic Surprise Index (RHS, white), essentially a statistical measure of the degree of difference between economic analysts’ forecasts and the actual published data release. Indeed, in the past week, ISM-Services and jobless claims both handily beat (were better than) analyst forecasts. Perhaps the data reflect tentative and positive signs of the economy “fighting off and coming through” the negative impacts of the Delta variant. Unsurprisingly, yields, as portrayed here (10-year UST, LHS, gold, %) have moved higher too.
CHART 2 UPPER RIGHT
Source: Bloomberg. Note: Top pane is yield (%), bottom pane is change (bps). As of midday Friday, the UST curve was modestly steeper week-over-week, led by higher yields in the very long end. Yields were little changed out to 2-year point. The 7 to 10-year sector ended 1-2 bps higher, while the 20 to 30-year sector closed ~6-7 bps higher.
CHART 3 LOWER LEFT
Source: Bloomberg. An elemental force driving yields higher over the past month has been inflation concerns. Supply-chain bottlenecks and constraints, much of it via the pandemic and/or weather events, have pushed commodity prices higher, as clearly shown here by the CRB Commodity Index (RHS, white). In turn, unsurprisingly, market measures of inflation have risen; portrayed here is the 5-year Breakeven and 5-year, 5-year forward Breakeven inflation rates (LHS, %, green and purple, respectively). Recall that Breakeven inflation rates are simply calculated as the yield difference between TIPS and nominal USTs. The market prices for longer-run inflation to moderate, per the lower Breakeven in forward space. The Fed also expects transitory inflation, but the question lingers over how long these supply-chain constraints and inflation forces will linger.
CHART 4 LOWER RIGHT
Source: Bloomberg. Depicted here is the cash ratio, measured as cash as a percentage of total assets, of US commercial banks. At 18.7%, it is clearly at a notably high level relative to prior years. Given the liquidity injected into the banking system via fiscal programs and Fed securities purchases, this situation is not surprising. But the recent rise in yields has possibly presented an opportunity for banks to put money to work whether in loans, if possible, or in securities, if the loan potential is not presently available. Financial institutions should engage in predictive and scenario analytics on their deposits to determine “stickiness” and help steer investment decisions to potentially improve net interest income.
FHLBNY Advance Rates Observations
Front-End Rates
Short-end advance rates finished unchanged to a bp higher on the week despite the market movements in short dated T-Bills from October to December, all connected to the debt ceiling issue. Demand for short paper and the Fed’s RRP, which hit a record $1.6trn last week and stands last ~$1.375trn, remains strong. The Fed acknowledged this dynamic at the last FOMC, as they raised the RRP counterparty limit to $160bn from $80bn. The overall supply/demand paradigm persists in suppressing rate levels, as the GSEs continue to invest large sums into money markets, the TGA continues its decline, Fed purchases instill funds to the banking system, and short-maturity paper is in low supply.
UST issuance overall is now net positive supply in that more is being issued than what the Fed is buying in its programs. However, with short UST rates at rock-bottom levels and the Fed on hold, rates are likely to persist in a near-term sideways pattern. Importantly, weekly net T-bill issuance has been lower since 2020 and negative for months, and Treasury intends to shift issuance out the curve. Moreover, the looming federal debt ceiling may further constrain issuance. Further legislative packages and related borrowing may lead to an eventual increase of T-bill auction sizes and positive net supply, but for now overall market supply/demand dynamics should keep short rates in check from large moves to the upside.
Term Rates
The Advance rate curve finished steeper on the week. The 1 to 5-year sector was 2 to 10bps higher, the 6 to 10-year sector was 11 to 12 bps higher week over week. Kindly refer to the previous section for further color on relevant market dynamics.
On the UST supply front, this week brings $120 Bln – a new 3Y note, and re-openings on the 10 Yr and 30 Yr. The market will closely monitor legislative developments and economic data, as well as digest the jobs report from last Friday. As usual, the state of the pandemic will be followed, and the new debt ceiling December expiration will also be in the market’s focus.
Product Enhancement Alert: FHLBNY has announced an enhancement to the Callable Adjustable Rate Credit Advance (“Callable ARC”). The product features a 1-time call/cancel option (member’s option) to extinguish funding early at no cost via two distinct option structures, thereby giving members flexibility in meeting the demands of a fluctuating balance sheet. Given the shorter-term nature of the current borrowing environment, the minimum term for the Callable ARC has been lowered to 4-month (from the previous 7-month) for our 1-month-left-to-maturity call option (SOFR or 1-month Libor index available) to better meet our members’ needs. Meanwhile, the 3-year Non-Call 2-year product for SOFR continues to be offered to members for their longer-term needs.
New Product Alert: In order to satisfy member needs and provide greater product flexibility to match bond and derivative market conventions, FHLB-NY now offers SOFR-linked advances based on SOFR-index compounding. Note that this product is in addition to SOFR-linked advances based on SOFR-index averaging which have been offered since November 2018.
The Symmetrical Prepayment Advance Feature
With rates at or near multi-year lows, it is a compelling juncture to use the SPA feature on term advances. This feature allows member to capture, at prepayment, changes in the Fair Value of the advance which are favorable to the member. Contact us to discuss.
Looking for more information on the above topics? We’d love to speak with you!
Questions?
If you wish to receive the MSD Weekly Market Update in .pdf format (includes FHLBNY rate charts) or to discuss this content further, please email the MSD Team.